
|
|||||
|
 | |
| |
| |
| |
| |
| |
|
Gene: STK17B |
Gene summary for STK17B |
| Gene information | Species | Human | Gene symbol | STK17B | Gene ID | 9262 |
| Gene name | serine/threonine kinase 17b | |
| Gene Alias | DRAK2 | |
| Cytomap | 2q32.3 | |
| Gene Type | protein-coding | GO ID | GO:0006464 | UniProtAcc | O94768 |
Top |
Malignant transformation analysis |
| Identification of the aberrant gene expression in precancerous and cancerous lesions by comparing the gene expression of stem-like cells in diseased tissues with normal stem cells |
| Entrez ID | Symbol | Replicates | Species | Organ | Tissue | Adj P-value | Log2FC | Malignancy |
| 9262 | STK17B | HTA11_2487_2000001011 | Human | Colorectum | SER | 3.31e-04 | 4.42e-01 | -0.1808 |
| 9262 | STK17B | HTA11_347_2000001011 | Human | Colorectum | AD | 4.18e-03 | 2.78e-01 | -0.1954 |
| 9262 | STK17B | HTA11_411_2000001011 | Human | Colorectum | SER | 4.65e-02 | 6.13e-01 | -0.2602 |
| 9262 | STK17B | HTA11_1391_2000001011 | Human | Colorectum | AD | 2.95e-03 | 2.82e-01 | -0.059 |
| 9262 | STK17B | LZE2D | Human | Esophagus | HGIN | 4.51e-02 | 4.61e-01 | 0.0642 |
| 9262 | STK17B | LZE4T | Human | Esophagus | ESCC | 1.57e-05 | 4.13e-01 | 0.0811 |
| 9262 | STK17B | LZE5T | Human | Esophagus | ESCC | 1.14e-03 | 1.64e-01 | 0.0514 |
| 9262 | STK17B | LZE20T | Human | Esophagus | ESCC | 7.51e-09 | 4.46e-01 | 0.0662 |
| 9262 | STK17B | LZE22D1 | Human | Esophagus | HGIN | 2.30e-02 | 2.54e-01 | 0.0595 |
| 9262 | STK17B | LZE24T | Human | Esophagus | ESCC | 1.03e-06 | 3.89e-01 | 0.0596 |
| 9262 | STK17B | LZE6T | Human | Esophagus | ESCC | 1.14e-06 | 7.91e-01 | 0.0845 |
| 9262 | STK17B | P1T-E | Human | Esophagus | ESCC | 1.33e-09 | 6.42e-01 | 0.0875 |
| 9262 | STK17B | P2T-E | Human | Esophagus | ESCC | 2.30e-14 | 1.62e-02 | 0.1177 |
| 9262 | STK17B | P4T-E | Human | Esophagus | ESCC | 2.97e-18 | 2.77e-01 | 0.1323 |
| 9262 | STK17B | P5T-E | Human | Esophagus | ESCC | 9.46e-22 | 6.04e-01 | 0.1327 |
| 9262 | STK17B | P8T-E | Human | Esophagus | ESCC | 5.58e-08 | 2.35e-01 | 0.0889 |
| 9262 | STK17B | P9T-E | Human | Esophagus | ESCC | 8.27e-11 | 4.33e-02 | 0.1131 |
| 9262 | STK17B | P10T-E | Human | Esophagus | ESCC | 1.16e-11 | 1.72e-01 | 0.116 |
| 9262 | STK17B | P11T-E | Human | Esophagus | ESCC | 8.71e-04 | 4.25e-01 | 0.1426 |
| 9262 | STK17B | P12T-E | Human | Esophagus | ESCC | 8.21e-19 | 5.80e-01 | 0.1122 |
| Page: 1 2 3 4 5 6 |
| Tissue | Expression Dynamics | Abbreviation |
| Colorectum (GSE201348) |  | FAP: Familial adenomatous polyposis |
| CRC: Colorectal cancer | ||
| Colorectum (HTA11) |  | AD: Adenomas |
| SER: Sessile serrated lesions | ||
| MSI-H: Microsatellite-high colorectal cancer | ||
| MSS: Microsatellite stable colorectal cancer | ||
| Esophagus | 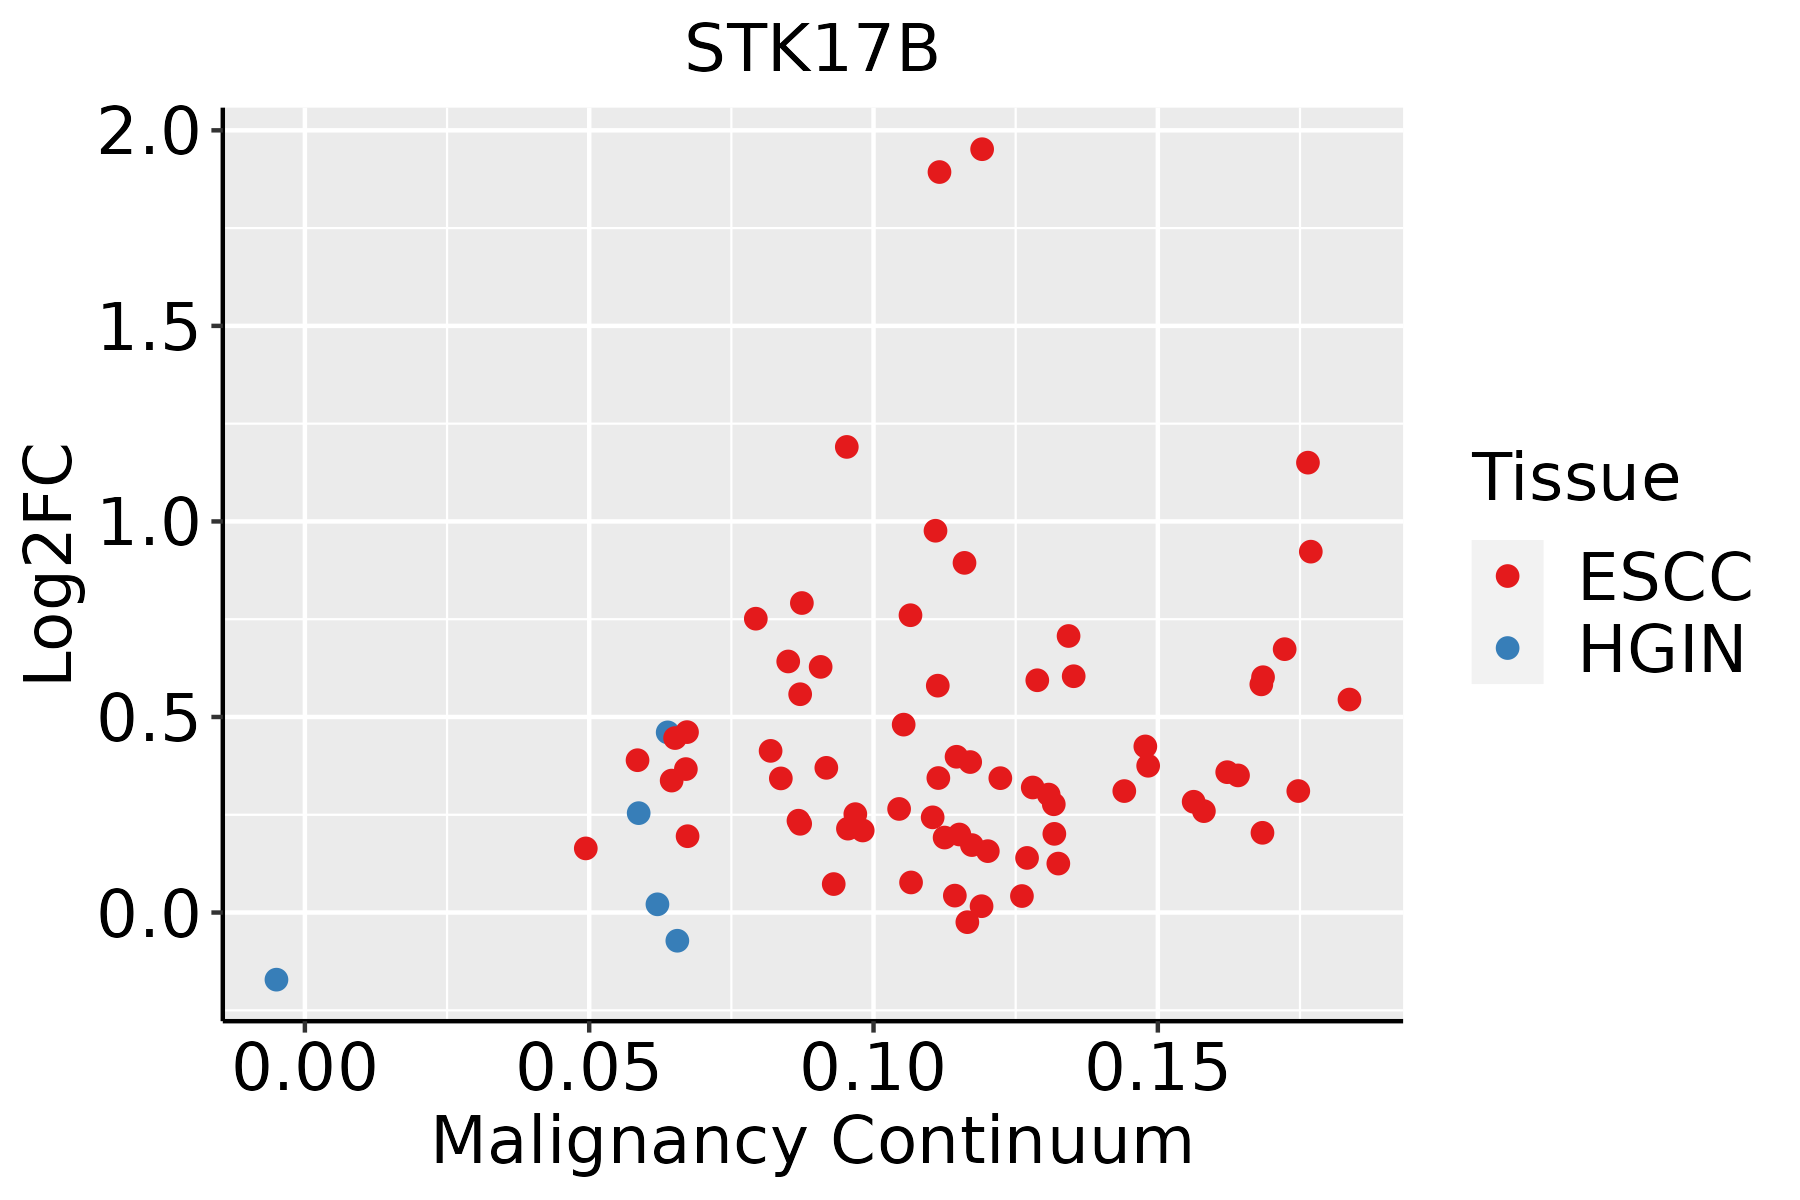 | ESCC: Esophageal squamous cell carcinoma |
| HGIN: High-grade intraepithelial neoplasias | ||
| LGIN: Low-grade intraepithelial neoplasias | ||
| Lung |  | AAH: Atypical adenomatous hyperplasia |
| AIS: Adenocarcinoma in situ | ||
| IAC: Invasive lung adenocarcinoma | ||
| MIA: Minimally invasive adenocarcinoma | ||
| Oral Cavity | 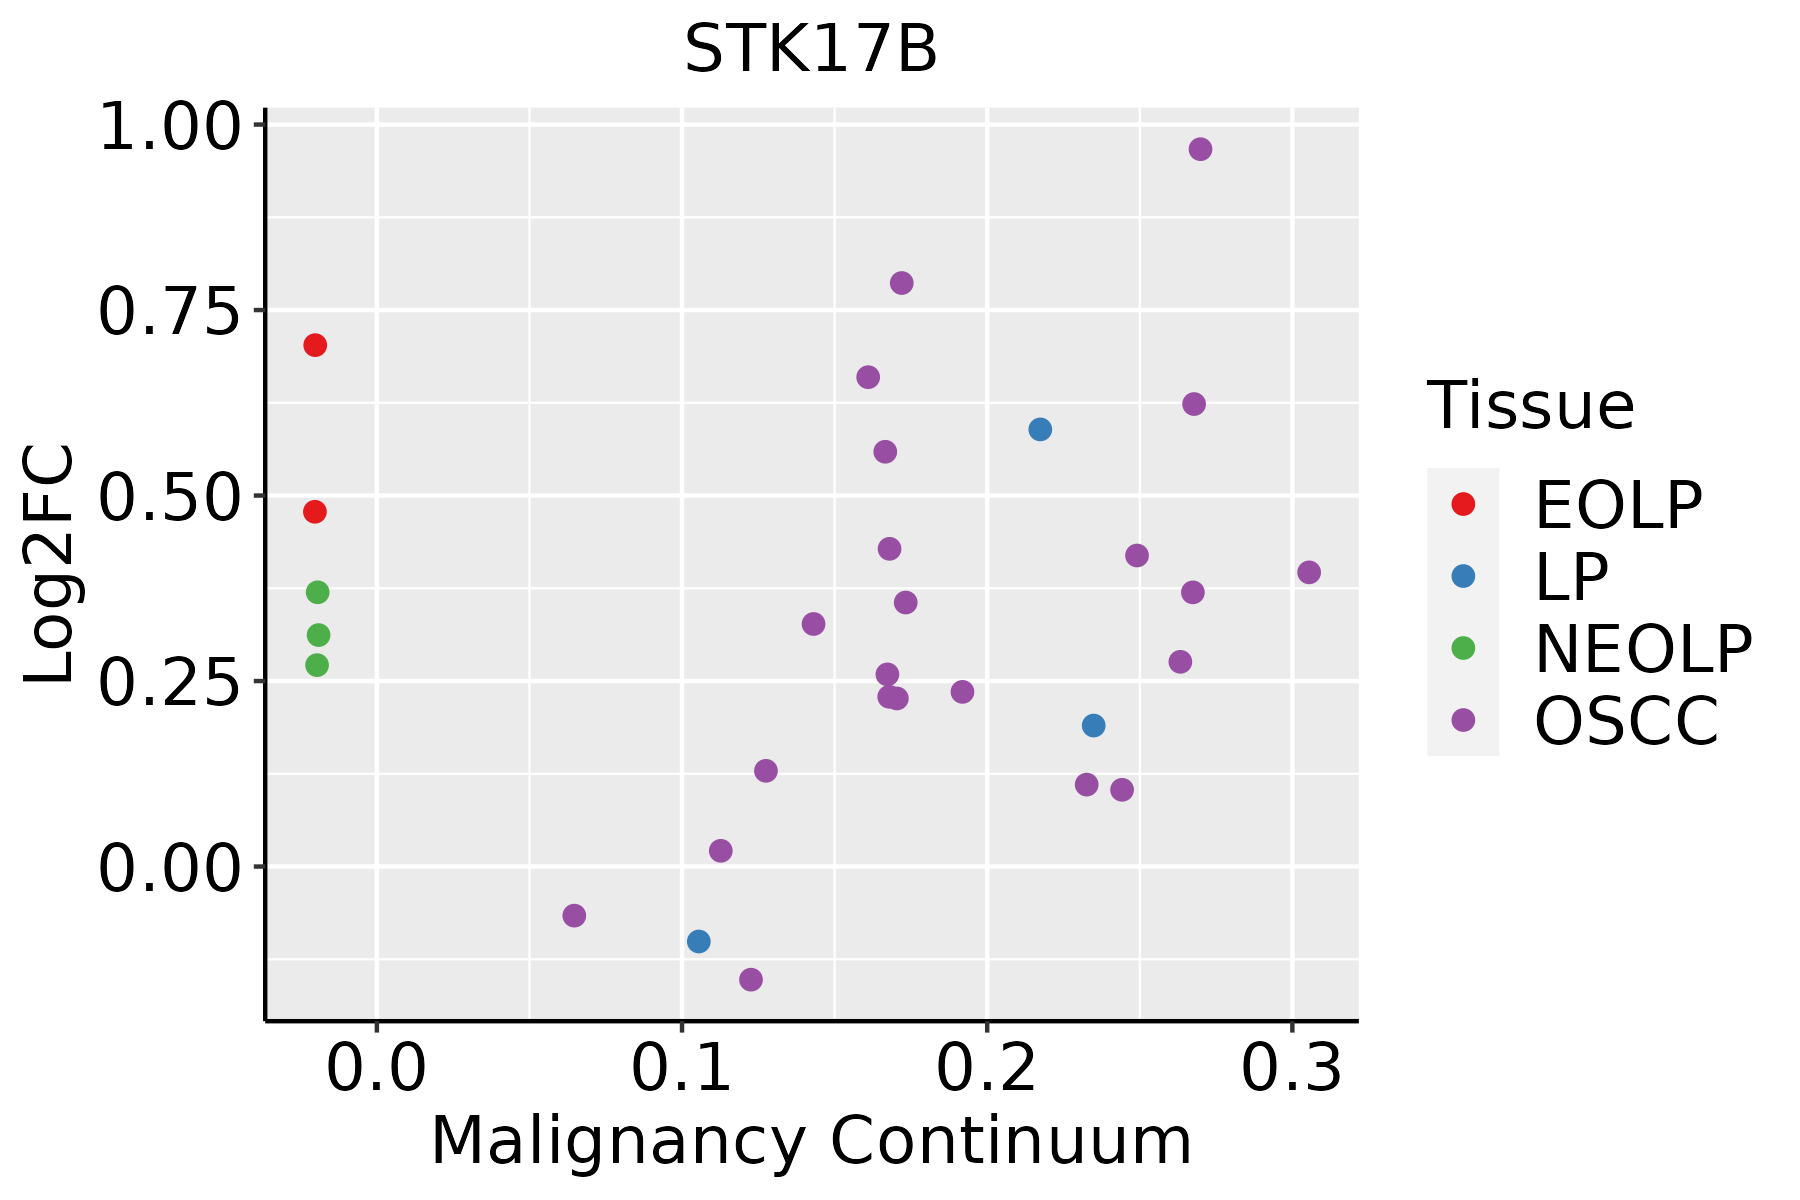 | EOLP: Erosive Oral lichen planus |
| LP: leukoplakia | ||
| NEOLP: Non-erosive oral lichen planus | ||
| OSCC: Oral squamous cell carcinoma | ||
| Prostate |  | BPH: Benign Prostatic Hyperplasia |
| Thyroid | 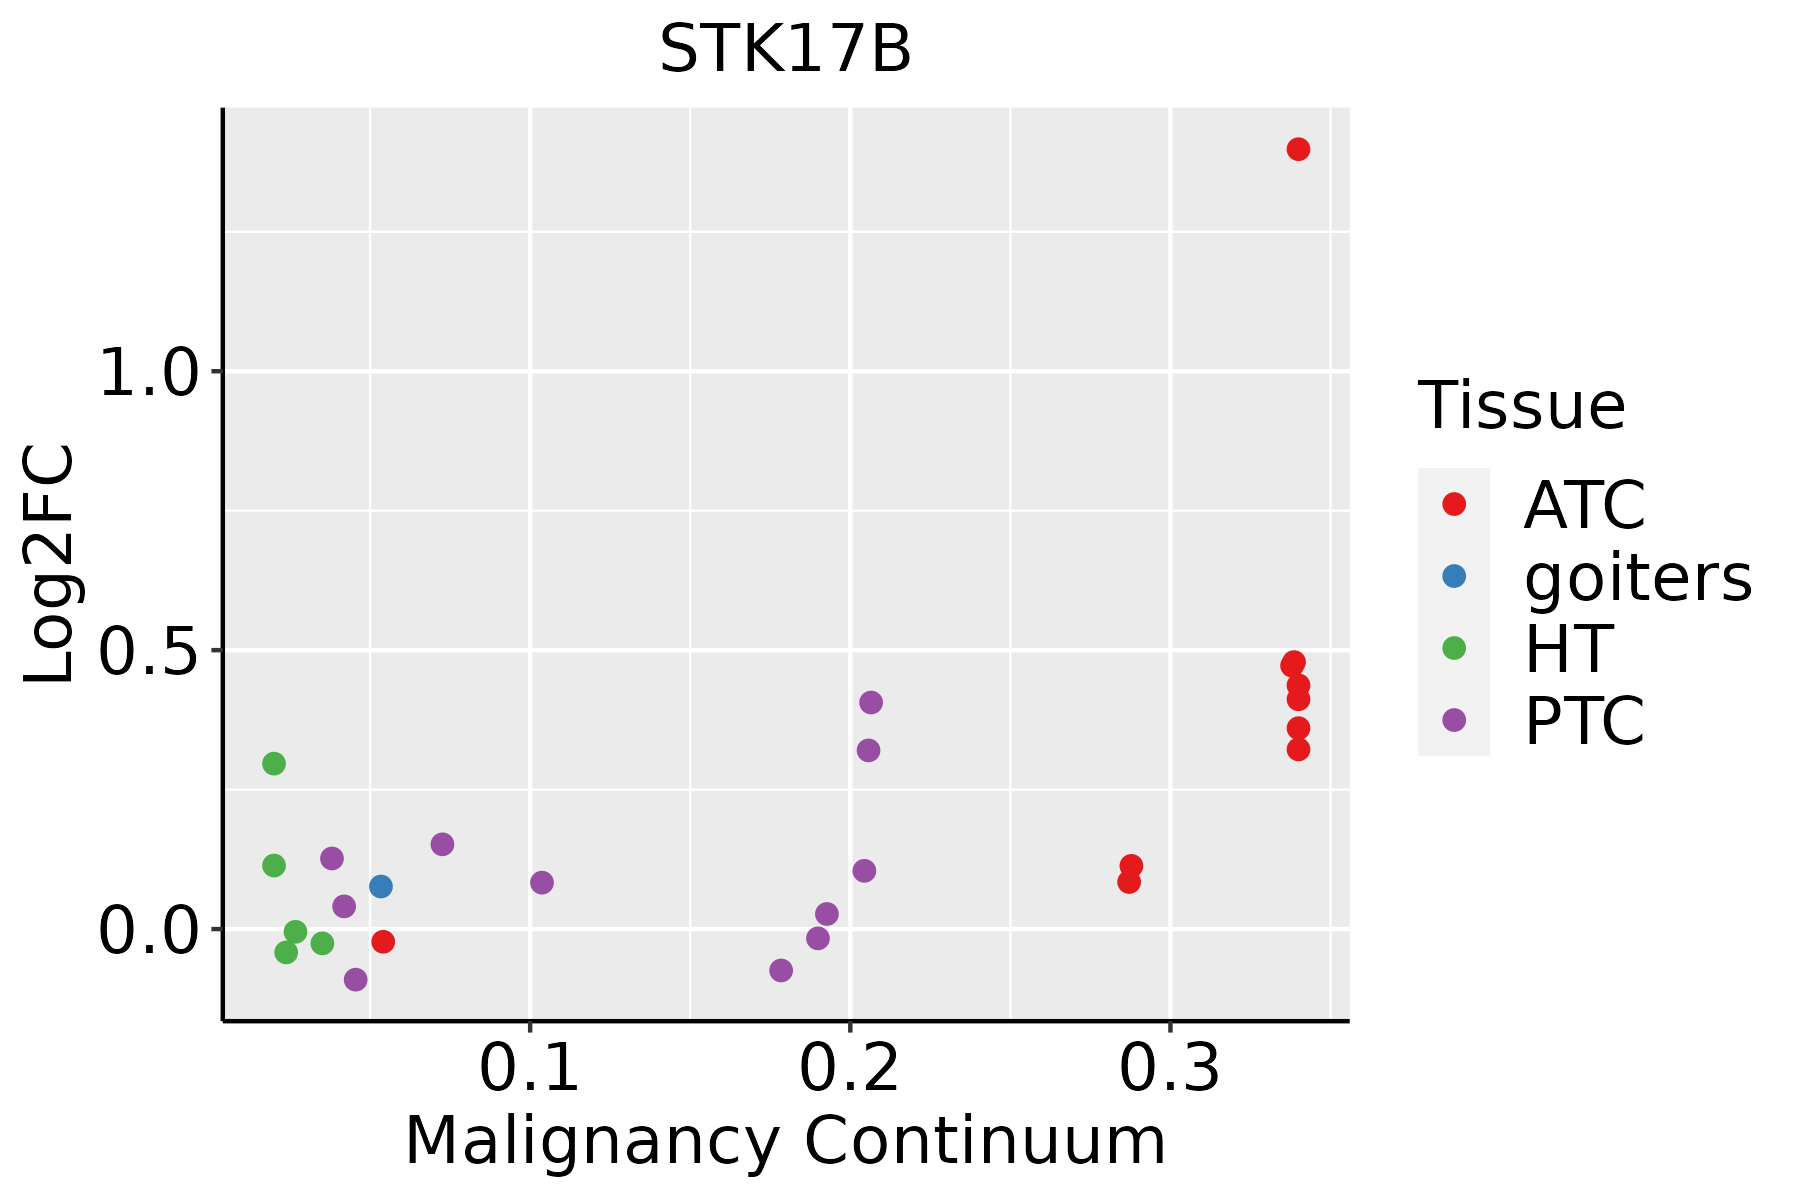 | ATC: Anaplastic thyroid cancer |
| HT: Hashimoto's thyroiditis | ||
| PTC: Papillary thyroid cancer |
| ∗log2FC in expression of this searched gene in stem-like cells from each diseased tissue sample relative to stem-like cells in normal samples in each tissue plotted against the malignancy continuum. Samples are colored based on if they are from different disease stage. |
Top |
Malignant transformation related pathway analysis |
| Find out the enriched GO biological processes and KEGG pathways involved in transition from healthy to precancer to cancer |
| Tissue | Disease Stage | Enriched GO biological Processes |
| Colorectum | AD |  |
| Colorectum | SER |  |
| Colorectum | MSS |  |
| Colorectum | MSI-H |  |
| Colorectum | FAP |  |
| ∗Top 15 enriched GO BP terms are showed in the bar plot of each disease state in each tissue. Each row represents a significant GO biological process which is colored according to the -log10(p.adjust). |
| Page: 1 2 3 4 5 6 7 8 9 |
| GO ID | Tissue | Disease Stage | Description | Gene Ratio | Bg Ratio | pvalue | p.adjust | Count |
| GO:0046777 | Colorectum | AD | protein autophosphorylation | 74/3918 | 227/18723 | 2.48e-05 | 4.76e-04 | 74 |
| GO:00467771 | Colorectum | SER | protein autophosphorylation | 60/2897 | 227/18723 | 1.36e-05 | 4.25e-04 | 60 |
| GO:004677710 | Esophagus | ESCC | protein autophosphorylation | 138/8552 | 227/18723 | 2.98e-06 | 3.38e-05 | 138 |
| GO:00443463 | Esophagus | ESCC | fibroblast apoptotic process | 16/8552 | 22/18723 | 9.46e-03 | 3.28e-02 | 16 |
| GO:00467776 | Lung | IAC | protein autophosphorylation | 51/2061 | 227/18723 | 4.85e-07 | 3.10e-05 | 51 |
| GO:00467779 | Oral cavity | OSCC | protein autophosphorylation | 123/7305 | 227/18723 | 2.31e-06 | 2.93e-05 | 123 |
| GO:0044346 | Oral cavity | OSCC | fibroblast apoptotic process | 16/7305 | 22/18723 | 1.40e-03 | 6.79e-03 | 16 |
| GO:2000269 | Oral cavity | OSCC | regulation of fibroblast apoptotic process | 13/7305 | 19/18723 | 9.07e-03 | 3.26e-02 | 13 |
| GO:00443461 | Oral cavity | LP | fibroblast apoptotic process | 13/4623 | 22/18723 | 6.11e-04 | 5.58e-03 | 13 |
| GO:20002691 | Oral cavity | LP | regulation of fibroblast apoptotic process | 10/4623 | 19/18723 | 8.09e-03 | 4.40e-02 | 10 |
| GO:004677713 | Oral cavity | EOLP | protein autophosphorylation | 49/2218 | 227/18723 | 2.04e-05 | 3.21e-04 | 49 |
| GO:00443462 | Oral cavity | EOLP | fibroblast apoptotic process | 8/2218 | 22/18723 | 2.64e-03 | 1.59e-02 | 8 |
| GO:004677722 | Oral cavity | NEOLP | protein autophosphorylation | 45/2005 | 227/18723 | 3.28e-05 | 4.87e-04 | 45 |
| GO:00467778 | Prostate | BPH | protein autophosphorylation | 52/3107 | 227/18723 | 8.26e-03 | 3.59e-02 | 52 |
| GO:004677712 | Prostate | Tumor | protein autophosphorylation | 54/3246 | 227/18723 | 7.93e-03 | 3.52e-02 | 54 |
| GO:004677716 | Thyroid | PTC | protein autophosphorylation | 110/5968 | 227/18723 | 1.25e-07 | 2.44e-06 | 110 |
| GO:00443465 | Thyroid | PTC | fibroblast apoptotic process | 13/5968 | 22/18723 | 7.65e-03 | 3.25e-02 | 13 |
| GO:004677717 | Thyroid | ATC | protein autophosphorylation | 114/6293 | 227/18723 | 1.54e-07 | 2.49e-06 | 114 |
| GO:004434612 | Thyroid | ATC | fibroblast apoptotic process | 16/6293 | 22/18723 | 2.03e-04 | 1.35e-03 | 16 |
| GO:20002693 | Thyroid | ATC | regulation of fibroblast apoptotic process | 13/6293 | 19/18723 | 2.03e-03 | 9.63e-03 | 13 |
| Page: 1 |
| Pathway ID | Tissue | Disease Stage | Description | Gene Ratio | Bg Ratio | pvalue | p.adjust | qvalue | Count |
| Page: 1 |
Top |
Cell-cell communication analysis |
| Identification of potential cell-cell interactions between two cell types and their ligand-receptor pairs for different disease states |
| Ligand | Receptor | LRpair | Pathway | Tissue | Disease Stage |
| Page: 1 |
Top |
Single-cell gene regulatory network inference analysis |
| Find out the significant the regulons (TFs) and the target genes of each regulon across cell types for different disease states |
| TF | Cell Type | Tissue | Disease Stage | Target Gene | RSS | Regulon Activity |
| ∗The dot plots of a searched regulon are shown for all cell subpopulations in each disease state of each tissue based on the regulon specific score inferred using pySCENIC and by calculating the average expression. |
| Page: 1 |
Top |
Somatic mutation of malignant transformation related genes |
| Annotation of somatic variants for genes involved in malignant transformation |
| Hugo Symbol | Variant Class | Variant Classification | dbSNP RS | HGVSc | HGVSp | HGVSp Short | SWISSPROT | BIOTYPE | SIFT | PolyPhen | Tumor Sample Barcode | Tissue | Histology | Sex | Age | Stage | Therapy Types | Drugs | Outcome |
| STK17B | SNV | Missense_Mutation | novel | c.895N>A | p.Glu299Lys | p.E299K | O94768 | protein_coding | tolerated(0.86) | benign(0) | TCGA-AC-A4ZE-01 | Breast | breast invasive carcinoma | Female | <65 | I/II | Unknown | Unknown | SD |
| STK17B | SNV | Missense_Mutation | c.964G>A | p.Glu322Lys | p.E322K | O94768 | protein_coding | tolerated(0.08) | possibly_damaging(0.835) | TCGA-AN-A0XW-01 | Breast | breast invasive carcinoma | Female | <65 | III/IV | Unknown | Unknown | SD | |
| STK17B | SNV | Missense_Mutation | c.1023N>C | p.Glu341Asp | p.E341D | O94768 | protein_coding | deleterious(0.03) | possibly_damaging(0.784) | TCGA-DS-A1OC-01 | Cervix | cervical & endocervical cancer | Female | <65 | I/II | Chemotherapy | gemcitabine | SD | |
| STK17B | SNV | Missense_Mutation | c.71A>C | p.Lys24Thr | p.K24T | O94768 | protein_coding | tolerated(0.09) | benign(0.147) | TCGA-AA-3977-01 | Colorectum | colon adenocarcinoma | Male | >=65 | I/II | Unknown | Unknown | SD | |
| STK17B | SNV | Missense_Mutation | c.991A>C | p.Asn331His | p.N331H | O94768 | protein_coding | tolerated(0.19) | benign(0.305) | TCGA-CM-6171-01 | Colorectum | colon adenocarcinoma | Female | >=65 | I/II | Unknown | Unknown | SD | |
| STK17B | SNV | Missense_Mutation | novel | c.787N>G | p.Ser263Ala | p.S263A | O94768 | protein_coding | deleterious(0) | probably_damaging(0.987) | TCGA-A5-A0G1-01 | Endometrium | uterine corpus endometrioid carcinoma | Female | >=65 | I/II | Unknown | Unknown | SD |
| STK17B | SNV | Missense_Mutation | novel | c.404N>C | p.Val135Ala | p.V135A | O94768 | protein_coding | tolerated(0.11) | benign(0.181) | TCGA-A5-A0G2-01 | Endometrium | uterine corpus endometrioid carcinoma | Female | <65 | III/IV | Unknown | Unknown | SD |
| STK17B | SNV | Missense_Mutation | novel | c.187N>A | p.Phe63Ile | p.F63I | O94768 | protein_coding | deleterious(0.02) | benign(0.377) | TCGA-AJ-A3BH-01 | Endometrium | uterine corpus endometrioid carcinoma | Female | Unknown | I/II | Unknown | Unknown | SD |
| STK17B | SNV | Missense_Mutation | rs756886954 | c.1063N>T | p.Arg355Cys | p.R355C | O94768 | protein_coding | deleterious(0) | probably_damaging(0.951) | TCGA-AJ-A3EL-01 | Endometrium | uterine corpus endometrioid carcinoma | Female | <65 | I/II | Unknown | Unknown | SD |
| STK17B | SNV | Missense_Mutation | c.197A>C | p.Lys66Thr | p.K66T | O94768 | protein_coding | deleterious(0) | probably_damaging(0.997) | TCGA-AP-A059-01 | Endometrium | uterine corpus endometrioid carcinoma | Female | >=65 | I/II | Unknown | Unknown | SD |
| Page: 1 2 3 4 5 |
Top |
Related drugs of malignant transformation related genes |
| Identification of chemicals and drugs interact with genes involved in malignant transfromation |
| (DGIdb 4.0) |
| Entrez ID | Symbol | Category | Interaction Types | Drug Claim Name | Drug Name | PMIDs |
| Page: 1 |

Copyright 2023-Present -The University of Texas Health Science Center at Houston |