
|
|||||
|
 | |
| |
| |
| |
| |
| |
|
Gene: STK17A |
Gene summary for STK17A |
| Gene information | Species | Human | Gene symbol | STK17A | Gene ID | 9263 |
| Gene name | serine/threonine kinase 17a | |
| Gene Alias | DRAK1 | |
| Cytomap | 7p13 | |
| Gene Type | protein-coding | GO ID | GO:0006464 | UniProtAcc | Q9UEE5 |
Top |
Malignant transformation analysis |
| Identification of the aberrant gene expression in precancerous and cancerous lesions by comparing the gene expression of stem-like cells in diseased tissues with normal stem cells |
| Entrez ID | Symbol | Replicates | Species | Organ | Tissue | Adj P-value | Log2FC | Malignancy |
| 9263 | STK17A | LZE4T | Human | Esophagus | ESCC | 2.94e-07 | 5.48e-02 | 0.0811 |
| 9263 | STK17A | LZE7T | Human | Esophagus | ESCC | 9.76e-08 | -2.96e-01 | 0.0667 |
| 9263 | STK17A | LZE8T | Human | Esophagus | ESCC | 1.98e-06 | -4.36e-01 | 0.067 |
| 9263 | STK17A | LZE20T | Human | Esophagus | ESCC | 5.90e-07 | 5.85e-01 | 0.0662 |
| 9263 | STK17A | LZE21D1 | Human | Esophagus | HGIN | 3.90e-05 | -5.99e-02 | 0.0632 |
| 9263 | STK17A | LZE22T | Human | Esophagus | ESCC | 1.35e-03 | 8.95e-01 | 0.068 |
| 9263 | STK17A | LZE24T | Human | Esophagus | ESCC | 1.86e-11 | 7.81e-01 | 0.0596 |
| 9263 | STK17A | LZE6T | Human | Esophagus | ESCC | 8.93e-04 | -3.73e-01 | 0.0845 |
| 9263 | STK17A | P1T-E | Human | Esophagus | ESCC | 1.08e-08 | 8.11e-01 | 0.0875 |
| 9263 | STK17A | P2T-E | Human | Esophagus | ESCC | 9.53e-39 | 1.18e+00 | 0.1177 |
| 9263 | STK17A | P4T-E | Human | Esophagus | ESCC | 1.52e-21 | 7.74e-01 | 0.1323 |
| 9263 | STK17A | P5T-E | Human | Esophagus | ESCC | 5.08e-10 | 2.62e-01 | 0.1327 |
| 9263 | STK17A | P8T-E | Human | Esophagus | ESCC | 1.63e-28 | 9.11e-01 | 0.0889 |
| 9263 | STK17A | P9T-E | Human | Esophagus | ESCC | 5.20e-13 | 5.83e-01 | 0.1131 |
| 9263 | STK17A | P11T-E | Human | Esophagus | ESCC | 4.74e-21 | 1.67e+00 | 0.1426 |
| 9263 | STK17A | P12T-E | Human | Esophagus | ESCC | 1.80e-18 | 8.29e-01 | 0.1122 |
| 9263 | STK17A | P15T-E | Human | Esophagus | ESCC | 4.55e-25 | 9.87e-01 | 0.1149 |
| 9263 | STK17A | P16T-E | Human | Esophagus | ESCC | 1.85e-05 | 4.23e-03 | 0.1153 |
| 9263 | STK17A | P17T-E | Human | Esophagus | ESCC | 8.42e-11 | 1.08e+00 | 0.1278 |
| 9263 | STK17A | P19T-E | Human | Esophagus | ESCC | 2.43e-10 | 1.48e+00 | 0.1662 |
| Page: 1 2 3 4 5 6 7 8 |
| Tissue | Expression Dynamics | Abbreviation |
| Esophagus | 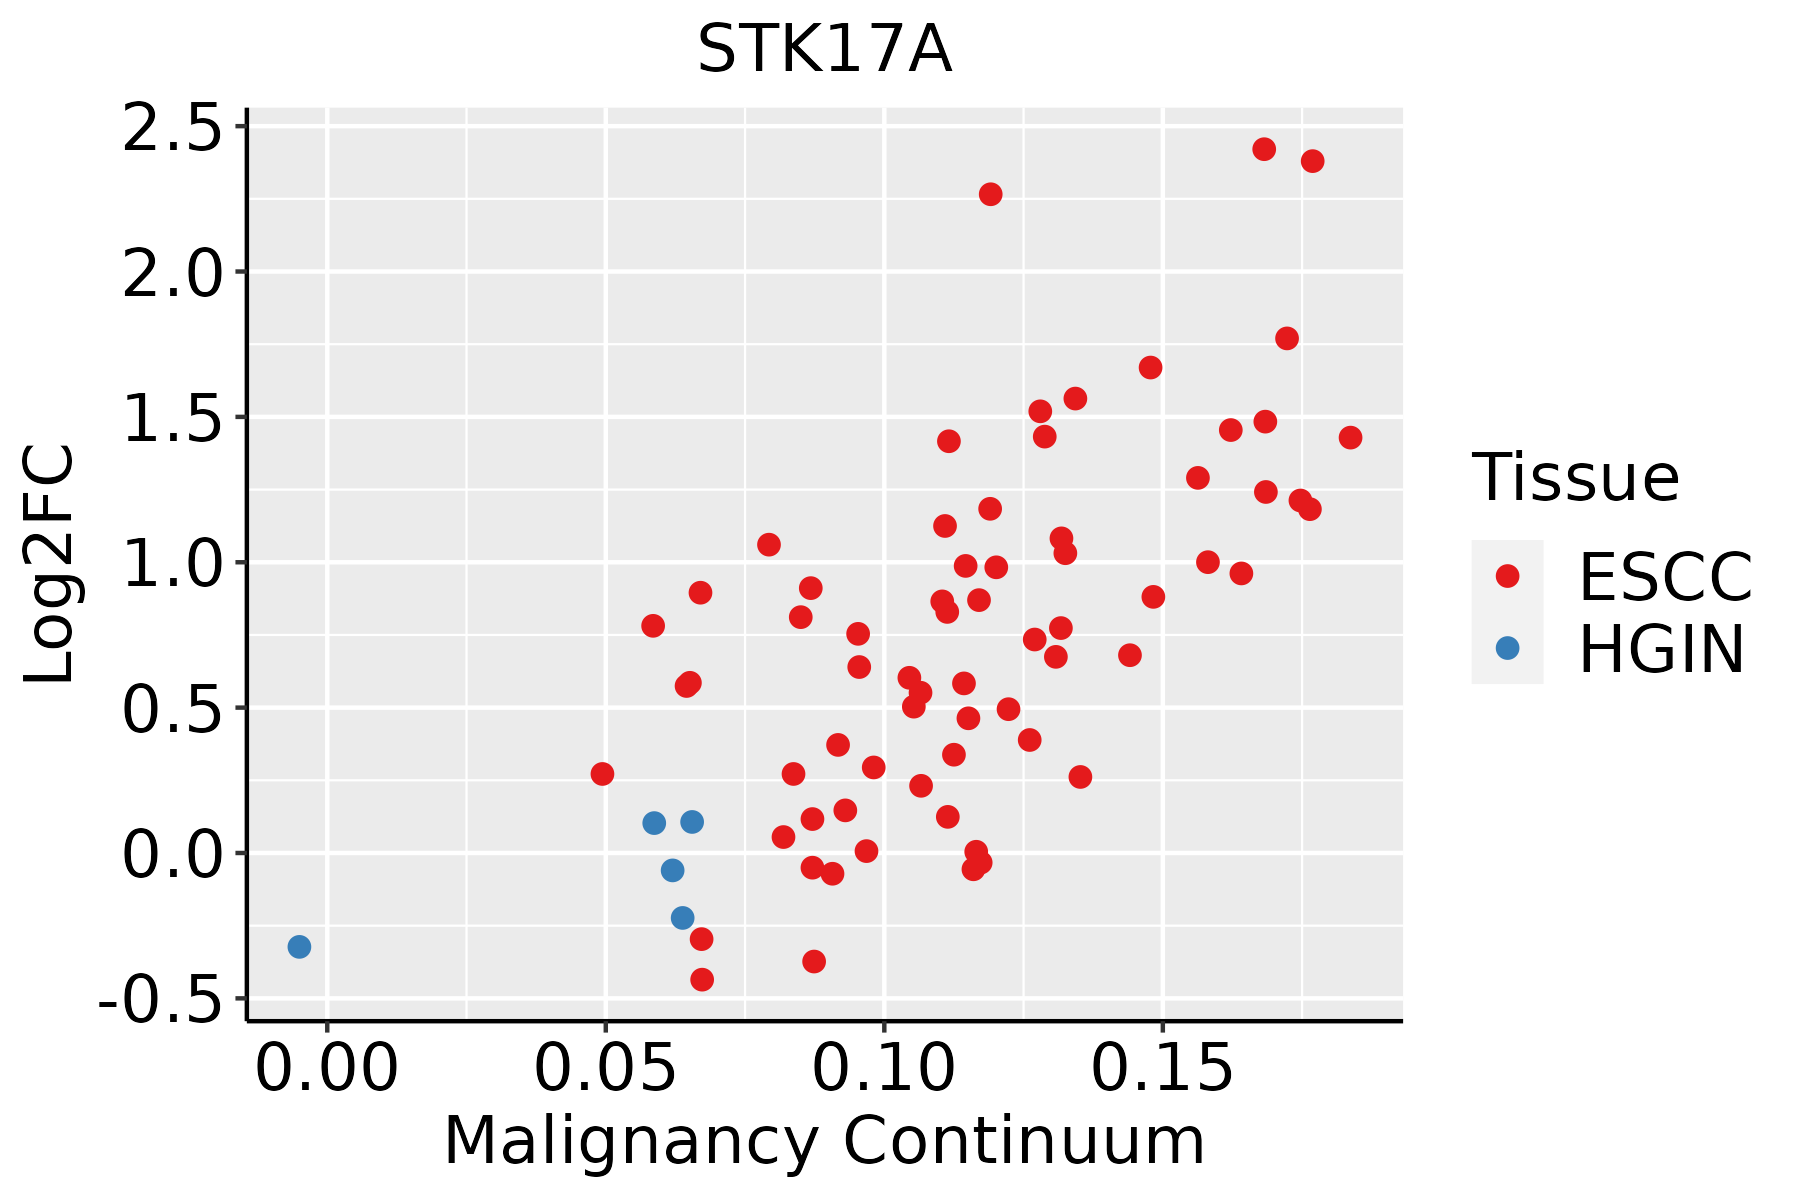 | ESCC: Esophageal squamous cell carcinoma |
| HGIN: High-grade intraepithelial neoplasias | ||
| LGIN: Low-grade intraepithelial neoplasias | ||
| Liver |  | HCC: Hepatocellular carcinoma |
| NAFLD: Non-alcoholic fatty liver disease | ||
| Lung |  | AAH: Atypical adenomatous hyperplasia |
| AIS: Adenocarcinoma in situ | ||
| IAC: Invasive lung adenocarcinoma | ||
| MIA: Minimally invasive adenocarcinoma | ||
| Oral Cavity |  | EOLP: Erosive Oral lichen planus |
| LP: leukoplakia | ||
| NEOLP: Non-erosive oral lichen planus | ||
| OSCC: Oral squamous cell carcinoma | ||
| Prostate | 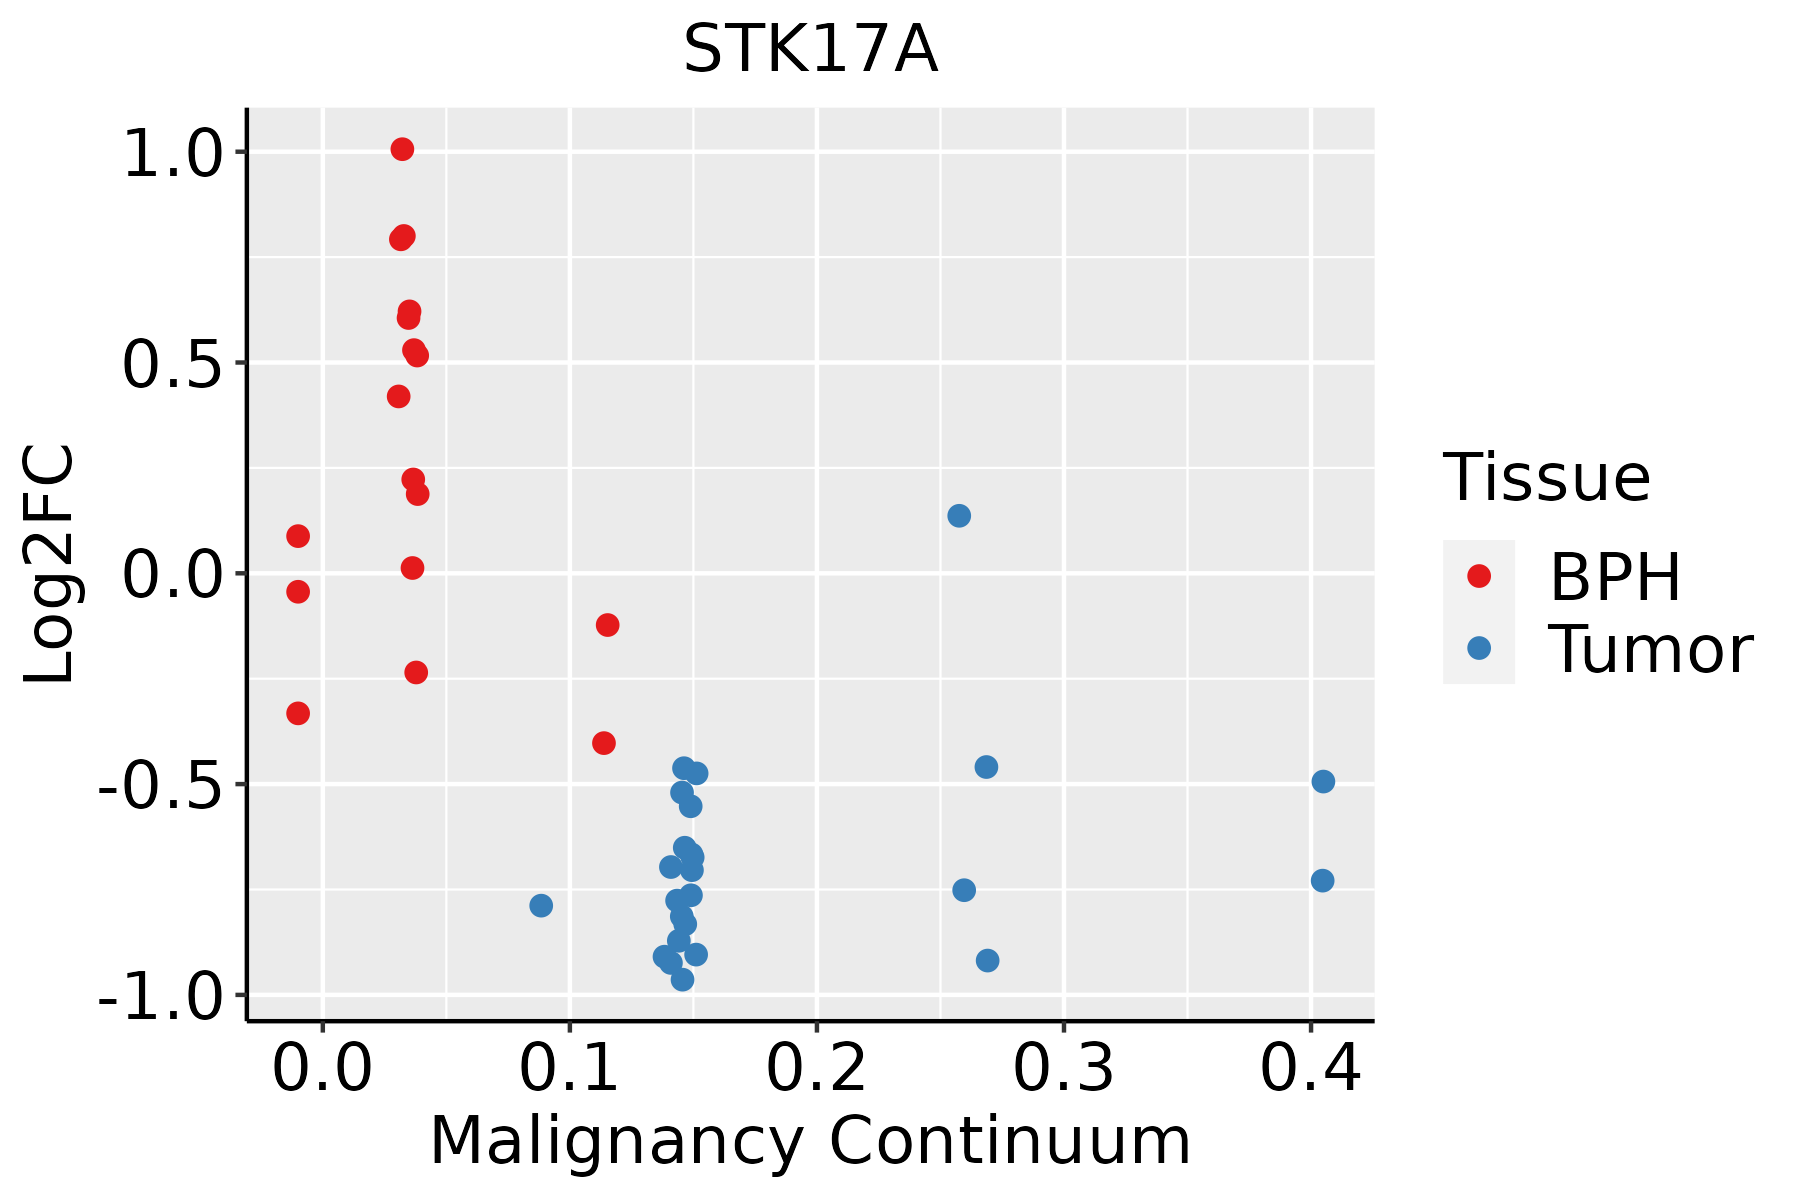 | BPH: Benign Prostatic Hyperplasia |
| Skin |  | AK: Actinic keratosis |
| cSCC: Cutaneous squamous cell carcinoma | ||
| SCCIS:squamous cell carcinoma in situ | ||
| Thyroid | 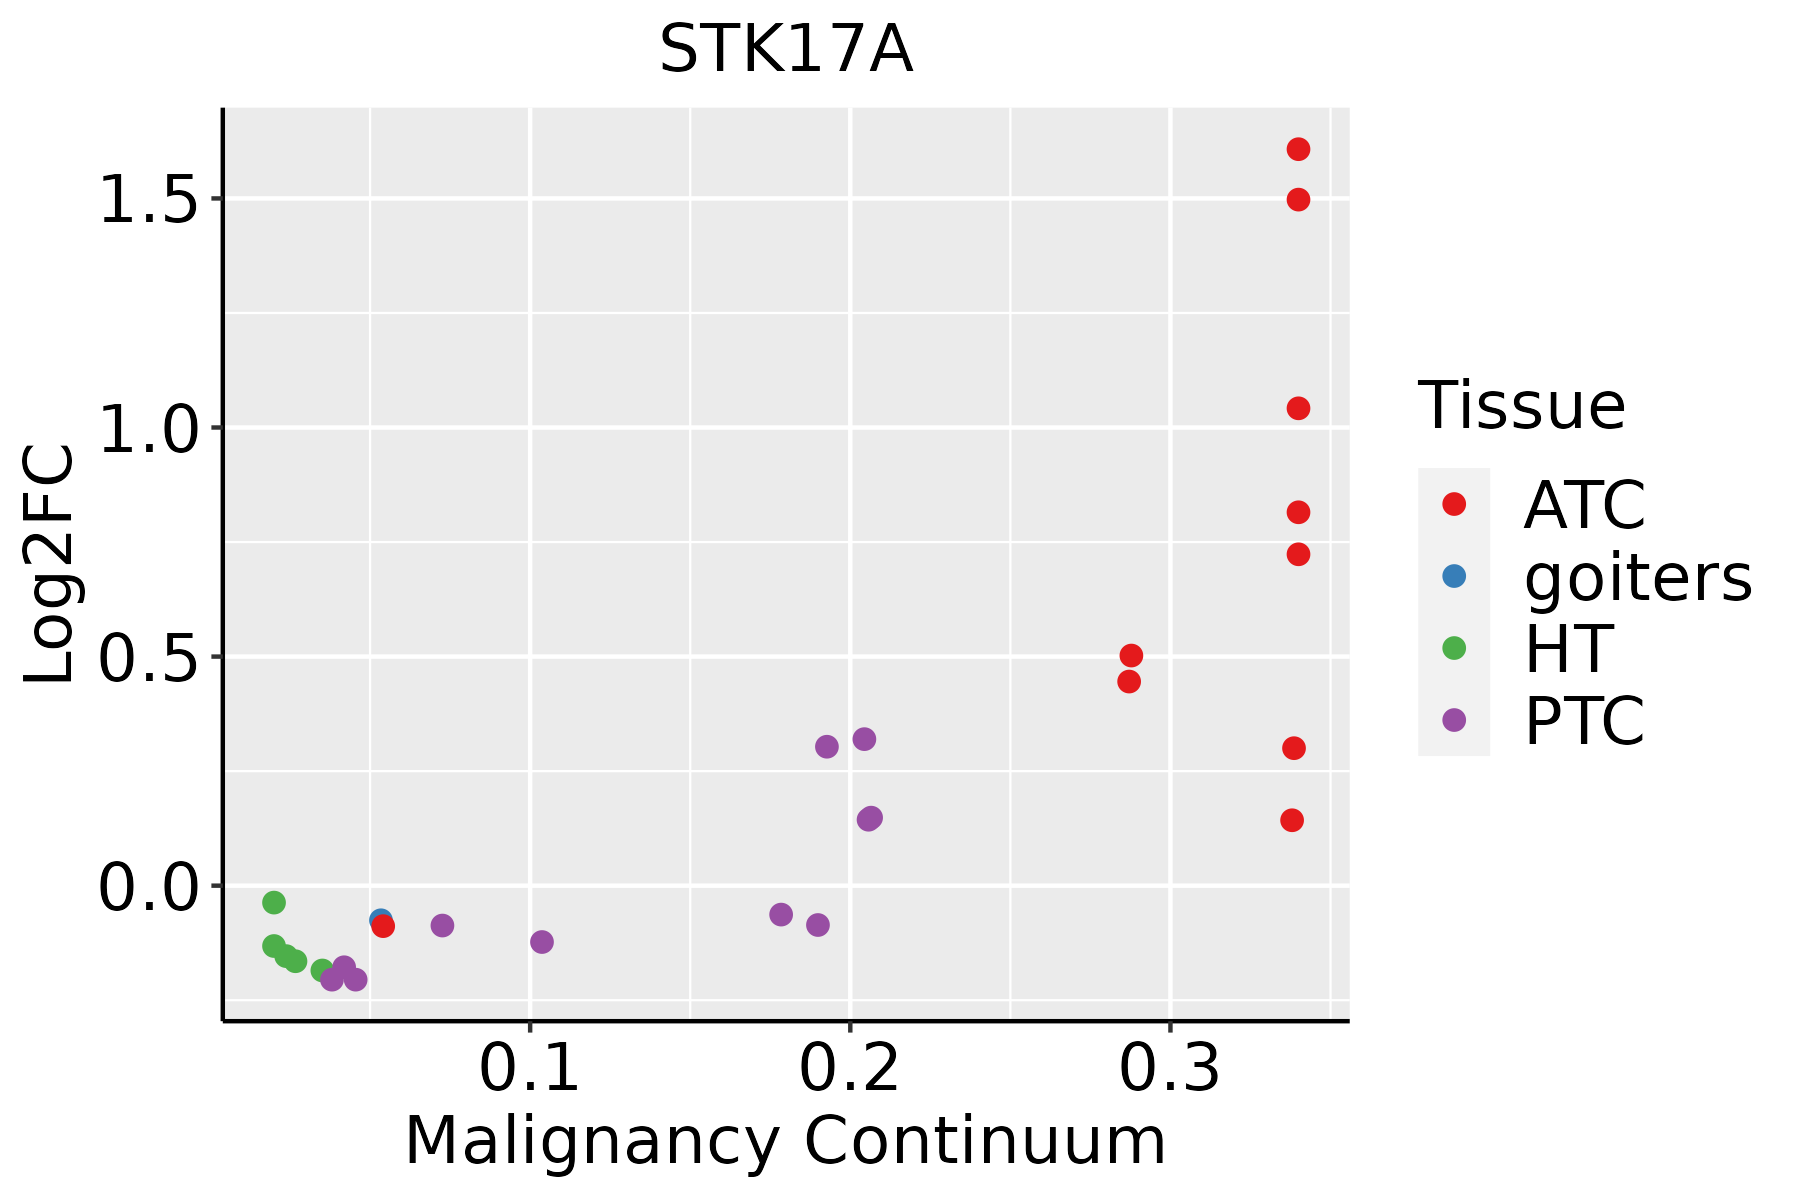 | ATC: Anaplastic thyroid cancer |
| HT: Hashimoto's thyroiditis | ||
| PTC: Papillary thyroid cancer |
| ∗log2FC in expression of this searched gene in stem-like cells from each diseased tissue sample relative to stem-like cells in normal samples in each tissue plotted against the malignancy continuum. Samples are colored based on if they are from different disease stage. |
Top |
Malignant transformation related pathway analysis |
| Find out the enriched GO biological processes and KEGG pathways involved in transition from healthy to precancer to cancer |
| Tissue | Disease Stage | Enriched GO biological Processes |
| Colorectum | AD |  |
| Colorectum | SER |  |
| Colorectum | MSS |  |
| Colorectum | MSI-H |  |
| Colorectum | FAP |  |
| ∗Top 15 enriched GO BP terms are showed in the bar plot of each disease state in each tissue. Each row represents a significant GO biological process which is colored according to the -log10(p.adjust). |
| Page: 1 2 3 4 5 6 7 8 9 |
| GO ID | Tissue | Disease Stage | Description | Gene Ratio | Bg Ratio | pvalue | p.adjust | Count |
| GO:200037718 | Esophagus | ESCC | regulation of reactive oxygen species metabolic process | 100/8552 | 157/18723 | 3.87e-06 | 4.17e-05 | 100 |
| GO:007259318 | Esophagus | ESCC | reactive oxygen species metabolic process | 137/8552 | 239/18723 | 1.82e-04 | 1.16e-03 | 137 |
| GO:00443463 | Esophagus | ESCC | fibroblast apoptotic process | 16/8552 | 22/18723 | 9.46e-03 | 3.28e-02 | 16 |
| GO:200037712 | Liver | Cirrhotic | regulation of reactive oxygen species metabolic process | 67/4634 | 157/18723 | 6.07e-07 | 1.32e-05 | 67 |
| GO:00725937 | Liver | Cirrhotic | reactive oxygen species metabolic process | 92/4634 | 239/18723 | 1.57e-06 | 3.03e-05 | 92 |
| GO:200037722 | Liver | HCC | regulation of reactive oxygen species metabolic process | 92/7958 | 157/18723 | 3.34e-05 | 3.35e-04 | 92 |
| GO:007259312 | Liver | HCC | reactive oxygen species metabolic process | 124/7958 | 239/18723 | 2.05e-03 | 1.04e-02 | 124 |
| GO:200037716 | Oral cavity | OSCC | regulation of reactive oxygen species metabolic process | 92/7305 | 157/18723 | 4.96e-07 | 7.27e-06 | 92 |
| GO:007259316 | Oral cavity | OSCC | reactive oxygen species metabolic process | 122/7305 | 239/18723 | 9.73e-05 | 7.34e-04 | 122 |
| GO:0044346 | Oral cavity | OSCC | fibroblast apoptotic process | 16/7305 | 22/18723 | 1.40e-03 | 6.79e-03 | 16 |
| GO:2000269 | Oral cavity | OSCC | regulation of fibroblast apoptotic process | 13/7305 | 19/18723 | 9.07e-03 | 3.26e-02 | 13 |
| GO:200037717 | Oral cavity | LP | regulation of reactive oxygen species metabolic process | 67/4623 | 157/18723 | 5.54e-07 | 1.51e-05 | 67 |
| GO:007259317 | Oral cavity | LP | reactive oxygen species metabolic process | 85/4623 | 239/18723 | 1.04e-04 | 1.26e-03 | 85 |
| GO:00443461 | Oral cavity | LP | fibroblast apoptotic process | 13/4623 | 22/18723 | 6.11e-04 | 5.58e-03 | 13 |
| GO:20002691 | Oral cavity | LP | regulation of fibroblast apoptotic process | 10/4623 | 19/18723 | 8.09e-03 | 4.40e-02 | 10 |
| GO:007259310 | Prostate | BPH | reactive oxygen species metabolic process | 61/3107 | 239/18723 | 2.71e-04 | 2.13e-03 | 61 |
| GO:200037710 | Prostate | BPH | regulation of reactive oxygen species metabolic process | 42/3107 | 157/18723 | 8.41e-04 | 5.46e-03 | 42 |
| GO:007259315 | Prostate | Tumor | reactive oxygen species metabolic process | 63/3246 | 239/18723 | 2.87e-04 | 2.32e-03 | 63 |
| GO:200037715 | Prostate | Tumor | regulation of reactive oxygen species metabolic process | 42/3246 | 157/18723 | 2.02e-03 | 1.16e-02 | 42 |
| GO:00443464 | Skin | AK | fibroblast apoptotic process | 8/1910 | 22/18723 | 9.95e-04 | 7.87e-03 | 8 |
| Page: 1 2 |
| Pathway ID | Tissue | Disease Stage | Description | Gene Ratio | Bg Ratio | pvalue | p.adjust | qvalue | Count |
| Page: 1 |
Top |
Cell-cell communication analysis |
| Identification of potential cell-cell interactions between two cell types and their ligand-receptor pairs for different disease states |
| Ligand | Receptor | LRpair | Pathway | Tissue | Disease Stage |
| Page: 1 |
Top |
Single-cell gene regulatory network inference analysis |
| Find out the significant the regulons (TFs) and the target genes of each regulon across cell types for different disease states |
| TF | Cell Type | Tissue | Disease Stage | Target Gene | RSS | Regulon Activity |
| ∗The dot plots of a searched regulon are shown for all cell subpopulations in each disease state of each tissue based on the regulon specific score inferred using pySCENIC and by calculating the average expression. |
| Page: 1 |
Top |
Somatic mutation of malignant transformation related genes |
| Annotation of somatic variants for genes involved in malignant transformation |
| Hugo Symbol | Variant Class | Variant Classification | dbSNP RS | HGVSc | HGVSp | HGVSp Short | SWISSPROT | BIOTYPE | SIFT | PolyPhen | Tumor Sample Barcode | Tissue | Histology | Sex | Age | Stage | Therapy Types | Drugs | Outcome |
| STK17A | SNV | Missense_Mutation | c.385N>C | p.Glu129Gln | p.E129Q | Q9UEE5 | protein_coding | deleterious(0.03) | probably_damaging(0.999) | TCGA-AC-A23H-01 | Breast | breast invasive carcinoma | Female | >=65 | I/II | Unknown | Unknown | PD | |
| STK17A | SNV | Missense_Mutation | c.940N>C | p.Glu314Gln | p.E314Q | Q9UEE5 | protein_coding | tolerated(0.39) | benign(0.101) | TCGA-AC-A23H-01 | Breast | breast invasive carcinoma | Female | >=65 | I/II | Unknown | Unknown | PD | |
| STK17A | SNV | Missense_Mutation | c.799G>C | p.Asp267His | p.D267H | Q9UEE5 | protein_coding | deleterious(0.01) | possibly_damaging(0.762) | TCGA-AN-A0XW-01 | Breast | breast invasive carcinoma | Female | <65 | III/IV | Unknown | Unknown | SD | |
| STK17A | SNV | Missense_Mutation | c.612G>C | p.Lys204Asn | p.K204N | Q9UEE5 | protein_coding | deleterious(0) | probably_damaging(0.997) | TCGA-D8-A1JL-01 | Breast | breast invasive carcinoma | Female | >=65 | I/II | Unknown | Unknown | SD | |
| STK17A | SNV | Missense_Mutation | c.886G>A | p.Asp296Asn | p.D296N | Q9UEE5 | protein_coding | deleterious(0.01) | benign(0.096) | TCGA-LP-A4AV-01 | Cervix | cervical & endocervical cancer | Female | <65 | I/II | Unknown | Unknown | SD | |
| STK17A | SNV | Missense_Mutation | novel | c.1199N>A | p.Phe400Tyr | p.F400Y | Q9UEE5 | protein_coding | deleterious(0.01) | probably_damaging(0.989) | TCGA-Q1-A6DT-01 | Cervix | cervical & endocervical cancer | Female | <65 | I/II | Unknown | Unknown | PD |
| STK17A | SNV | Missense_Mutation | novel | c.1174N>C | p.Lys392Gln | p.K392Q | Q9UEE5 | protein_coding | deleterious(0.02) | probably_damaging(0.998) | TCGA-AZ-4315-01 | Colorectum | colon adenocarcinoma | Male | <65 | I/II | Unknown | Unknown | SD |
| STK17A | SNV | Missense_Mutation | c.1061C>T | p.Ser354Leu | p.S354L | Q9UEE5 | protein_coding | tolerated(0.16) | benign(0.013) | TCGA-CA-6717-01 | Colorectum | colon adenocarcinoma | Male | <65 | I/II | Chemotherapy | oxaliplatin | CR | |
| STK17A | SNV | Missense_Mutation | c.866N>C | p.Val289Ala | p.V289A | Q9UEE5 | protein_coding | tolerated(0.76) | benign(0.001) | TCGA-CM-6165-01 | Colorectum | colon adenocarcinoma | Male | >=65 | I/II | Unknown | Unknown | SD | |
| STK17A | SNV | Missense_Mutation | novel | c.281N>G | p.Lys94Arg | p.K94R | Q9UEE5 | protein_coding | tolerated(0.12) | probably_damaging(1) | TCGA-G4-6626-01 | Colorectum | colon adenocarcinoma | Male | >=65 | I/II | Unknown | Unknown | SD |
| Page: 1 2 3 4 |
Top |
Related drugs of malignant transformation related genes |
| Identification of chemicals and drugs interact with genes involved in malignant transfromation |
| (DGIdb 4.0) |
| Entrez ID | Symbol | Category | Interaction Types | Drug Claim Name | Drug Name | PMIDs |
| 9263 | STK17A | SERINE THREONINE KINASE, KINASE, DRUGGABLE GENOME, ENZYME | AZD-1080 | AZD-1080 | ||
| 9263 | STK17A | SERINE THREONINE KINASE, KINASE, DRUGGABLE GENOME, ENZYME | KD-025 | CHEMBL2005186 | ||
| 9263 | STK17A | SERINE THREONINE KINASE, KINASE, DRUGGABLE GENOME, ENZYME | ILORASERTIB | ILORASERTIB | ||
| 9263 | STK17A | SERINE THREONINE KINASE, KINASE, DRUGGABLE GENOME, ENZYME | TAE-684 | TAE-684 | ||
| 9263 | STK17A | SERINE THREONINE KINASE, KINASE, DRUGGABLE GENOME, ENZYME | GW441756X | GW441756X | ||
| 9263 | STK17A | SERINE THREONINE KINASE, KINASE, DRUGGABLE GENOME, ENZYME | RG-1530 | RG-1530 | ||
| 9263 | STK17A | SERINE THREONINE KINASE, KINASE, DRUGGABLE GENOME, ENZYME | PHA-767491 | CHEMBL225519 | ||
| 9263 | STK17A | SERINE THREONINE KINASE, KINASE, DRUGGABLE GENOME, ENZYME | GSK-269962A | GSK-269962A | ||
| 9263 | STK17A | SERINE THREONINE KINASE, KINASE, DRUGGABLE GENOME, ENZYME | inhibitor | 381118877 | TOMIVOSERTIB | |
| 9263 | STK17A | SERINE THREONINE KINASE, KINASE, DRUGGABLE GENOME, ENZYME | inhibitor | HESPERADIN | HESPERADIN | 19035792 |
| Page: 1 2 |

Copyright 2023-Present -The University of Texas Health Science Center at Houston |