
|
|||||
|
 | |
| |
| |
| |
| |
| |
|
Gene: STK11IP |
Gene summary for STK11IP |
| Gene information | Species | Human | Gene symbol | STK11IP | Gene ID | 114790 |
| Gene name | serine/threonine kinase 11 interacting protein | |
| Gene Alias | LIP1 | |
| Cytomap | 2q35 | |
| Gene Type | protein-coding | GO ID | GO:0008104 | UniProtAcc | C9JQV3 |
Top |
Malignant transformation analysis |
| Identification of the aberrant gene expression in precancerous and cancerous lesions by comparing the gene expression of stem-like cells in diseased tissues with normal stem cells |
| Entrez ID | Symbol | Replicates | Species | Organ | Tissue | Adj P-value | Log2FC | Malignancy |
| 114790 | STK11IP | LZE24T | Human | Esophagus | ESCC | 8.56e-05 | 1.40e-01 | 0.0596 |
| 114790 | STK11IP | P2T-E | Human | Esophagus | ESCC | 1.56e-11 | 1.22e-01 | 0.1177 |
| 114790 | STK11IP | P8T-E | Human | Esophagus | ESCC | 2.61e-07 | 9.85e-02 | 0.0889 |
| 114790 | STK11IP | P10T-E | Human | Esophagus | ESCC | 6.74e-03 | 1.13e-01 | 0.116 |
| 114790 | STK11IP | P11T-E | Human | Esophagus | ESCC | 1.23e-02 | 2.06e-01 | 0.1426 |
| 114790 | STK11IP | P15T-E | Human | Esophagus | ESCC | 1.27e-09 | 1.18e-01 | 0.1149 |
| 114790 | STK11IP | P16T-E | Human | Esophagus | ESCC | 2.44e-07 | 1.59e-01 | 0.1153 |
| 114790 | STK11IP | P20T-E | Human | Esophagus | ESCC | 1.15e-03 | 9.78e-02 | 0.1124 |
| 114790 | STK11IP | P21T-E | Human | Esophagus | ESCC | 2.10e-05 | 1.37e-01 | 0.1617 |
| 114790 | STK11IP | P22T-E | Human | Esophagus | ESCC | 1.67e-02 | 5.09e-02 | 0.1236 |
| 114790 | STK11IP | P24T-E | Human | Esophagus | ESCC | 4.48e-03 | 6.87e-02 | 0.1287 |
| 114790 | STK11IP | P26T-E | Human | Esophagus | ESCC | 1.24e-03 | 8.75e-02 | 0.1276 |
| 114790 | STK11IP | P27T-E | Human | Esophagus | ESCC | 1.52e-06 | 1.30e-01 | 0.1055 |
| 114790 | STK11IP | P28T-E | Human | Esophagus | ESCC | 4.29e-03 | 1.15e-01 | 0.1149 |
| 114790 | STK11IP | P30T-E | Human | Esophagus | ESCC | 1.13e-02 | 1.72e-01 | 0.137 |
| 114790 | STK11IP | P32T-E | Human | Esophagus | ESCC | 3.19e-05 | 8.26e-02 | 0.1666 |
| 114790 | STK11IP | P37T-E | Human | Esophagus | ESCC | 1.36e-05 | 1.02e-01 | 0.1371 |
| 114790 | STK11IP | P40T-E | Human | Esophagus | ESCC | 2.09e-04 | 1.25e-01 | 0.109 |
| 114790 | STK11IP | P47T-E | Human | Esophagus | ESCC | 1.22e-02 | 5.03e-02 | 0.1067 |
| 114790 | STK11IP | P48T-E | Human | Esophagus | ESCC | 4.24e-03 | 6.53e-02 | 0.0959 |
| Page: 1 2 |
| Tissue | Expression Dynamics | Abbreviation |
| Esophagus | 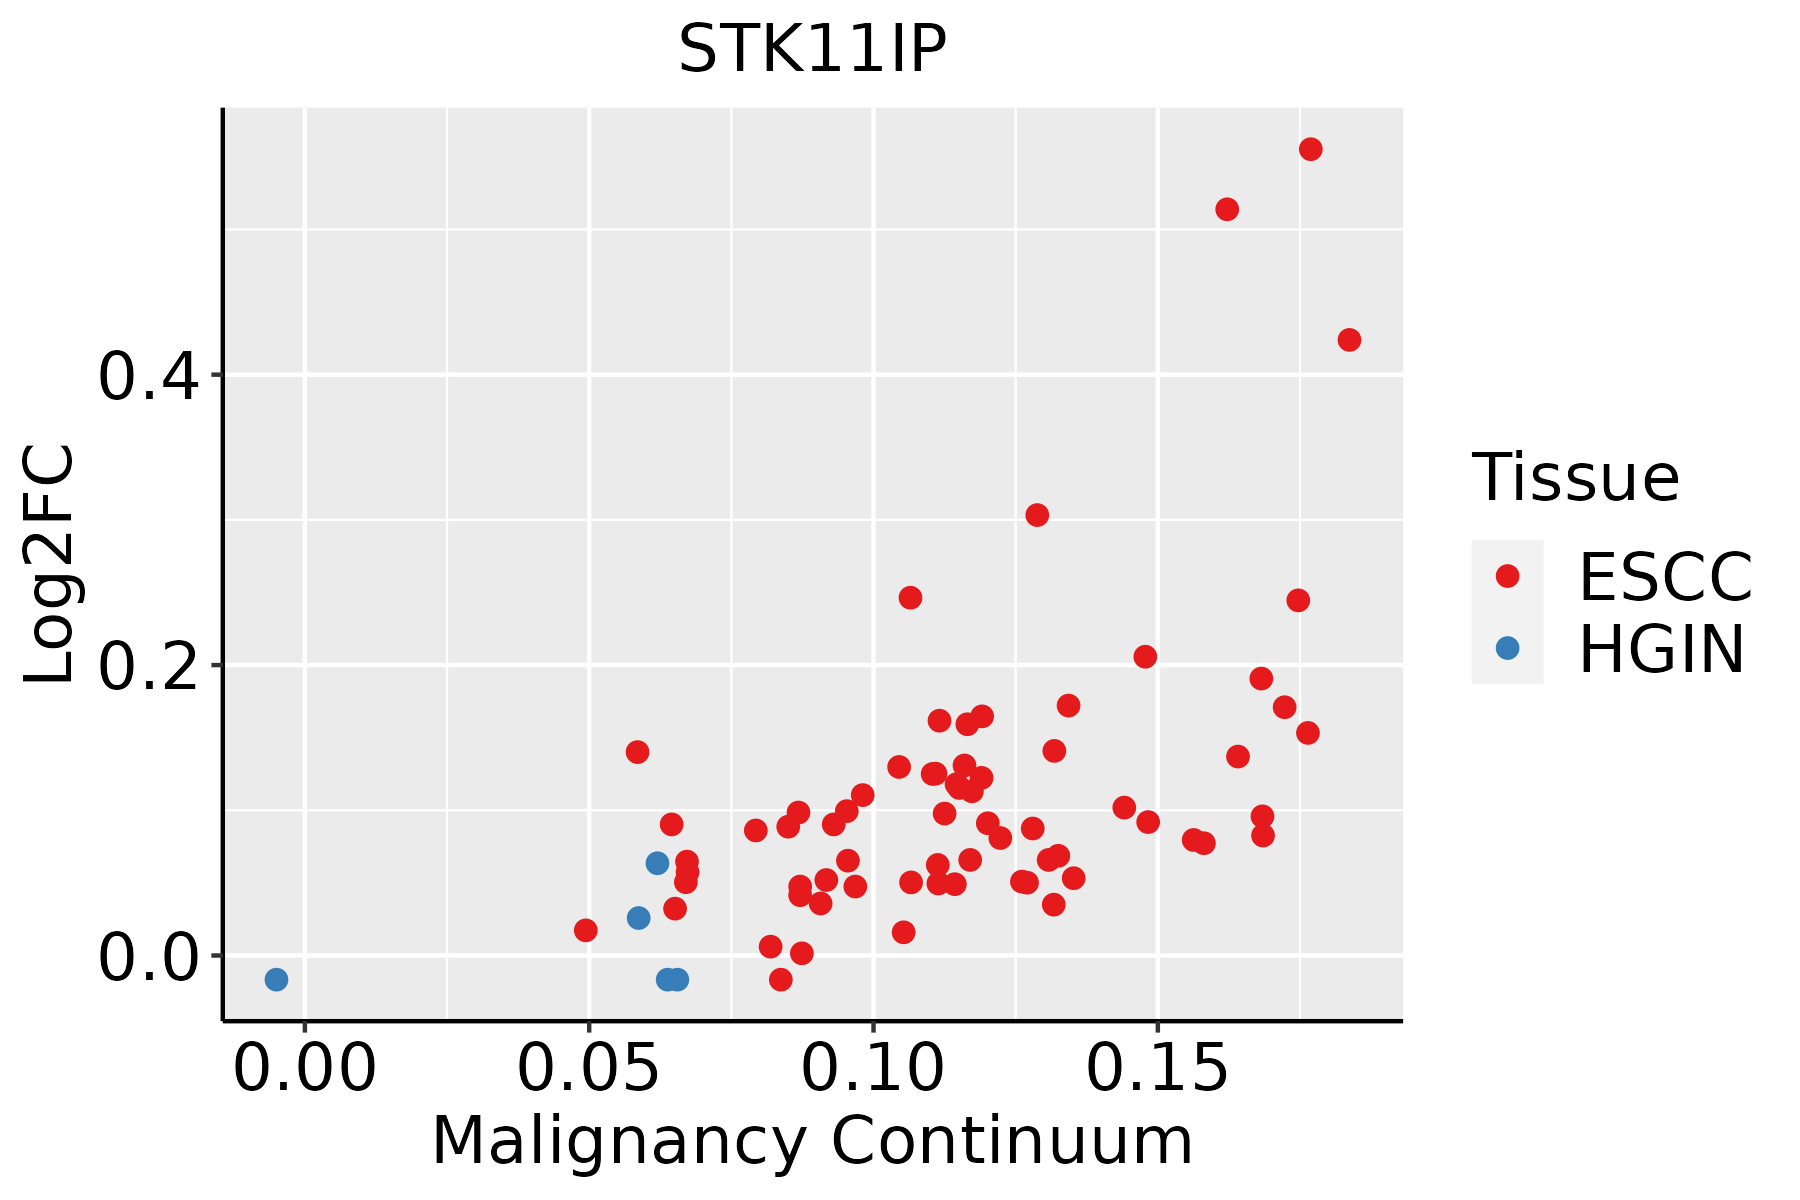 | ESCC: Esophageal squamous cell carcinoma |
| HGIN: High-grade intraepithelial neoplasias | ||
| LGIN: Low-grade intraepithelial neoplasias |
| ∗log2FC in expression of this searched gene in stem-like cells from each diseased tissue sample relative to stem-like cells in normal samples in each tissue plotted against the malignancy continuum. Samples are colored based on if they are from different disease stage. |
Top |
Malignant transformation related pathway analysis |
| Find out the enriched GO biological processes and KEGG pathways involved in transition from healthy to precancer to cancer |
| Tissue | Disease Stage | Enriched GO biological Processes |
| Colorectum | AD |  |
| Colorectum | SER |  |
| Colorectum | MSS |  |
| Colorectum | MSI-H |  |
| Colorectum | FAP |  |
| ∗Top 15 enriched GO BP terms are showed in the bar plot of each disease state in each tissue. Each row represents a significant GO biological process which is colored according to the -log10(p.adjust). |
| Page: 1 2 3 4 5 6 7 8 9 |
| GO ID | Tissue | Disease Stage | Description | Gene Ratio | Bg Ratio | pvalue | p.adjust | Count |
| Page: 1 |
| Pathway ID | Tissue | Disease Stage | Description | Gene Ratio | Bg Ratio | pvalue | p.adjust | qvalue | Count |
| Page: 1 |
Top |
Cell-cell communication analysis |
| Identification of potential cell-cell interactions between two cell types and their ligand-receptor pairs for different disease states |
| Ligand | Receptor | LRpair | Pathway | Tissue | Disease Stage |
| Page: 1 |
Top |
Single-cell gene regulatory network inference analysis |
| Find out the significant the regulons (TFs) and the target genes of each regulon across cell types for different disease states |
| TF | Cell Type | Tissue | Disease Stage | Target Gene | RSS | Regulon Activity |
| ∗The dot plots of a searched regulon are shown for all cell subpopulations in each disease state of each tissue based on the regulon specific score inferred using pySCENIC and by calculating the average expression. |
| Page: 1 |
Top |
Somatic mutation of malignant transformation related genes |
| Annotation of somatic variants for genes involved in malignant transformation |
| Hugo Symbol | Variant Class | Variant Classification | dbSNP RS | HGVSc | HGVSp | HGVSp Short | SWISSPROT | BIOTYPE | SIFT | PolyPhen | Tumor Sample Barcode | Tissue | Histology | Sex | Age | Stage | Therapy Types | Drugs | Outcome |
| STK11IP | SNV | Missense_Mutation | rs372789253 | c.1181N>T | p.Thr394Met | p.T394M | protein_coding | deleterious(0) | probably_damaging(0.982) | TCGA-A8-A096-01 | Breast | breast invasive carcinoma | Female | >=65 | I/II | Unknown | Unknown | SD | |
| STK11IP | SNV | Missense_Mutation | c.1724N>T | p.Arg575Leu | p.R575L | protein_coding | deleterious(0) | possibly_damaging(0.773) | TCGA-AR-A0TW-01 | Breast | breast invasive carcinoma | Female | <65 | III/IV | Chemotherapy | doxorubicin | PD | ||
| STK11IP | SNV | Missense_Mutation | rs760507951 | c.1475C>T | p.Ala492Val | p.A492V | protein_coding | tolerated(0.32) | benign(0) | TCGA-BH-A18G-01 | Breast | breast invasive carcinoma | Female | >=65 | I/II | Unknown | Unknown | SD | |
| STK11IP | SNV | Missense_Mutation | novel | c.367N>G | p.Leu123Val | p.L123V | protein_coding | deleterious(0) | probably_damaging(0.997) | TCGA-C8-A8HQ-01 | Breast | breast invasive carcinoma | Female | <65 | I/II | Unknown | Unknown | SD | |
| STK11IP | SNV | Missense_Mutation | c.2396N>T | p.Glu799Val | p.E799V | protein_coding | deleterious(0) | possibly_damaging(0.893) | TCGA-D8-A1X7-01 | Breast | breast invasive carcinoma | Female | <65 | I/II | ChemotherapyHormone Therapy | doxorubicine+cyclophosphamide+tamoxifen | SD | ||
| STK11IP | deletion | Frame_Shift_Del | novel | c.874delT | p.Trp292GlyfsTer34 | p.W292Gfs*34 | protein_coding | TCGA-D8-A27V-01 | Breast | breast invasive carcinoma | Female | <65 | I/II | Hormone Therapy | tamoxiphen | SD | |||
| STK11IP | deletion | Frame_Shift_Del | novel | c.973delC | p.Leu325Ter | p.L325* | protein_coding | TCGA-D8-A27V-01 | Breast | breast invasive carcinoma | Female | <65 | I/II | Hormone Therapy | tamoxiphen | SD | |||
| STK11IP | SNV | Missense_Mutation | novel | c.1412C>A | p.Pro471His | p.P471H | protein_coding | tolerated(0.1) | possibly_damaging(0.562) | TCGA-2W-A8YY-01 | Cervix | cervical & endocervical cancer | Female | <65 | I/II | Chemotherapy | cisplatin | CR | |
| STK11IP | SNV | Missense_Mutation | novel | c.1756N>A | p.Glu586Lys | p.E586K | protein_coding | tolerated(0.56) | benign(0.085) | TCGA-C5-A2LZ-01 | Cervix | cervical & endocervical cancer | Female | >=65 | III/IV | Unknown | Unknown | PD | |
| STK11IP | SNV | Missense_Mutation | novel | c.2980N>A | p.Glu994Lys | p.E994K | protein_coding | tolerated(0.06) | probably_damaging(0.991) | TCGA-EA-A3HU-01 | Cervix | cervical & endocervical cancer | Female | <65 | I/II | Unknown | Unknown | SD |
| Page: 1 2 3 4 5 6 7 8 |
Top |
Related drugs of malignant transformation related genes |
| Identification of chemicals and drugs interact with genes involved in malignant transfromation |
| (DGIdb 4.0) |
| Entrez ID | Symbol | Category | Interaction Types | Drug Claim Name | Drug Name | PMIDs |
| Page: 1 |

Copyright 2023-Present -The University of Texas Health Science Center at Houston |