
|
|||||
|
 | |
| |
| |
| |
| |
| |
|
Gene: STK11 |
Gene summary for STK11 |
| Gene information | Species | Human | Gene symbol | STK11 | Gene ID | 6794 |
| Gene name | serine/threonine kinase 11 | |
| Gene Alias | LKB1 | |
| Cytomap | 19p13.3 | |
| Gene Type | protein-coding | GO ID | GO:0000003 | UniProtAcc | A0A0S2Z4D1 |
Top |
Malignant transformation analysis |
| Identification of the aberrant gene expression in precancerous and cancerous lesions by comparing the gene expression of stem-like cells in diseased tissues with normal stem cells |
| Entrez ID | Symbol | Replicates | Species | Organ | Tissue | Adj P-value | Log2FC | Malignancy |
| 6794 | STK11 | HCC1_Meng | Human | Liver | HCC | 3.09e-09 | -3.18e-02 | 0.0246 |
| 6794 | STK11 | HCC2_Meng | Human | Liver | HCC | 1.02e-30 | 1.64e-01 | 0.0107 |
| 6794 | STK11 | HCC2 | Human | Liver | HCC | 5.96e-05 | 2.06e+00 | 0.5341 |
| 6794 | STK11 | S014 | Human | Liver | HCC | 3.61e-02 | 2.38e-01 | 0.2254 |
| 6794 | STK11 | S027 | Human | Liver | HCC | 4.42e-04 | 5.55e-01 | 0.2446 |
| 6794 | STK11 | S028 | Human | Liver | HCC | 1.01e-07 | 4.25e-01 | 0.2503 |
| 6794 | STK11 | S029 | Human | Liver | HCC | 3.60e-09 | 4.57e-01 | 0.2581 |
| 6794 | STK11 | C04 | Human | Oral cavity | OSCC | 3.66e-08 | 6.95e-01 | 0.2633 |
| 6794 | STK11 | C30 | Human | Oral cavity | OSCC | 1.52e-08 | 5.78e-01 | 0.3055 |
| 6794 | STK11 | C38 | Human | Oral cavity | OSCC | 6.07e-03 | 7.04e-01 | 0.172 |
| 6794 | STK11 | C51 | Human | Oral cavity | OSCC | 8.45e-07 | 5.78e-01 | 0.2674 |
| 6794 | STK11 | SYSMH1 | Human | Oral cavity | OSCC | 1.81e-05 | 1.90e-01 | 0.1127 |
| 6794 | STK11 | SYSMH2 | Human | Oral cavity | OSCC | 1.98e-08 | 3.77e-01 | 0.2326 |
| 6794 | STK11 | SYSMH3 | Human | Oral cavity | OSCC | 3.75e-24 | 7.00e-01 | 0.2442 |
| 6794 | STK11 | SYSMH5 | Human | Oral cavity | OSCC | 4.19e-02 | 1.44e-01 | 0.0647 |
| 6794 | STK11 | male-WTA | Human | Thyroid | PTC | 2.05e-14 | 2.07e-01 | 0.1037 |
| 6794 | STK11 | female-WTA | Human | Thyroid | PTC | 2.08e-02 | 2.12e-01 | 0.0726 |
| 6794 | STK11 | PTC01 | Human | Thyroid | PTC | 6.53e-04 | 1.05e-01 | 0.1899 |
| 6794 | STK11 | PTC04 | Human | Thyroid | PTC | 5.50e-16 | 3.27e-01 | 0.1927 |
| 6794 | STK11 | PTC05 | Human | Thyroid | PTC | 6.73e-21 | 6.00e-01 | 0.2065 |
| Page: 1 2 |
| Tissue | Expression Dynamics | Abbreviation |
| Liver | 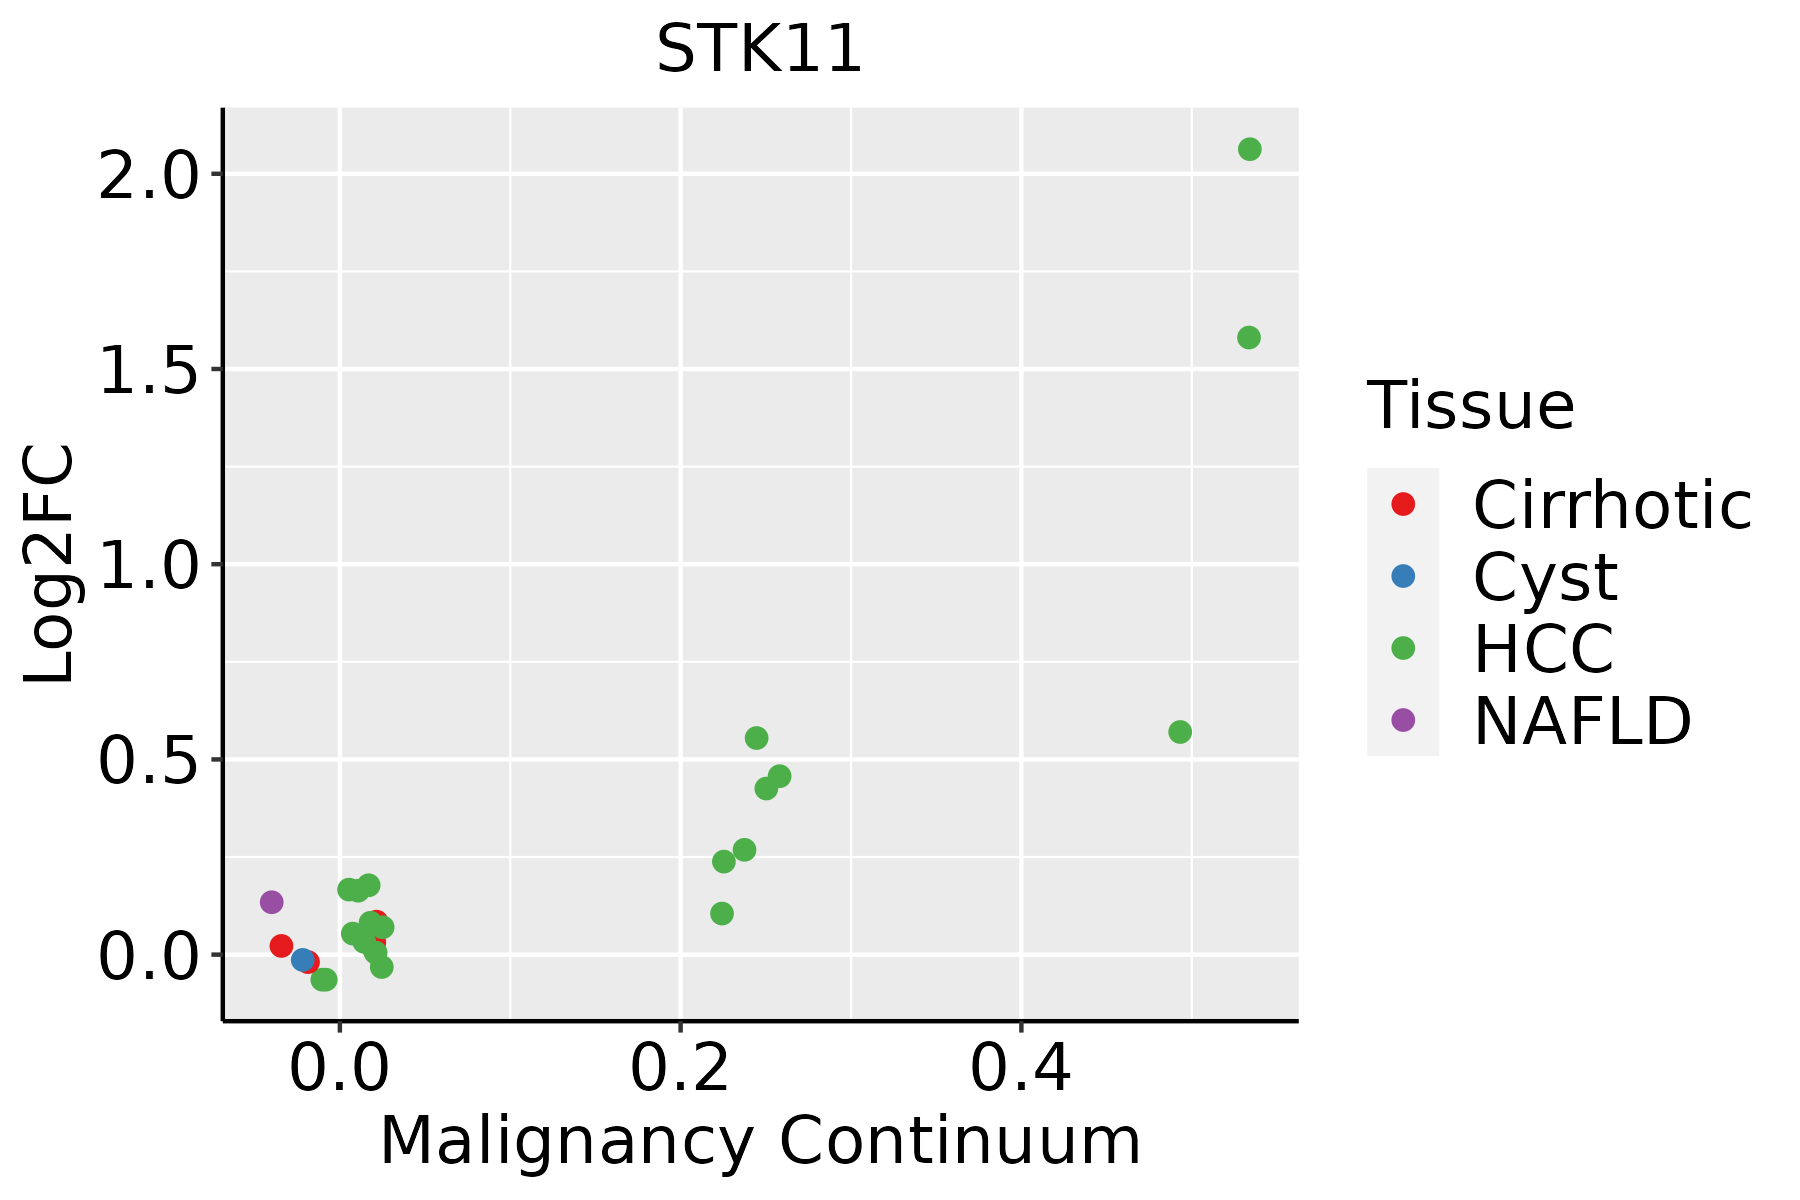 | HCC: Hepatocellular carcinoma |
| NAFLD: Non-alcoholic fatty liver disease | ||
| Oral Cavity | 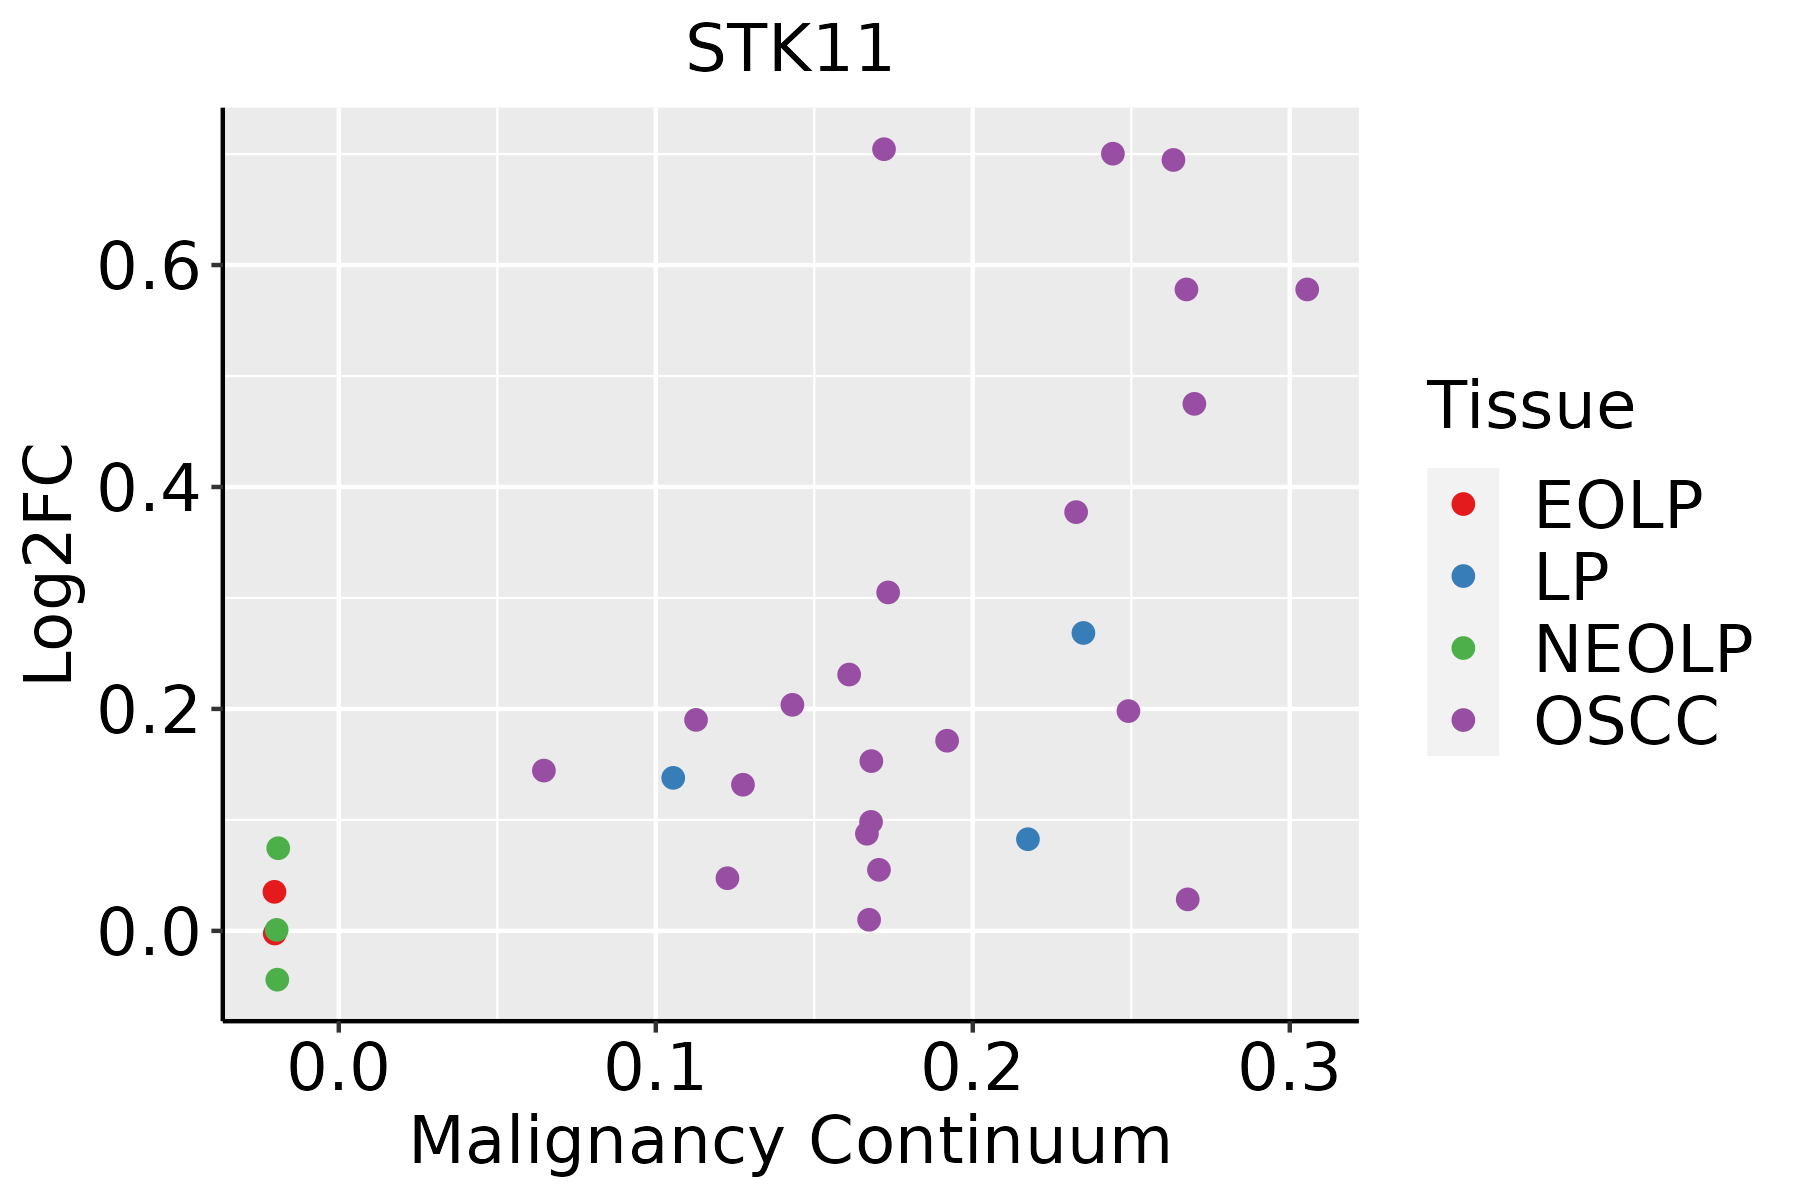 | EOLP: Erosive Oral lichen planus |
| LP: leukoplakia | ||
| NEOLP: Non-erosive oral lichen planus | ||
| OSCC: Oral squamous cell carcinoma | ||
| Thyroid | 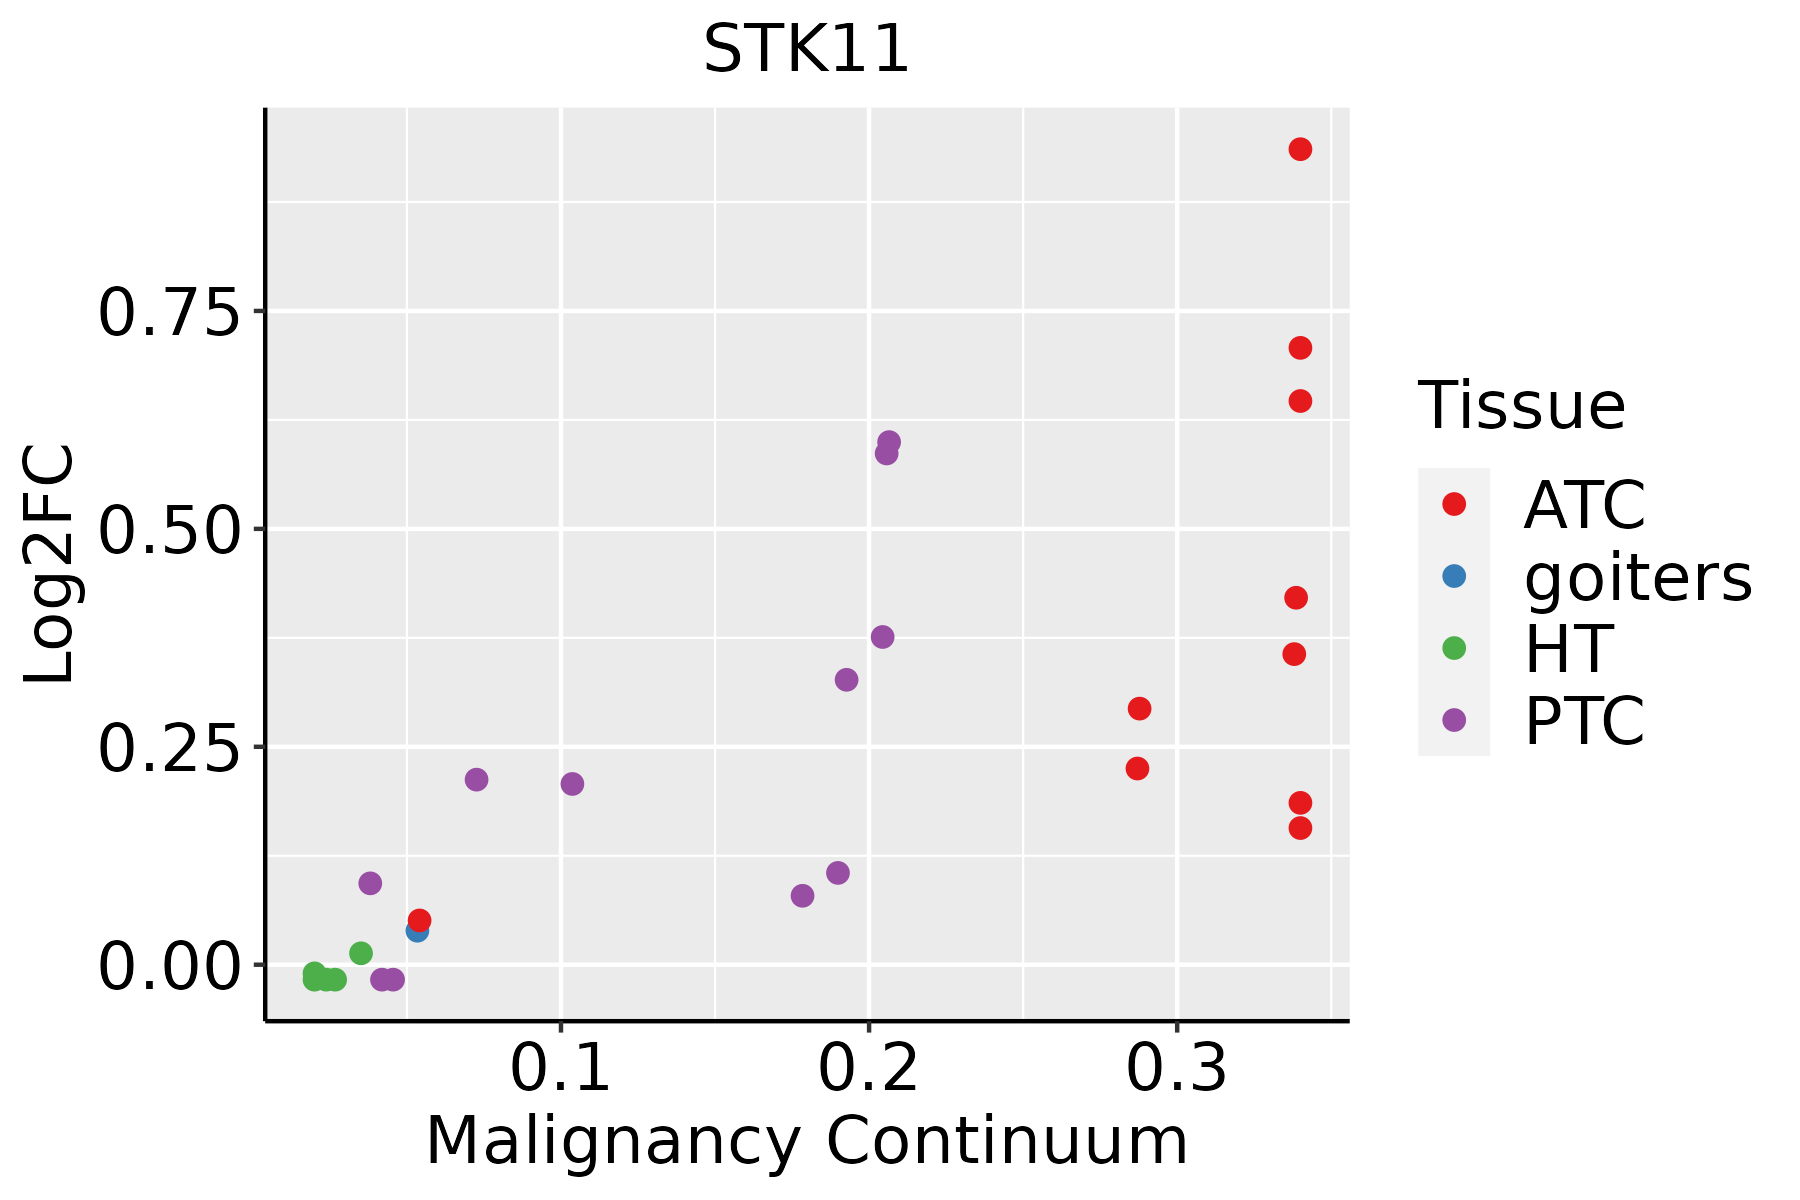 | ATC: Anaplastic thyroid cancer |
| HT: Hashimoto's thyroiditis | ||
| PTC: Papillary thyroid cancer |
| ∗log2FC in expression of this searched gene in stem-like cells from each diseased tissue sample relative to stem-like cells in normal samples in each tissue plotted against the malignancy continuum. Samples are colored based on if they are from different disease stage. |
Top |
Malignant transformation related pathway analysis |
| Find out the enriched GO biological processes and KEGG pathways involved in transition from healthy to precancer to cancer |
| Tissue | Disease Stage | Enriched GO biological Processes |
| Colorectum | AD |  |
| Colorectum | SER |  |
| Colorectum | MSS |  |
| Colorectum | MSI-H |  |
| Colorectum | FAP |  |
| ∗Top 15 enriched GO BP terms are showed in the bar plot of each disease state in each tissue. Each row represents a significant GO biological process which is colored according to the -log10(p.adjust). |
| Page: 1 2 3 4 5 6 7 8 9 |
| GO ID | Tissue | Disease Stage | Description | Gene Ratio | Bg Ratio | pvalue | p.adjust | Count |
| GO:000989622 | Liver | HCC | positive regulation of catabolic process | 335/7958 | 492/18723 | 3.83e-31 | 1.87e-28 | 335 |
| GO:003133122 | Liver | HCC | positive regulation of cellular catabolic process | 295/7958 | 427/18723 | 3.20e-29 | 1.45e-26 | 295 |
| GO:190382922 | Liver | HCC | positive regulation of cellular protein localization | 199/7958 | 276/18723 | 1.15e-23 | 2.62e-21 | 199 |
| GO:003238621 | Liver | HCC | regulation of intracellular transport | 231/7958 | 337/18723 | 1.99e-22 | 3.40e-20 | 231 |
| GO:003238821 | Liver | HCC | positive regulation of intracellular transport | 148/7958 | 202/18723 | 5.15e-19 | 6.66e-17 | 148 |
| GO:001050621 | Liver | HCC | regulation of autophagy | 210/7958 | 317/18723 | 7.59e-18 | 8.45e-16 | 210 |
| GO:003450421 | Liver | HCC | protein localization to nucleus | 194/7958 | 290/18723 | 2.84e-17 | 2.85e-15 | 194 |
| GO:009719322 | Liver | HCC | intrinsic apoptotic signaling pathway | 184/7958 | 288/18723 | 1.50e-13 | 8.32e-12 | 184 |
| GO:190018212 | Liver | HCC | positive regulation of protein localization to nucleus | 67/7958 | 87/18723 | 5.43e-11 | 2.00e-09 | 67 |
| GO:190018012 | Liver | HCC | regulation of protein localization to nucleus | 95/7958 | 136/18723 | 9.26e-11 | 3.26e-09 | 95 |
| GO:005165621 | Liver | HCC | establishment of organelle localization | 226/7958 | 390/18723 | 4.15e-10 | 1.34e-08 | 226 |
| GO:007233122 | Liver | HCC | signal transduction by p53 class mediator | 108/7958 | 163/18723 | 7.14e-10 | 2.23e-08 | 108 |
| GO:001604921 | Liver | HCC | cell growth | 269/7958 | 482/18723 | 1.84e-09 | 5.35e-08 | 269 |
| GO:019873821 | Liver | HCC | cell-cell signaling by wnt | 247/7958 | 446/18723 | 2.11e-08 | 4.96e-07 | 247 |
| GO:004873222 | Liver | HCC | gland development | 242/7958 | 436/18723 | 2.26e-08 | 5.28e-07 | 242 |
| GO:000716322 | Liver | HCC | establishment or maintenance of cell polarity | 133/7958 | 218/18723 | 2.48e-08 | 5.73e-07 | 133 |
| GO:005165021 | Liver | HCC | establishment of vesicle localization | 103/7958 | 161/18723 | 2.94e-08 | 6.69e-07 | 103 |
| GO:001605521 | Liver | HCC | Wnt signaling pathway | 245/7958 | 444/18723 | 3.68e-08 | 8.09e-07 | 245 |
| GO:001631121 | Liver | HCC | dephosphorylation | 230/7958 | 417/18723 | 1.00e-07 | 1.96e-06 | 230 |
| GO:000155821 | Liver | HCC | regulation of cell growth | 228/7958 | 414/18723 | 1.34e-07 | 2.55e-06 | 228 |
| Page: 1 2 3 4 5 6 7 8 9 10 11 12 13 14 15 16 17 18 |
| Pathway ID | Tissue | Disease Stage | Description | Gene Ratio | Bg Ratio | pvalue | p.adjust | qvalue | Count |
| hsa0414021 | Liver | HCC | Autophagy - animal | 99/4020 | 141/8465 | 3.08e-08 | 4.70e-07 | 2.61e-07 | 99 |
| hsa0453042 | Liver | HCC | Tight junction | 110/4020 | 169/8465 | 2.45e-06 | 2.28e-05 | 1.27e-05 | 110 |
| hsa040684 | Liver | HCC | FoxO signaling pathway | 85/4020 | 131/8465 | 3.99e-05 | 2.16e-04 | 1.20e-04 | 85 |
| hsa0421121 | Liver | HCC | Longevity regulating pathway | 61/4020 | 89/8465 | 4.46e-05 | 2.37e-04 | 1.32e-04 | 61 |
| hsa0415241 | Liver | HCC | AMPK signaling pathway | 77/4020 | 121/8465 | 2.32e-04 | 1.11e-03 | 6.18e-04 | 77 |
| hsa041502 | Liver | HCC | mTOR signaling pathway | 95/4020 | 156/8465 | 4.70e-04 | 1.99e-03 | 1.11e-03 | 95 |
| hsa049202 | Liver | HCC | Adipocytokine signaling pathway | 45/4020 | 69/8465 | 2.19e-03 | 7.55e-03 | 4.20e-03 | 45 |
| hsa0414031 | Liver | HCC | Autophagy - animal | 99/4020 | 141/8465 | 3.08e-08 | 4.70e-07 | 2.61e-07 | 99 |
| hsa0453052 | Liver | HCC | Tight junction | 110/4020 | 169/8465 | 2.45e-06 | 2.28e-05 | 1.27e-05 | 110 |
| hsa040685 | Liver | HCC | FoxO signaling pathway | 85/4020 | 131/8465 | 3.99e-05 | 2.16e-04 | 1.20e-04 | 85 |
| hsa0421131 | Liver | HCC | Longevity regulating pathway | 61/4020 | 89/8465 | 4.46e-05 | 2.37e-04 | 1.32e-04 | 61 |
| hsa0415251 | Liver | HCC | AMPK signaling pathway | 77/4020 | 121/8465 | 2.32e-04 | 1.11e-03 | 6.18e-04 | 77 |
| hsa0415011 | Liver | HCC | mTOR signaling pathway | 95/4020 | 156/8465 | 4.70e-04 | 1.99e-03 | 1.11e-03 | 95 |
| hsa049203 | Liver | HCC | Adipocytokine signaling pathway | 45/4020 | 69/8465 | 2.19e-03 | 7.55e-03 | 4.20e-03 | 45 |
| hsa041409 | Oral cavity | OSCC | Autophagy - animal | 94/3704 | 141/8465 | 2.73e-08 | 2.38e-07 | 1.21e-07 | 94 |
| hsa040688 | Oral cavity | OSCC | FoxO signaling pathway | 85/3704 | 131/8465 | 7.50e-07 | 4.33e-06 | 2.21e-06 | 85 |
| hsa0453030 | Oral cavity | OSCC | Tight junction | 102/3704 | 169/8465 | 8.68e-06 | 3.93e-05 | 2.00e-05 | 102 |
| hsa041504 | Oral cavity | OSCC | mTOR signaling pathway | 90/3704 | 156/8465 | 2.87e-04 | 9.15e-04 | 4.66e-04 | 90 |
| hsa041516 | Oral cavity | OSCC | PI3K-Akt signaling pathway | 185/3704 | 354/8465 | 6.26e-04 | 1.86e-03 | 9.49e-04 | 185 |
| hsa041529 | Oral cavity | OSCC | AMPK signaling pathway | 71/3704 | 121/8465 | 6.29e-04 | 1.86e-03 | 9.49e-04 | 71 |
| Page: 1 2 |
Top |
Cell-cell communication analysis |
| Identification of potential cell-cell interactions between two cell types and their ligand-receptor pairs for different disease states |
| Ligand | Receptor | LRpair | Pathway | Tissue | Disease Stage |
| Page: 1 |
Top |
Single-cell gene regulatory network inference analysis |
| Find out the significant the regulons (TFs) and the target genes of each regulon across cell types for different disease states |
| TF | Cell Type | Tissue | Disease Stage | Target Gene | RSS | Regulon Activity |
| ∗The dot plots of a searched regulon are shown for all cell subpopulations in each disease state of each tissue based on the regulon specific score inferred using pySCENIC and by calculating the average expression. |
| Page: 1 |
Top |
Somatic mutation of malignant transformation related genes |
| Annotation of somatic variants for genes involved in malignant transformation |
| Hugo Symbol | Variant Class | Variant Classification | dbSNP RS | HGVSc | HGVSp | HGVSp Short | SWISSPROT | BIOTYPE | SIFT | PolyPhen | Tumor Sample Barcode | Tissue | Histology | Sex | Age | Stage | Therapy Types | Drugs | Outcome |
| STK11 | SNV | Missense_Mutation | c.234G>C | p.Lys78Asn | p.K78N | Q15831 | protein_coding | deleterious(0) | probably_damaging(1) | TCGA-C8-A12K-01 | Breast | breast invasive carcinoma | Female | >=65 | I/II | Unknown | Unknown | SD | |
| STK11 | SNV | Missense_Mutation | c.336G>T | p.Gln112His | p.Q112H | Q15831 | protein_coding | tolerated(0.11) | benign(0.066) | TCGA-D8-A1Y3-01 | Breast | breast invasive carcinoma | Female | <65 | III/IV | Chemotherapy | doxorubicine+cyclophosphamide | SD | |
| STK11 | insertion | Nonsense_Mutation | c.178_179insA | p.Tyr60Ter | p.Y60* | Q15831 | protein_coding | TCGA-BH-A1EN-01 | Breast | breast invasive carcinoma | Female | >=65 | I/II | Unknown | Unknown | SD | |||
| STK11 | SNV | Missense_Mutation | rs730881979 | c.526G>A | p.Asp176Asn | p.D176N | Q15831 | protein_coding | deleterious(0) | probably_damaging(1) | TCGA-C5-A3HE-01 | Cervix | cervical & endocervical cancer | Female | <65 | I/II | Unknown | Unknown | PD |
| STK11 | SNV | Missense_Mutation | c.332T>A | p.Ile111Asn | p.I111N | Q15831 | protein_coding | deleterious(0) | probably_damaging(1) | TCGA-C5-A7CL-01 | Cervix | cervical & endocervical cancer | Female | <65 | III/IV | Chemotherapy | cisplatin | PD | |
| STK11 | SNV | Missense_Mutation | c.881C>T | p.Pro294Leu | p.P294L | Q15831 | protein_coding | deleterious(0.02) | probably_damaging(0.959) | TCGA-C5-A7CL-01 | Cervix | cervical & endocervical cancer | Female | <65 | III/IV | Chemotherapy | cisplatin | PD | |
| STK11 | SNV | Missense_Mutation | c.949G>A | p.Glu317Lys | p.E317K | Q15831 | protein_coding | tolerated(0.51) | benign(0.071) | TCGA-C5-A7X3-01 | Cervix | cervical & endocervical cancer | Female | >=65 | III/IV | Chemotherapy | cisplatin | SD | |
| STK11 | SNV | Missense_Mutation | c.949N>A | p.Glu317Lys | p.E317K | Q15831 | protein_coding | tolerated(0.51) | benign(0.071) | TCGA-C5-A8XK-01 | Cervix | cervical & endocervical cancer | Female | <65 | I/II | Chemotherapy | cisplatin | SD | |
| STK11 | SNV | Missense_Mutation | novel | c.1123N>C | p.Glu375Gln | p.E375Q | Q15831 | protein_coding | tolerated(0.18) | benign(0.099) | TCGA-C5-A8XK-01 | Cervix | cervical & endocervical cancer | Female | <65 | I/II | Chemotherapy | cisplatin | SD |
| STK11 | SNV | Missense_Mutation | c.536N>A | p.Pro179Gln | p.P179Q | Q15831 | protein_coding | deleterious(0) | probably_damaging(1) | TCGA-EK-A2R8-01 | Cervix | cervical & endocervical cancer | Female | <65 | I/II | Unknown | Unknown | SD |
| Page: 1 2 3 4 5 6 7 8 9 10 11 |
Top |
Related drugs of malignant transformation related genes |
| Identification of chemicals and drugs interact with genes involved in malignant transfromation |
| (DGIdb 4.0) |
| Entrez ID | Symbol | Category | Interaction Types | Drug Claim Name | Drug Name | PMIDs |
| 6794 | STK11 | KINASE, DRUGGABLE GENOME, CLINICALLY ACTIONABLE, SERINE THREONINE KINASE, ENZYME, TUMOR SUPPRESSOR, DRUG RESISTANCE | EVEROLIMUS | EVEROLIMUS | 21189378 | |
| 6794 | STK11 | KINASE, DRUGGABLE GENOME, CLINICALLY ACTIONABLE, SERINE THREONINE KINASE, ENZYME, TUMOR SUPPRESSOR, DRUG RESISTANCE | SAR245409 | VOXTALISIB | 24634413 | |
| 6794 | STK11 | KINASE, DRUGGABLE GENOME, CLINICALLY ACTIONABLE, SERINE THREONINE KINASE, ENZYME, TUMOR SUPPRESSOR, DRUG RESISTANCE | inhibitor | TOZASERTIB | TOZASERTIB | 19035792 |
| 6794 | STK11 | KINASE, DRUGGABLE GENOME, CLINICALLY ACTIONABLE, SERINE THREONINE KINASE, ENZYME, TUMOR SUPPRESSOR, DRUG RESISTANCE | ATEZOLIZUMAB | ATEZOLIZUMAB | 29773717 | |
| 6794 | STK11 | KINASE, DRUGGABLE GENOME, CLINICALLY ACTIONABLE, SERINE THREONINE KINASE, ENZYME, TUMOR SUPPRESSOR, DRUG RESISTANCE | Cisplatin | CISPLATIN | 28652249 | |
| 6794 | STK11 | KINASE, DRUGGABLE GENOME, CLINICALLY ACTIONABLE, SERINE THREONINE KINASE, ENZYME, TUMOR SUPPRESSOR, DRUG RESISTANCE | Sapanisertib | SAPANISERTIB | 26574479 | |
| 6794 | STK11 | KINASE, DRUGGABLE GENOME, CLINICALLY ACTIONABLE, SERINE THREONINE KINASE, ENZYME, TUMOR SUPPRESSOR, DRUG RESISTANCE | Selumetinib | SELUMETINIB | 27821489 | |
| 6794 | STK11 | KINASE, DRUGGABLE GENOME, CLINICALLY ACTIONABLE, SERINE THREONINE KINASE, ENZYME, TUMOR SUPPRESSOR, DRUG RESISTANCE | Sirolimus | SIROLIMUS | 20142330 | |
| 6794 | STK11 | KINASE, DRUGGABLE GENOME, CLINICALLY ACTIONABLE, SERINE THREONINE KINASE, ENZYME, TUMOR SUPPRESSOR, DRUG RESISTANCE | CI-1040 | CI-1040 | 27821489 | |
| 6794 | STK11 | KINASE, DRUGGABLE GENOME, CLINICALLY ACTIONABLE, SERINE THREONINE KINASE, ENZYME, TUMOR SUPPRESSOR, DRUG RESISTANCE | RDEA119 | 27821489 |
| Page: 1 2 3 |

Copyright 2023-Present -The University of Texas Health Science Center at Houston |