
|
|||||
|
 | |
| |
| |
| |
| |
| |
|
Gene: STK10 |
Gene summary for STK10 |
| Gene information | Species | Human | Gene symbol | STK10 | Gene ID | 6793 |
| Gene name | serine/threonine kinase 10 | |
| Gene Alias | LOK | |
| Cytomap | 5q35.1 | |
| Gene Type | protein-coding | GO ID | GO:0002376 | UniProtAcc | O94804 |
Top |
Malignant transformation analysis |
| Identification of the aberrant gene expression in precancerous and cancerous lesions by comparing the gene expression of stem-like cells in diseased tissues with normal stem cells |
| Entrez ID | Symbol | Replicates | Species | Organ | Tissue | Adj P-value | Log2FC | Malignancy |
| 6793 | STK10 | LZE7T | Human | Esophagus | ESCC | 9.10e-03 | 1.26e-01 | 0.0667 |
| 6793 | STK10 | LZE6T | Human | Esophagus | ESCC | 2.75e-02 | 1.40e-01 | 0.0845 |
| 6793 | STK10 | P1T-E | Human | Esophagus | ESCC | 1.98e-02 | 1.90e-01 | 0.0875 |
| 6793 | STK10 | P2T-E | Human | Esophagus | ESCC | 3.04e-02 | 4.46e-02 | 0.1177 |
| 6793 | STK10 | P4T-E | Human | Esophagus | ESCC | 1.31e-03 | 6.92e-02 | 0.1323 |
| 6793 | STK10 | P5T-E | Human | Esophagus | ESCC | 7.05e-15 | 2.96e-01 | 0.1327 |
| 6793 | STK10 | P8T-E | Human | Esophagus | ESCC | 4.39e-04 | 1.81e-02 | 0.0889 |
| 6793 | STK10 | P11T-E | Human | Esophagus | ESCC | 5.52e-07 | 4.33e-01 | 0.1426 |
| 6793 | STK10 | P12T-E | Human | Esophagus | ESCC | 1.68e-07 | 7.13e-02 | 0.1122 |
| 6793 | STK10 | P15T-E | Human | Esophagus | ESCC | 7.54e-03 | 9.64e-02 | 0.1149 |
| 6793 | STK10 | P17T-E | Human | Esophagus | ESCC | 3.82e-07 | 2.21e-01 | 0.1278 |
| 6793 | STK10 | P20T-E | Human | Esophagus | ESCC | 1.85e-07 | 7.55e-02 | 0.1124 |
| 6793 | STK10 | P21T-E | Human | Esophagus | ESCC | 8.65e-09 | 1.96e-01 | 0.1617 |
| 6793 | STK10 | P22T-E | Human | Esophagus | ESCC | 3.43e-03 | 3.52e-02 | 0.1236 |
| 6793 | STK10 | P23T-E | Human | Esophagus | ESCC | 4.22e-08 | 2.10e-01 | 0.108 |
| 6793 | STK10 | P24T-E | Human | Esophagus | ESCC | 2.63e-08 | 1.53e-01 | 0.1287 |
| 6793 | STK10 | P26T-E | Human | Esophagus | ESCC | 1.39e-03 | 6.40e-02 | 0.1276 |
| 6793 | STK10 | P27T-E | Human | Esophagus | ESCC | 4.45e-05 | 8.83e-02 | 0.1055 |
| 6793 | STK10 | P28T-E | Human | Esophagus | ESCC | 1.18e-12 | 1.80e-01 | 0.1149 |
| 6793 | STK10 | P30T-E | Human | Esophagus | ESCC | 3.90e-03 | 2.10e-01 | 0.137 |
| Page: 1 2 3 4 |
| Tissue | Expression Dynamics | Abbreviation |
| Esophagus | 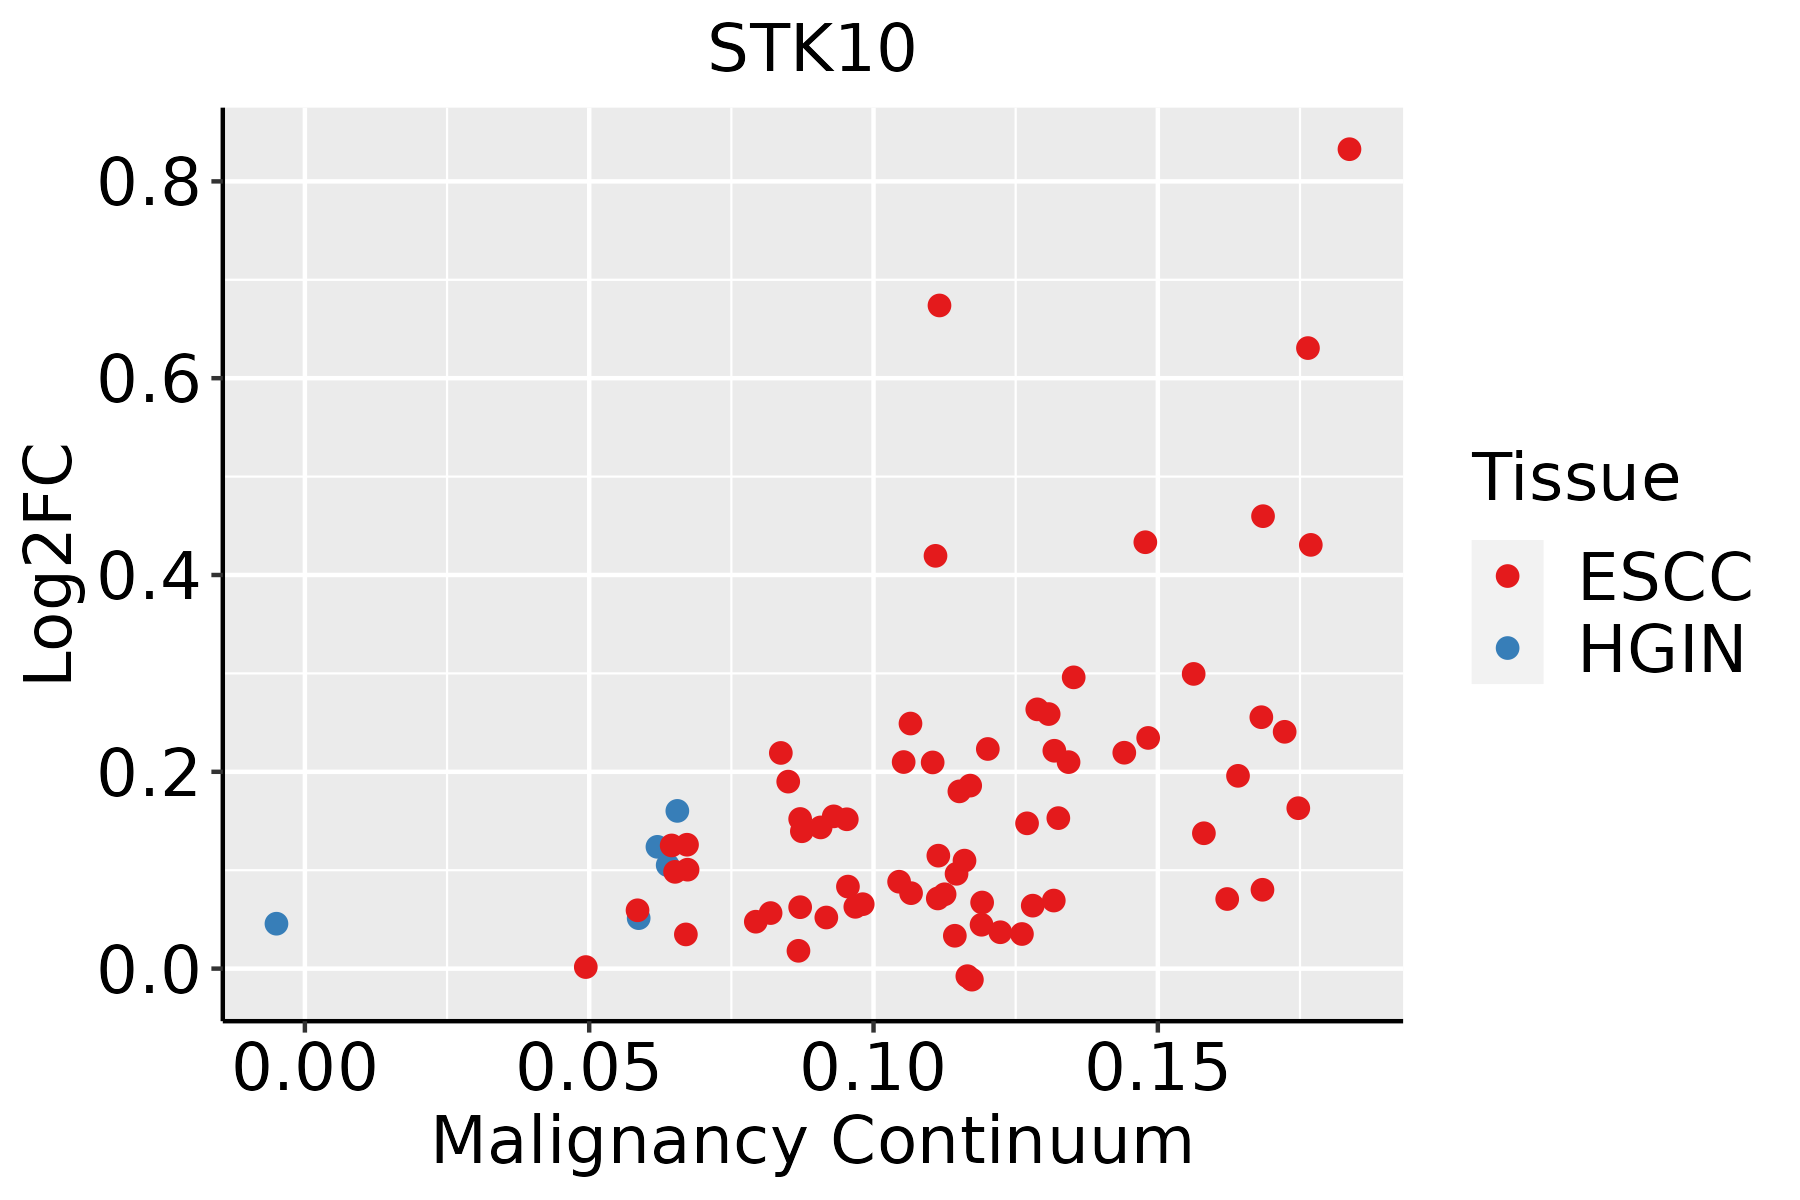 | ESCC: Esophageal squamous cell carcinoma |
| HGIN: High-grade intraepithelial neoplasias | ||
| LGIN: Low-grade intraepithelial neoplasias | ||
| Liver |  | HCC: Hepatocellular carcinoma |
| NAFLD: Non-alcoholic fatty liver disease | ||
| Oral Cavity | 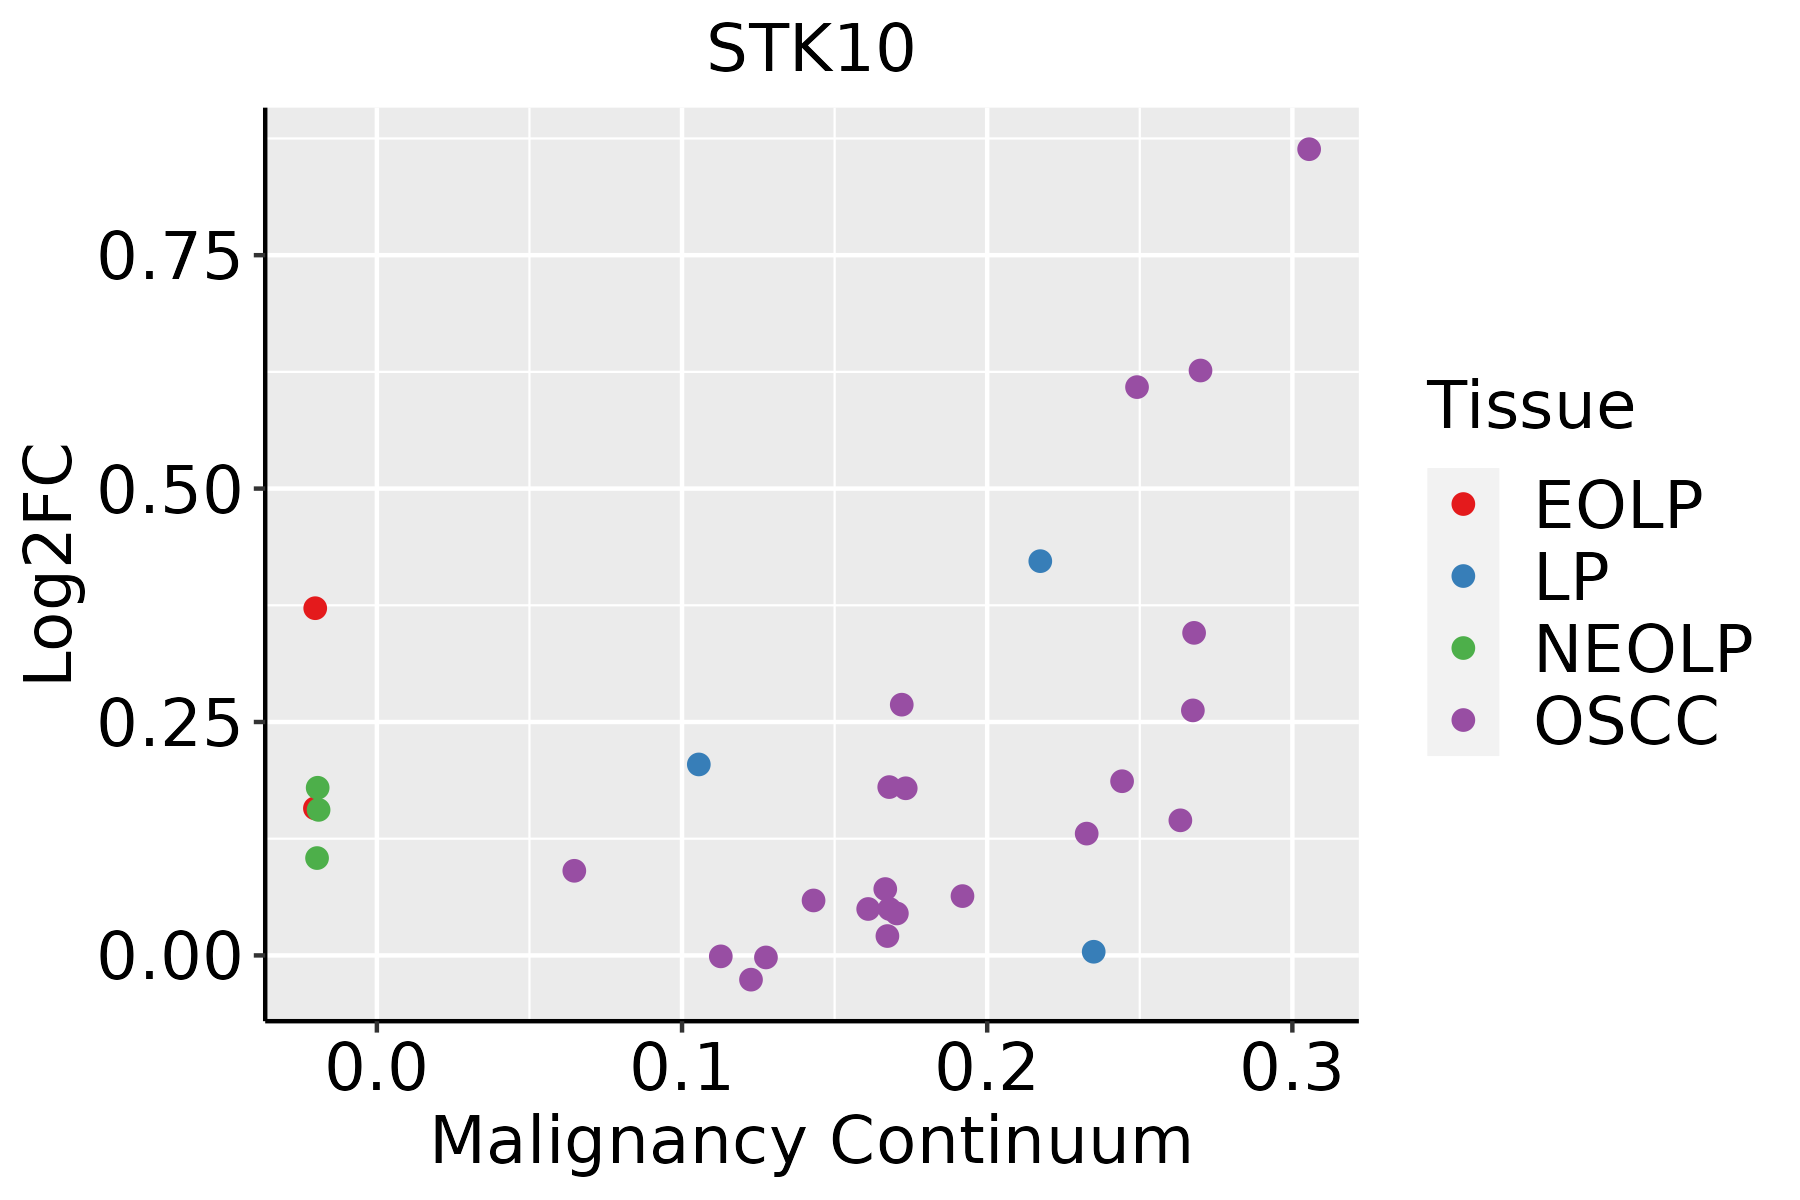 | EOLP: Erosive Oral lichen planus |
| LP: leukoplakia | ||
| NEOLP: Non-erosive oral lichen planus | ||
| OSCC: Oral squamous cell carcinoma | ||
| Thyroid | 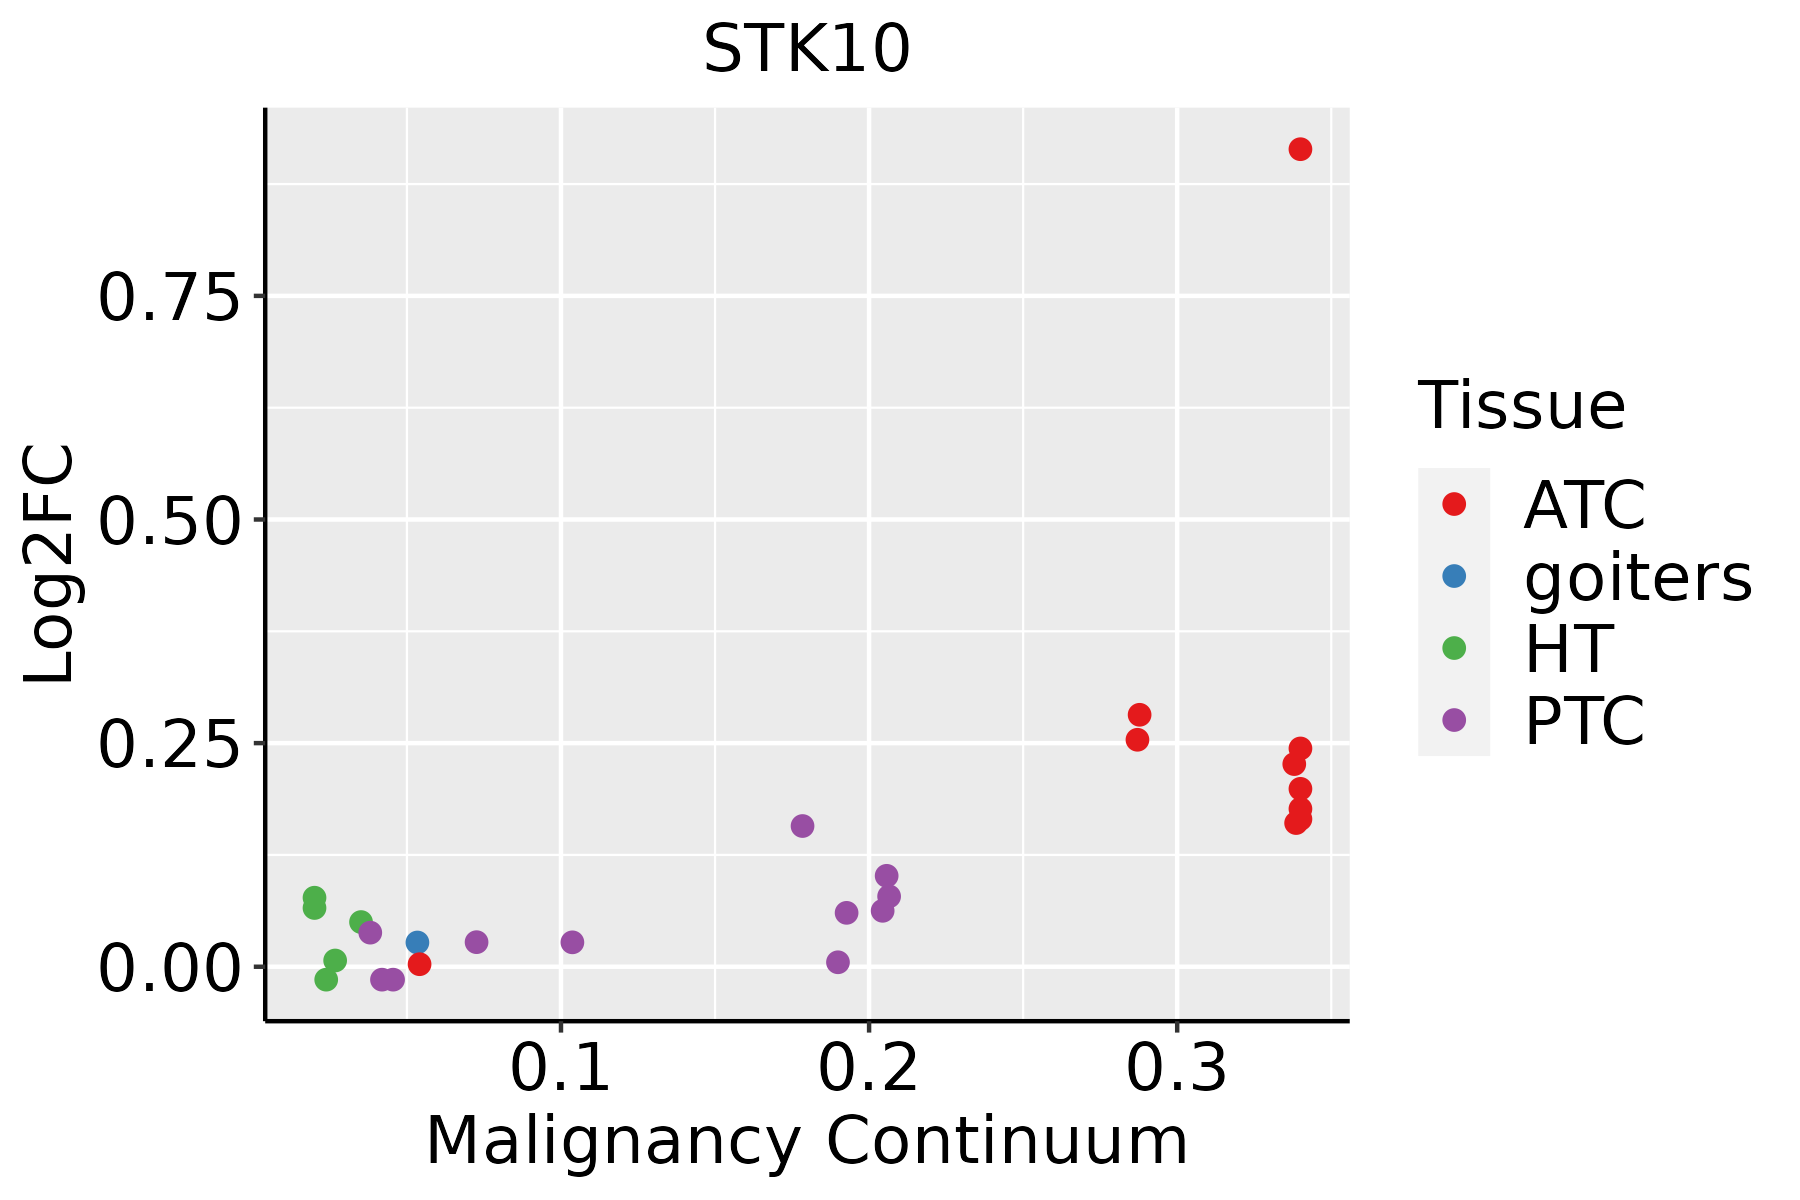 | ATC: Anaplastic thyroid cancer |
| HT: Hashimoto's thyroiditis | ||
| PTC: Papillary thyroid cancer |
| ∗log2FC in expression of this searched gene in stem-like cells from each diseased tissue sample relative to stem-like cells in normal samples in each tissue plotted against the malignancy continuum. Samples are colored based on if they are from different disease stage. |
Top |
Malignant transformation related pathway analysis |
| Find out the enriched GO biological processes and KEGG pathways involved in transition from healthy to precancer to cancer |
| Tissue | Disease Stage | Enriched GO biological Processes |
| Colorectum | AD |  |
| Colorectum | SER |  |
| Colorectum | MSS |  |
| Colorectum | MSI-H |  |
| Colorectum | FAP |  |
| ∗Top 15 enriched GO BP terms are showed in the bar plot of each disease state in each tissue. Each row represents a significant GO biological process which is colored according to the -log10(p.adjust). |
| Page: 1 2 3 4 5 6 7 8 9 |
| GO ID | Tissue | Disease Stage | Description | Gene Ratio | Bg Ratio | pvalue | p.adjust | Count |
| GO:004677710 | Esophagus | ESCC | protein autophosphorylation | 138/8552 | 227/18723 | 2.98e-06 | 3.38e-05 | 138 |
| GO:000268515 | Esophagus | ESCC | regulation of leukocyte migration | 114/8552 | 210/18723 | 7.26e-03 | 2.63e-02 | 114 |
| GO:000715918 | Esophagus | ESCC | leukocyte cell-cell adhesion | 192/8552 | 371/18723 | 1.03e-02 | 3.51e-02 | 192 |
| GO:00467775 | Liver | HCC | protein autophosphorylation | 123/7958 | 227/18723 | 2.40e-04 | 1.80e-03 | 123 |
| GO:00467779 | Oral cavity | OSCC | protein autophosphorylation | 123/7305 | 227/18723 | 2.31e-06 | 2.93e-05 | 123 |
| GO:000268510 | Oral cavity | OSCC | regulation of leukocyte migration | 108/7305 | 210/18723 | 1.63e-04 | 1.13e-03 | 108 |
| GO:000715916 | Oral cavity | OSCC | leukocyte cell-cell adhesion | 178/7305 | 371/18723 | 2.44e-04 | 1.57e-03 | 178 |
| GO:005090010 | Oral cavity | OSCC | leukocyte migration | 176/7305 | 369/18723 | 3.80e-04 | 2.31e-03 | 176 |
| GO:00716758 | Oral cavity | OSCC | regulation of mononuclear cell migration | 60/7305 | 115/18723 | 2.78e-03 | 1.21e-02 | 60 |
| GO:20004013 | Oral cavity | OSCC | regulation of lymphocyte migration | 34/7305 | 61/18723 | 5.90e-03 | 2.25e-02 | 34 |
| GO:000715917 | Oral cavity | EOLP | leukocyte cell-cell adhesion | 86/2218 | 371/18723 | 5.01e-10 | 4.11e-08 | 86 |
| GO:005090014 | Oral cavity | EOLP | leukocyte migration | 74/2218 | 369/18723 | 3.40e-06 | 7.35e-05 | 74 |
| GO:004677713 | Oral cavity | EOLP | protein autophosphorylation | 49/2218 | 227/18723 | 2.04e-05 | 3.21e-04 | 49 |
| GO:00704862 | Oral cavity | EOLP | leukocyte aggregation | 6/2218 | 13/18723 | 2.24e-03 | 1.39e-02 | 6 |
| GO:000268514 | Oral cavity | EOLP | regulation of leukocyte migration | 38/2218 | 210/18723 | 5.04e-03 | 2.65e-02 | 38 |
| GO:000715923 | Oral cavity | NEOLP | leukocyte cell-cell adhesion | 70/2005 | 371/18723 | 1.65e-06 | 4.05e-05 | 70 |
| GO:005090023 | Oral cavity | NEOLP | leukocyte migration | 67/2005 | 369/18723 | 1.04e-05 | 1.96e-04 | 67 |
| GO:004677722 | Oral cavity | NEOLP | protein autophosphorylation | 45/2005 | 227/18723 | 3.28e-05 | 4.87e-04 | 45 |
| GO:000268523 | Oral cavity | NEOLP | regulation of leukocyte migration | 40/2005 | 210/18723 | 2.14e-04 | 2.27e-03 | 40 |
| GO:007167514 | Oral cavity | NEOLP | regulation of mononuclear cell migration | 24/2005 | 115/18723 | 1.00e-03 | 7.68e-03 | 24 |
| Page: 1 2 |
| Pathway ID | Tissue | Disease Stage | Description | Gene Ratio | Bg Ratio | pvalue | p.adjust | qvalue | Count |
| Page: 1 |
Top |
Cell-cell communication analysis |
| Identification of potential cell-cell interactions between two cell types and their ligand-receptor pairs for different disease states |
| Ligand | Receptor | LRpair | Pathway | Tissue | Disease Stage |
| Page: 1 |
Top |
Single-cell gene regulatory network inference analysis |
| Find out the significant the regulons (TFs) and the target genes of each regulon across cell types for different disease states |
| TF | Cell Type | Tissue | Disease Stage | Target Gene | RSS | Regulon Activity |
| ∗The dot plots of a searched regulon are shown for all cell subpopulations in each disease state of each tissue based on the regulon specific score inferred using pySCENIC and by calculating the average expression. |
| Page: 1 |
Top |
Somatic mutation of malignant transformation related genes |
| Annotation of somatic variants for genes involved in malignant transformation |
| Hugo Symbol | Variant Class | Variant Classification | dbSNP RS | HGVSc | HGVSp | HGVSp Short | SWISSPROT | BIOTYPE | SIFT | PolyPhen | Tumor Sample Barcode | Tissue | Histology | Sex | Age | Stage | Therapy Types | Drugs | Outcome |
| STK10 | SNV | Missense_Mutation | c.2125N>C | p.Ala709Pro | p.A709P | O94804 | protein_coding | deleterious(0.03) | benign(0.22) | TCGA-A8-A07L-01 | Breast | breast invasive carcinoma | Female | <65 | III/IV | Chemotherapy | CR | ||
| STK10 | SNV | Missense_Mutation | novel | c.1888N>C | p.Asp630His | p.D630H | O94804 | protein_coding | deleterious(0) | probably_damaging(0.981) | TCGA-A8-A08R-01 | Breast | breast invasive carcinoma | Female | <65 | I/II | Unknown | Unknown | SD |
| STK10 | SNV | Missense_Mutation | novel | c.543N>T | p.Lys181Asn | p.K181N | O94804 | protein_coding | deleterious(0) | probably_damaging(0.969) | TCGA-AN-A046-01 | Breast | breast invasive carcinoma | Female | >=65 | I/II | Unknown | Unknown | SD |
| STK10 | SNV | Missense_Mutation | novel | c.2278N>A | p.Gln760Lys | p.Q760K | O94804 | protein_coding | tolerated(0.06) | probably_damaging(0.999) | TCGA-AO-A0J9-01 | Breast | breast invasive carcinoma | Female | <65 | III/IV | Chemotherapy | cyclophosphamide | PD |
| STK10 | SNV | Missense_Mutation | c.1057N>T | p.Asn353Tyr | p.N353Y | O94804 | protein_coding | deleterious(0.02) | benign(0.071) | TCGA-B6-A0RE-01 | Breast | breast invasive carcinoma | Female | <65 | I/II | Unknown | Unknown | SD | |
| STK10 | SNV | Missense_Mutation | c.2484N>A | p.Asn828Lys | p.N828K | O94804 | protein_coding | tolerated(0.09) | possibly_damaging(0.849) | TCGA-BH-A0BG-01 | Breast | breast invasive carcinoma | Female | >=65 | I/II | Unknown | Unknown | SD | |
| STK10 | SNV | Missense_Mutation | c.761N>T | p.Pro254Leu | p.P254L | O94804 | protein_coding | deleterious(0) | probably_damaging(1) | TCGA-BH-A18V-01 | Breast | breast invasive carcinoma | Female | <65 | I/II | Unknown | Unknown | SD | |
| STK10 | SNV | Missense_Mutation | c.1591N>T | p.Arg531Cys | p.R531C | O94804 | protein_coding | deleterious(0) | probably_damaging(1) | TCGA-BH-A1FN-01 | Breast | breast invasive carcinoma | Female | <65 | I/II | Unknown | Unknown | PD | |
| STK10 | SNV | Missense_Mutation | novel | c.2106G>C | p.Gln702His | p.Q702H | O94804 | protein_coding | deleterious(0) | probably_damaging(0.997) | TCGA-BH-A2L8-01 | Breast | breast invasive carcinoma | Female | <65 | I/II | Chemotherapy | cytoxan | CR |
| STK10 | SNV | Missense_Mutation | novel | c.2836N>A | p.Glu946Lys | p.E946K | O94804 | protein_coding | deleterious(0) | possibly_damaging(0.606) | TCGA-LL-A73Y-01 | Breast | breast invasive carcinoma | Female | >=65 | I/II | Chemotherapy | taxotere | SD |
| Page: 1 2 3 4 5 6 7 8 9 10 11 |
Top |
Related drugs of malignant transformation related genes |
| Identification of chemicals and drugs interact with genes involved in malignant transfromation |
| (DGIdb 4.0) |
| Entrez ID | Symbol | Category | Interaction Types | Drug Claim Name | Drug Name | PMIDs |
| 6793 | STK10 | SERINE THREONINE KINASE, KINASE, ENZYME, DRUGGABLE GENOME | inhibitor | 381118815 | ||
| 6793 | STK10 | SERINE THREONINE KINASE, KINASE, ENZYME, DRUGGABLE GENOME | inhibitor | 178102336 | BOSUTINIB | |
| 6793 | STK10 | SERINE THREONINE KINASE, KINASE, ENZYME, DRUGGABLE GENOME | inhibitor | HESPERADIN | HESPERADIN | 19035792 |
| Page: 1 |

Copyright 2023-Present -The University of Texas Health Science Center at Houston |