
|
|||||
|
 | |
| |
| |
| |
| |
| |
|
Gene: STIM2 |
Gene summary for STIM2 |
| Gene information | Species | Human | Gene symbol | STIM2 | Gene ID | 57620 |
| Gene name | stromal interaction molecule 2 | |
| Gene Alias | STIM2 | |
| Cytomap | 4p15.2 | |
| Gene Type | protein-coding | GO ID | GO:0002115 | UniProtAcc | B3KUB5 |
Top |
Malignant transformation analysis |
| Identification of the aberrant gene expression in precancerous and cancerous lesions by comparing the gene expression of stem-like cells in diseased tissues with normal stem cells |
| Entrez ID | Symbol | Replicates | Species | Organ | Tissue | Adj P-value | Log2FC | Malignancy |
| 57620 | STIM2 | LZE7T | Human | Esophagus | ESCC | 2.39e-05 | 1.55e-01 | 0.0667 |
| 57620 | STIM2 | LZE8T | Human | Esophagus | ESCC | 3.39e-08 | 1.57e-01 | 0.067 |
| 57620 | STIM2 | LZE24T | Human | Esophagus | ESCC | 8.25e-05 | 1.70e-01 | 0.0596 |
| 57620 | STIM2 | LZE21T | Human | Esophagus | ESCC | 1.42e-05 | 1.54e-01 | 0.0655 |
| 57620 | STIM2 | LZE6T | Human | Esophagus | ESCC | 2.27e-02 | 4.62e-02 | 0.0845 |
| 57620 | STIM2 | P1T-E | Human | Esophagus | ESCC | 9.78e-05 | 1.83e-01 | 0.0875 |
| 57620 | STIM2 | P2T-E | Human | Esophagus | ESCC | 4.69e-32 | 5.89e-01 | 0.1177 |
| 57620 | STIM2 | P4T-E | Human | Esophagus | ESCC | 5.33e-05 | 1.07e-01 | 0.1323 |
| 57620 | STIM2 | P5T-E | Human | Esophagus | ESCC | 3.08e-08 | 4.71e-02 | 0.1327 |
| 57620 | STIM2 | P8T-E | Human | Esophagus | ESCC | 5.31e-18 | 3.23e-01 | 0.0889 |
| 57620 | STIM2 | P9T-E | Human | Esophagus | ESCC | 2.06e-10 | 1.19e-01 | 0.1131 |
| 57620 | STIM2 | P10T-E | Human | Esophagus | ESCC | 6.82e-25 | 4.84e-01 | 0.116 |
| 57620 | STIM2 | P11T-E | Human | Esophagus | ESCC | 4.42e-06 | 1.31e-01 | 0.1426 |
| 57620 | STIM2 | P12T-E | Human | Esophagus | ESCC | 9.24e-06 | 2.48e-01 | 0.1122 |
| 57620 | STIM2 | P15T-E | Human | Esophagus | ESCC | 4.40e-22 | 3.19e-01 | 0.1149 |
| 57620 | STIM2 | P16T-E | Human | Esophagus | ESCC | 9.47e-11 | 1.42e-01 | 0.1153 |
| 57620 | STIM2 | P20T-E | Human | Esophagus | ESCC | 1.42e-05 | 1.91e-01 | 0.1124 |
| 57620 | STIM2 | P21T-E | Human | Esophagus | ESCC | 6.93e-42 | 1.02e+00 | 0.1617 |
| 57620 | STIM2 | P22T-E | Human | Esophagus | ESCC | 5.49e-06 | 1.09e-01 | 0.1236 |
| 57620 | STIM2 | P23T-E | Human | Esophagus | ESCC | 1.15e-10 | 1.52e-01 | 0.108 |
| Page: 1 2 3 4 5 |
| Tissue | Expression Dynamics | Abbreviation |
| Esophagus |  | ESCC: Esophageal squamous cell carcinoma |
| HGIN: High-grade intraepithelial neoplasias | ||
| LGIN: Low-grade intraepithelial neoplasias | ||
| Oral Cavity |  | EOLP: Erosive Oral lichen planus |
| LP: leukoplakia | ||
| NEOLP: Non-erosive oral lichen planus | ||
| OSCC: Oral squamous cell carcinoma | ||
| Skin | 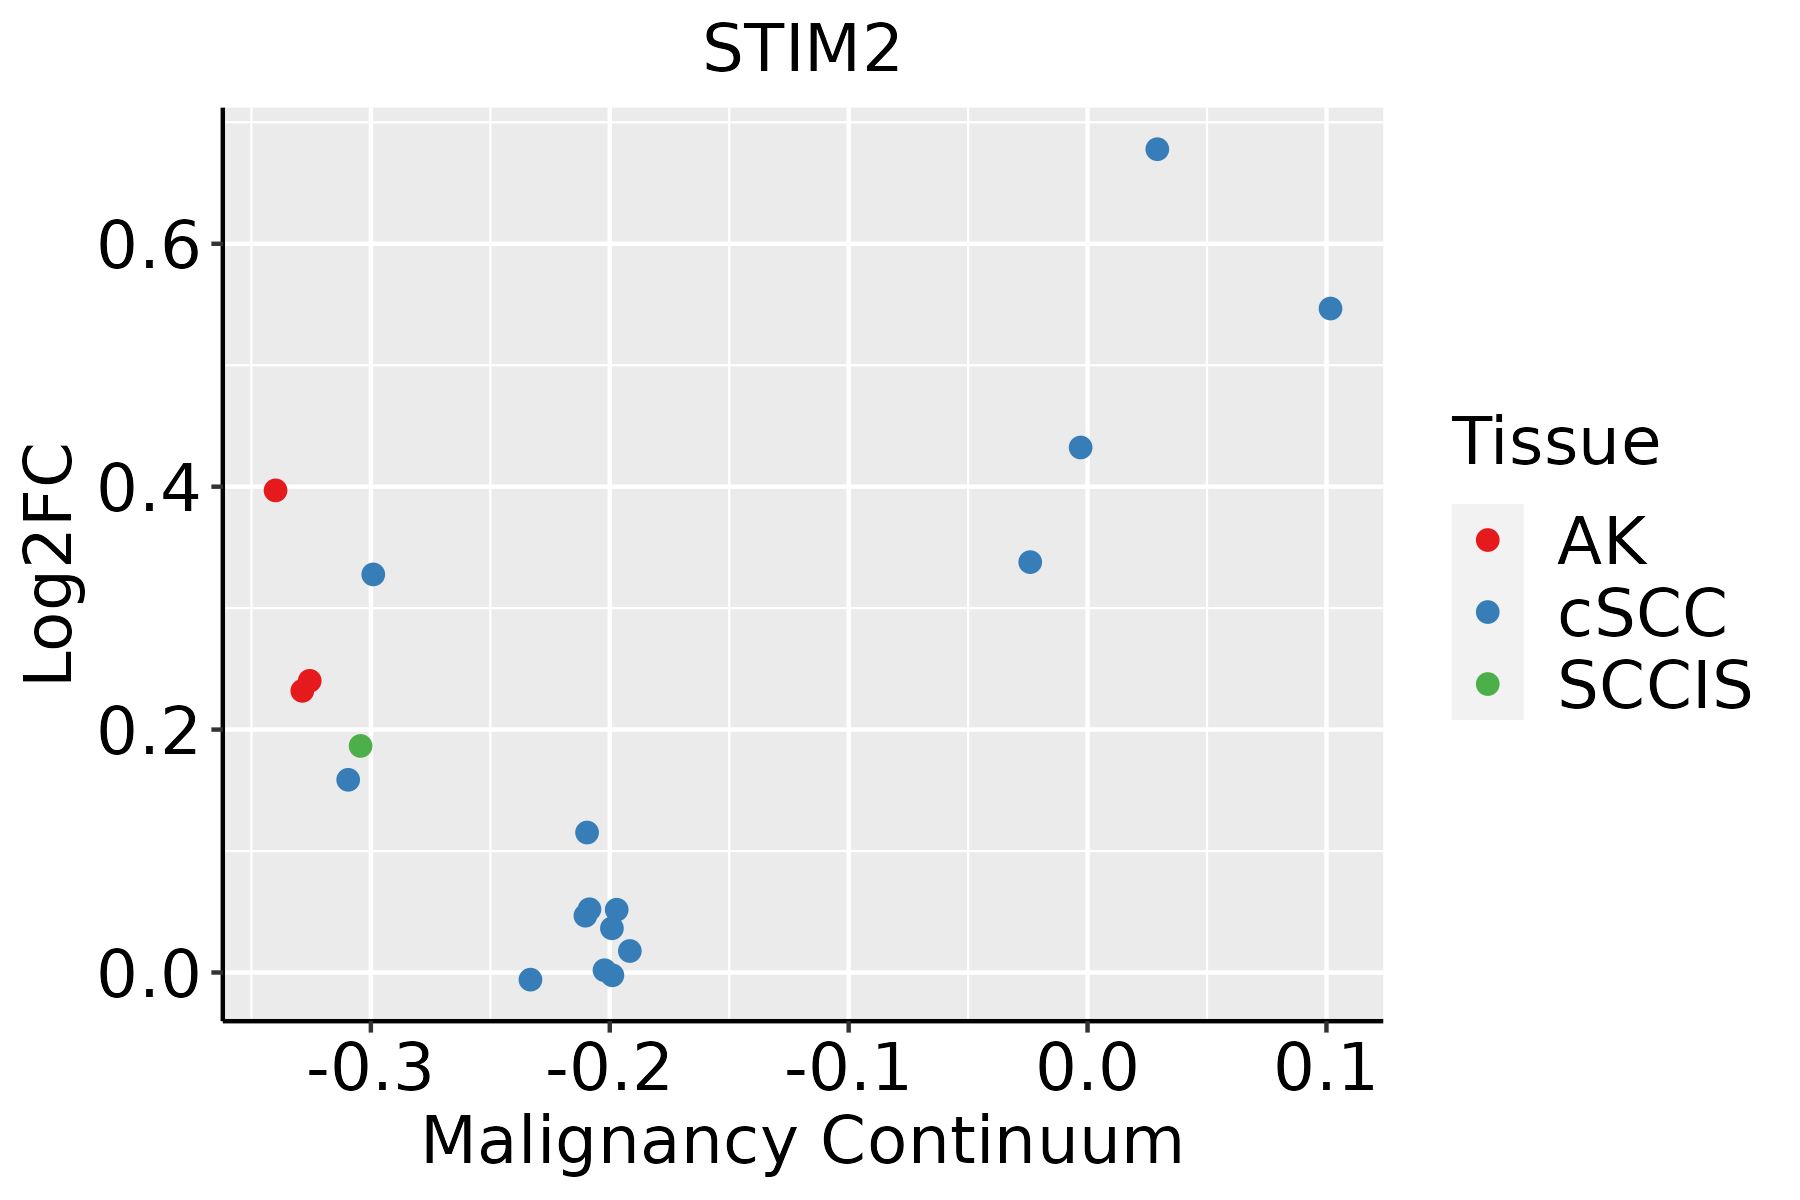 | AK: Actinic keratosis |
| cSCC: Cutaneous squamous cell carcinoma | ||
| SCCIS:squamous cell carcinoma in situ | ||
| Thyroid |  | ATC: Anaplastic thyroid cancer |
| HT: Hashimoto's thyroiditis | ||
| PTC: Papillary thyroid cancer |
| ∗log2FC in expression of this searched gene in stem-like cells from each diseased tissue sample relative to stem-like cells in normal samples in each tissue plotted against the malignancy continuum. Samples are colored based on if they are from different disease stage. |
Top |
Malignant transformation related pathway analysis |
| Find out the enriched GO biological processes and KEGG pathways involved in transition from healthy to precancer to cancer |
| Tissue | Disease Stage | Enriched GO biological Processes |
| Colorectum | AD |  |
| Colorectum | SER |  |
| Colorectum | MSS |  |
| Colorectum | MSI-H |  |
| Colorectum | FAP |  |
| ∗Top 15 enriched GO BP terms are showed in the bar plot of each disease state in each tissue. Each row represents a significant GO biological process which is colored according to the -log10(p.adjust). |
| Page: 1 2 3 4 5 6 7 8 9 |
| GO ID | Tissue | Disease Stage | Description | Gene Ratio | Bg Ratio | pvalue | p.adjust | Count |
| GO:00725032 | Oral cavity | EOLP | cellular divalent inorganic cation homeostasis | 75/2218 | 486/18723 | 9.77e-03 | 4.42e-02 | 75 |
| Page: 1 |
| Pathway ID | Tissue | Disease Stage | Description | Gene Ratio | Bg Ratio | pvalue | p.adjust | qvalue | Count |
| Page: 1 |
Top |
Cell-cell communication analysis |
| Identification of potential cell-cell interactions between two cell types and their ligand-receptor pairs for different disease states |
| Ligand | Receptor | LRpair | Pathway | Tissue | Disease Stage |
| Page: 1 |
Top |
Single-cell gene regulatory network inference analysis |
| Find out the significant the regulons (TFs) and the target genes of each regulon across cell types for different disease states |
| TF | Cell Type | Tissue | Disease Stage | Target Gene | RSS | Regulon Activity |
| ∗The dot plots of a searched regulon are shown for all cell subpopulations in each disease state of each tissue based on the regulon specific score inferred using pySCENIC and by calculating the average expression. |
| Page: 1 |
Top |
Somatic mutation of malignant transformation related genes |
| Annotation of somatic variants for genes involved in malignant transformation |
| Hugo Symbol | Variant Class | Variant Classification | dbSNP RS | HGVSc | HGVSp | HGVSp Short | SWISSPROT | BIOTYPE | SIFT | PolyPhen | Tumor Sample Barcode | Tissue | Histology | Sex | Age | Stage | Therapy Types | Drugs | Outcome |
| STIM2 | SNV | Missense_Mutation | novel | c.1321C>T | p.Arg441Cys | p.R441C | protein_coding | deleterious(0) | probably_damaging(0.993) | TCGA-AN-A046-01 | Breast | breast invasive carcinoma | Female | >=65 | I/II | Unknown | Unknown | SD | |
| STIM2 | insertion | Nonsense_Mutation | novel | c.1097_1098insGTCTCATACCTGTAATCTCAG | p.Tyr366delinsTer | p.Y366delins* | protein_coding | TCGA-A2-A0EV-01 | Breast | breast invasive carcinoma | Female | >=65 | I/II | Unknown | Unknown | SD | |||
| STIM2 | deletion | Frame_Shift_Del | novel | c.855delN | p.Leu286Ter | p.L286* | protein_coding | TCGA-EW-A2FV-01 | Breast | breast invasive carcinoma | Female | <65 | III/IV | Chemotherapy | docetaxel | SD | |||
| STIM2 | SNV | Missense_Mutation | rs150484445 | c.2105G>A | p.Arg702His | p.R702H | protein_coding | tolerated_low_confidence(0.08) | benign(0.04) | TCGA-2W-A8YY-01 | Cervix | cervical & endocervical cancer | Female | <65 | I/II | Chemotherapy | cisplatin | CR | |
| STIM2 | SNV | Missense_Mutation | c.1756N>C | p.Glu586Gln | p.E586Q | protein_coding | deleterious_low_confidence(0.01) | possibly_damaging(0.815) | TCGA-C5-A1BQ-01 | Cervix | cervical & endocervical cancer | Female | >=65 | III/IV | Chemotherapy | cisplatin | CR | ||
| STIM2 | SNV | Missense_Mutation | novel | c.1964N>G | p.Ser655Cys | p.S655C | protein_coding | deleterious_low_confidence(0.02) | possibly_damaging(0.628) | TCGA-VS-A953-01 | Cervix | cervical & endocervical cancer | Female | <65 | I/II | Unknown | Unknown | PD | |
| STIM2 | SNV | Missense_Mutation | c.1724N>T | p.Cys575Phe | p.C575F | protein_coding | deleterious_low_confidence(0.02) | possibly_damaging(0.896) | TCGA-ZJ-AAXU-01 | Cervix | cervical & endocervical cancer | Female | <65 | I/II | Unknown | Unknown | SD | ||
| STIM2 | insertion | In_Frame_Ins | novel | c.1275-1_1275insAATTTT | p.Lys425_Lys426insIleLeu | p.K425_K426insIL | protein_coding | TCGA-EX-A69M-01 | Cervix | cervical & endocervical cancer | Female | <65 | I/II | Unknown | Unknown | PD | |||
| STIM2 | SNV | Missense_Mutation | c.649G>T | p.Asp217Tyr | p.D217Y | protein_coding | deleterious(0) | probably_damaging(0.997) | TCGA-A6-6141-01 | Colorectum | colon adenocarcinoma | Male | <65 | I/II | Chemotherapy | 5-fu | SD | ||
| STIM2 | SNV | Missense_Mutation | c.1748N>T | p.Glu583Val | p.E583V | protein_coding | deleterious_low_confidence(0.01) | probably_damaging(0.915) | TCGA-AA-3684-01 | Colorectum | colon adenocarcinoma | Female | >=65 | III/IV | Unknown | Unknown | SD |
| Page: 1 2 3 4 5 6 7 8 9 |
Top |
Related drugs of malignant transformation related genes |
| Identification of chemicals and drugs interact with genes involved in malignant transfromation |
| (DGIdb 4.0) |
| Entrez ID | Symbol | Category | Interaction Types | Drug Claim Name | Drug Name | PMIDs |
| 57620 | STIM2 | DRUGGABLE GENOME | AMINOGLYCOSIDE ANTIBIOTIC | 17905723 |
| Page: 1 |

Copyright 2023-Present -The University of Texas Health Science Center at Houston |