
|
|||||
|
 | |
| |
| |
| |
| |
| |
|
Gene: STIM1 |
Gene summary for STIM1 |
| Gene information | Species | Human | Gene symbol | STIM1 | Gene ID | 6786 |
| Gene name | stromal interaction molecule 1 | |
| Gene Alias | D11S4896E | |
| Cytomap | 11p15.4 | |
| Gene Type | protein-coding | GO ID | GO:0001525 | UniProtAcc | G0XQ39 |
Top |
Malignant transformation analysis |
| Identification of the aberrant gene expression in precancerous and cancerous lesions by comparing the gene expression of stem-like cells in diseased tissues with normal stem cells |
| Entrez ID | Symbol | Replicates | Species | Organ | Tissue | Adj P-value | Log2FC | Malignancy |
| 6786 | STIM1 | HTA11_3410_2000001011 | Human | Colorectum | AD | 1.18e-02 | -3.20e-01 | 0.0155 |
| 6786 | STIM1 | HTA11_347_2000001011 | Human | Colorectum | AD | 2.67e-06 | 4.88e-01 | -0.1954 |
| 6786 | STIM1 | HTA11_99999970781_79442 | Human | Colorectum | MSS | 1.14e-02 | -2.41e-01 | 0.294 |
| 6786 | STIM1 | HTA11_99999974143_84620 | Human | Colorectum | MSS | 2.74e-02 | -2.68e-01 | 0.3005 |
| 6786 | STIM1 | A002-C-010 | Human | Colorectum | FAP | 4.91e-03 | -2.52e-01 | 0.242 |
| 6786 | STIM1 | A001-C-207 | Human | Colorectum | FAP | 3.98e-02 | -2.48e-01 | 0.1278 |
| 6786 | STIM1 | A015-C-203 | Human | Colorectum | FAP | 9.61e-21 | -3.37e-01 | -0.1294 |
| 6786 | STIM1 | A015-C-204 | Human | Colorectum | FAP | 4.19e-04 | -2.76e-01 | -0.0228 |
| 6786 | STIM1 | A014-C-040 | Human | Colorectum | FAP | 3.43e-02 | -3.75e-01 | -0.1184 |
| 6786 | STIM1 | A002-C-201 | Human | Colorectum | FAP | 2.25e-09 | -3.18e-01 | 0.0324 |
| 6786 | STIM1 | A002-C-203 | Human | Colorectum | FAP | 1.08e-04 | -2.38e-01 | 0.2786 |
| 6786 | STIM1 | A001-C-119 | Human | Colorectum | FAP | 2.73e-04 | -3.15e-01 | -0.1557 |
| 6786 | STIM1 | A001-C-108 | Human | Colorectum | FAP | 2.15e-13 | -3.63e-01 | -0.0272 |
| 6786 | STIM1 | A002-C-205 | Human | Colorectum | FAP | 2.51e-16 | -4.41e-01 | -0.1236 |
| 6786 | STIM1 | A001-C-104 | Human | Colorectum | FAP | 1.27e-03 | -2.72e-01 | 0.0184 |
| 6786 | STIM1 | A015-C-005 | Human | Colorectum | FAP | 2.37e-03 | -2.60e-01 | -0.0336 |
| 6786 | STIM1 | A015-C-006 | Human | Colorectum | FAP | 7.20e-11 | -4.78e-01 | -0.0994 |
| 6786 | STIM1 | A015-C-106 | Human | Colorectum | FAP | 2.20e-08 | -2.60e-01 | -0.0511 |
| 6786 | STIM1 | A002-C-114 | Human | Colorectum | FAP | 7.74e-13 | -3.81e-01 | -0.1561 |
| 6786 | STIM1 | A015-C-104 | Human | Colorectum | FAP | 2.97e-23 | -3.95e-01 | -0.1899 |
| Page: 1 2 3 4 5 6 |
| Tissue | Expression Dynamics | Abbreviation |
| Colorectum (GSE201348) |  | FAP: Familial adenomatous polyposis |
| CRC: Colorectal cancer | ||
| Colorectum (HTA11) |  | AD: Adenomas |
| SER: Sessile serrated lesions | ||
| MSI-H: Microsatellite-high colorectal cancer | ||
| MSS: Microsatellite stable colorectal cancer | ||
| Esophagus | 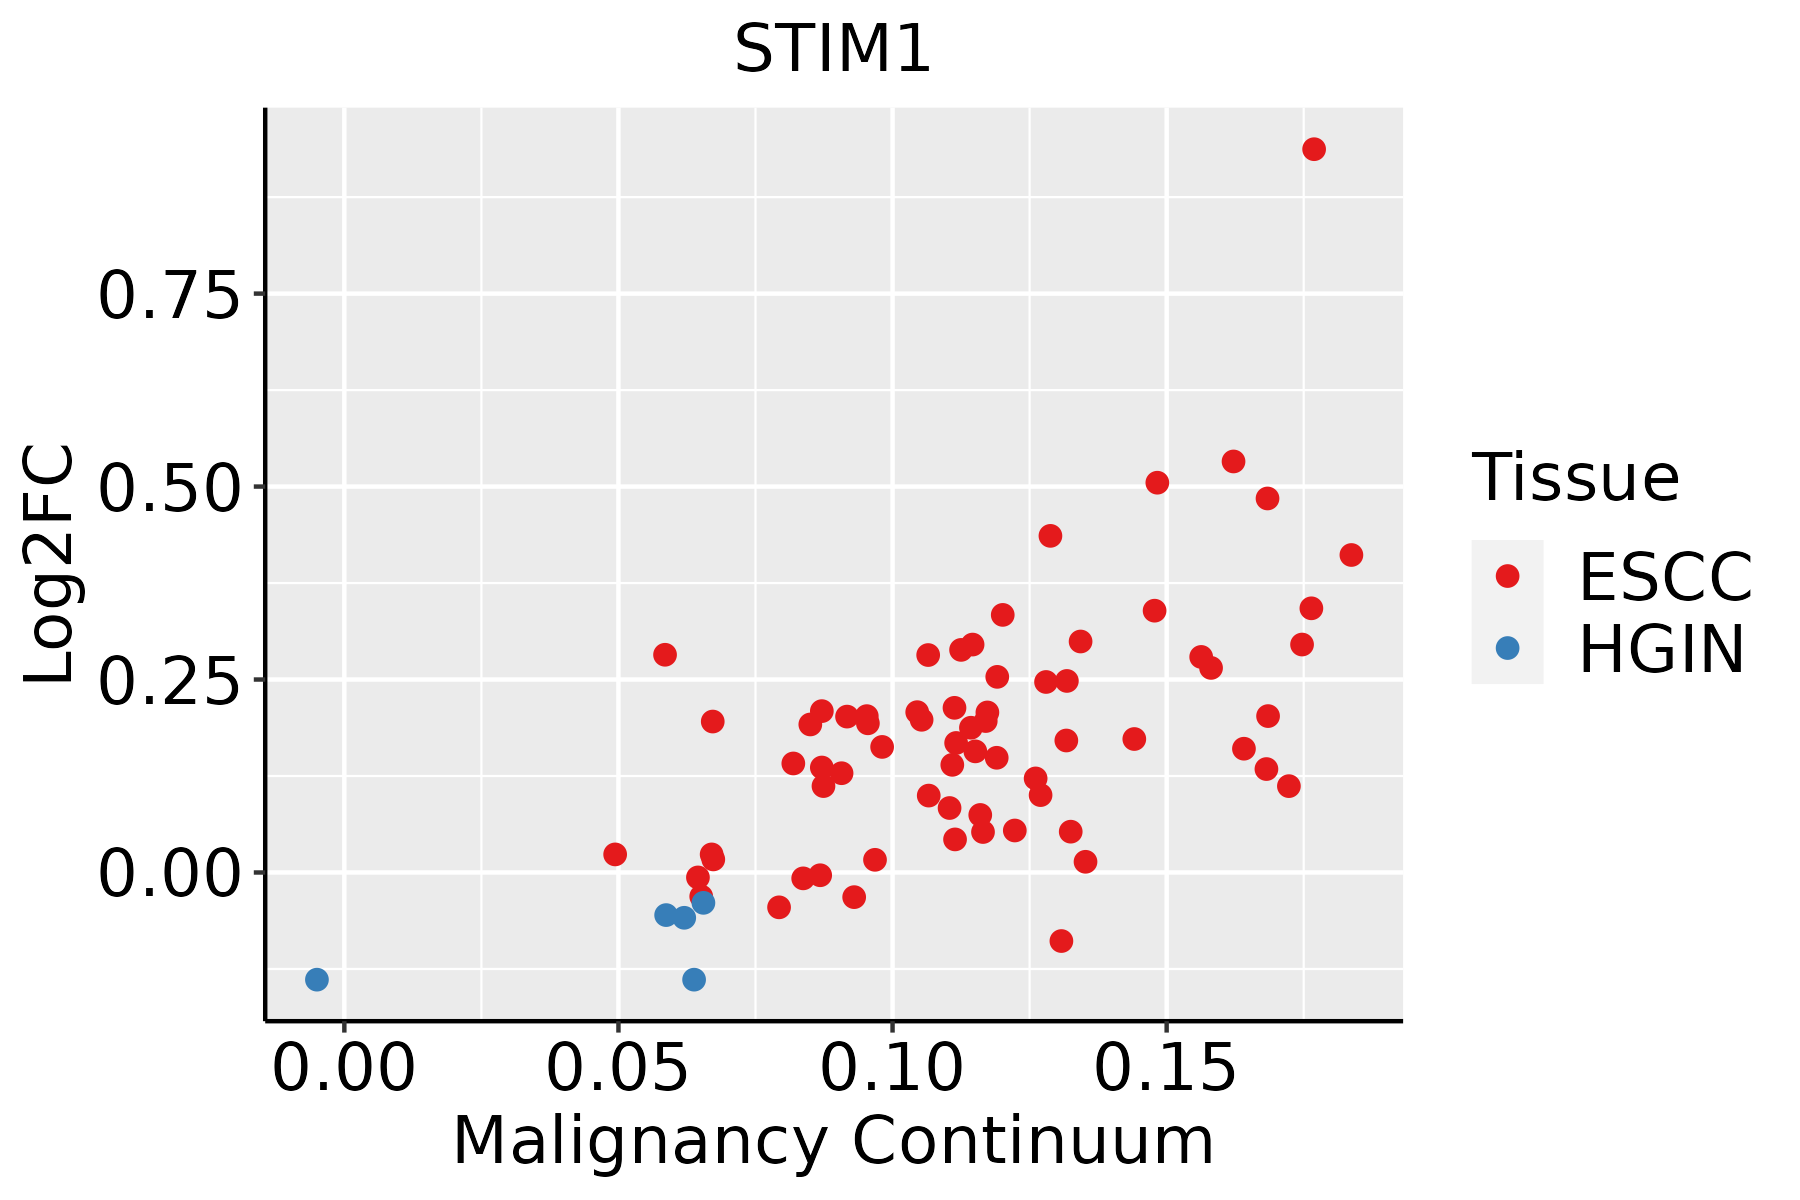 | ESCC: Esophageal squamous cell carcinoma |
| HGIN: High-grade intraepithelial neoplasias | ||
| LGIN: Low-grade intraepithelial neoplasias | ||
| Liver | 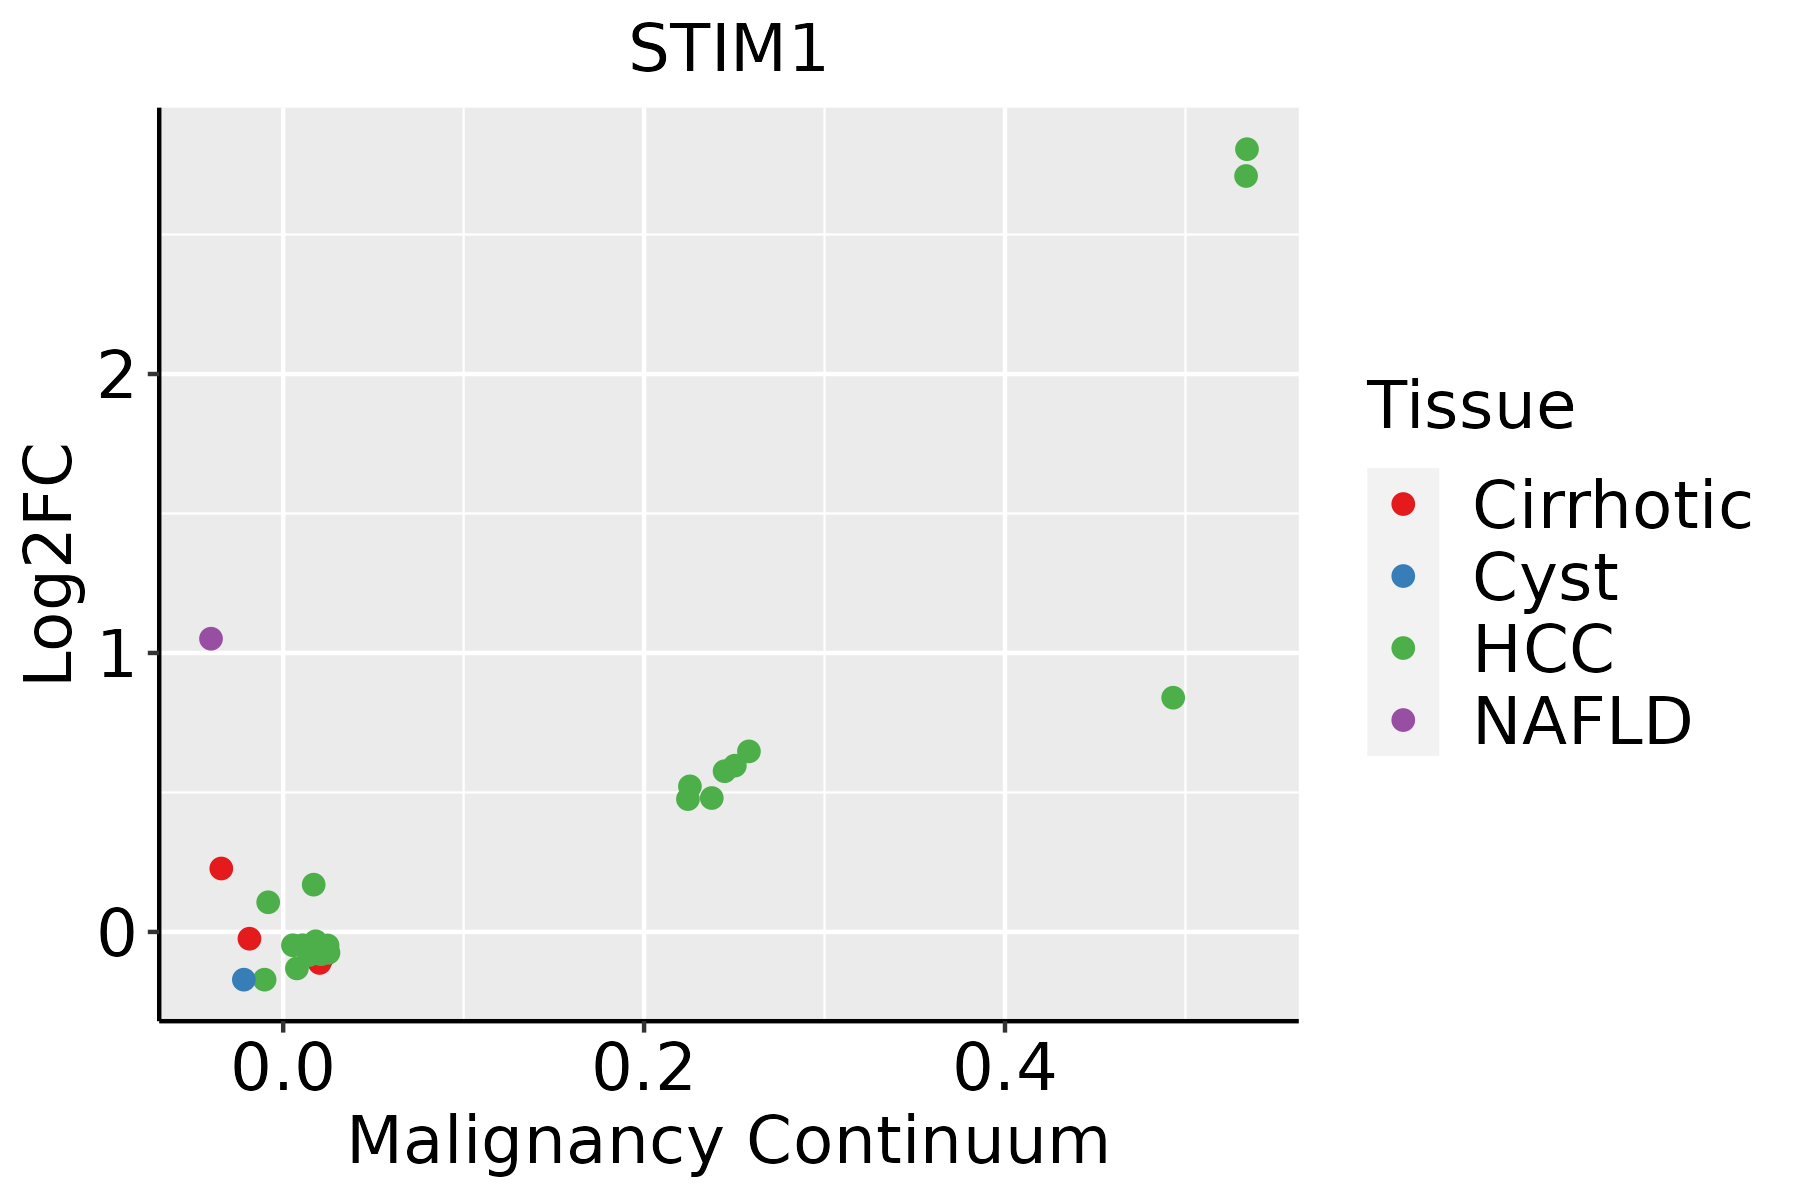 | HCC: Hepatocellular carcinoma |
| NAFLD: Non-alcoholic fatty liver disease | ||
| Oral Cavity | 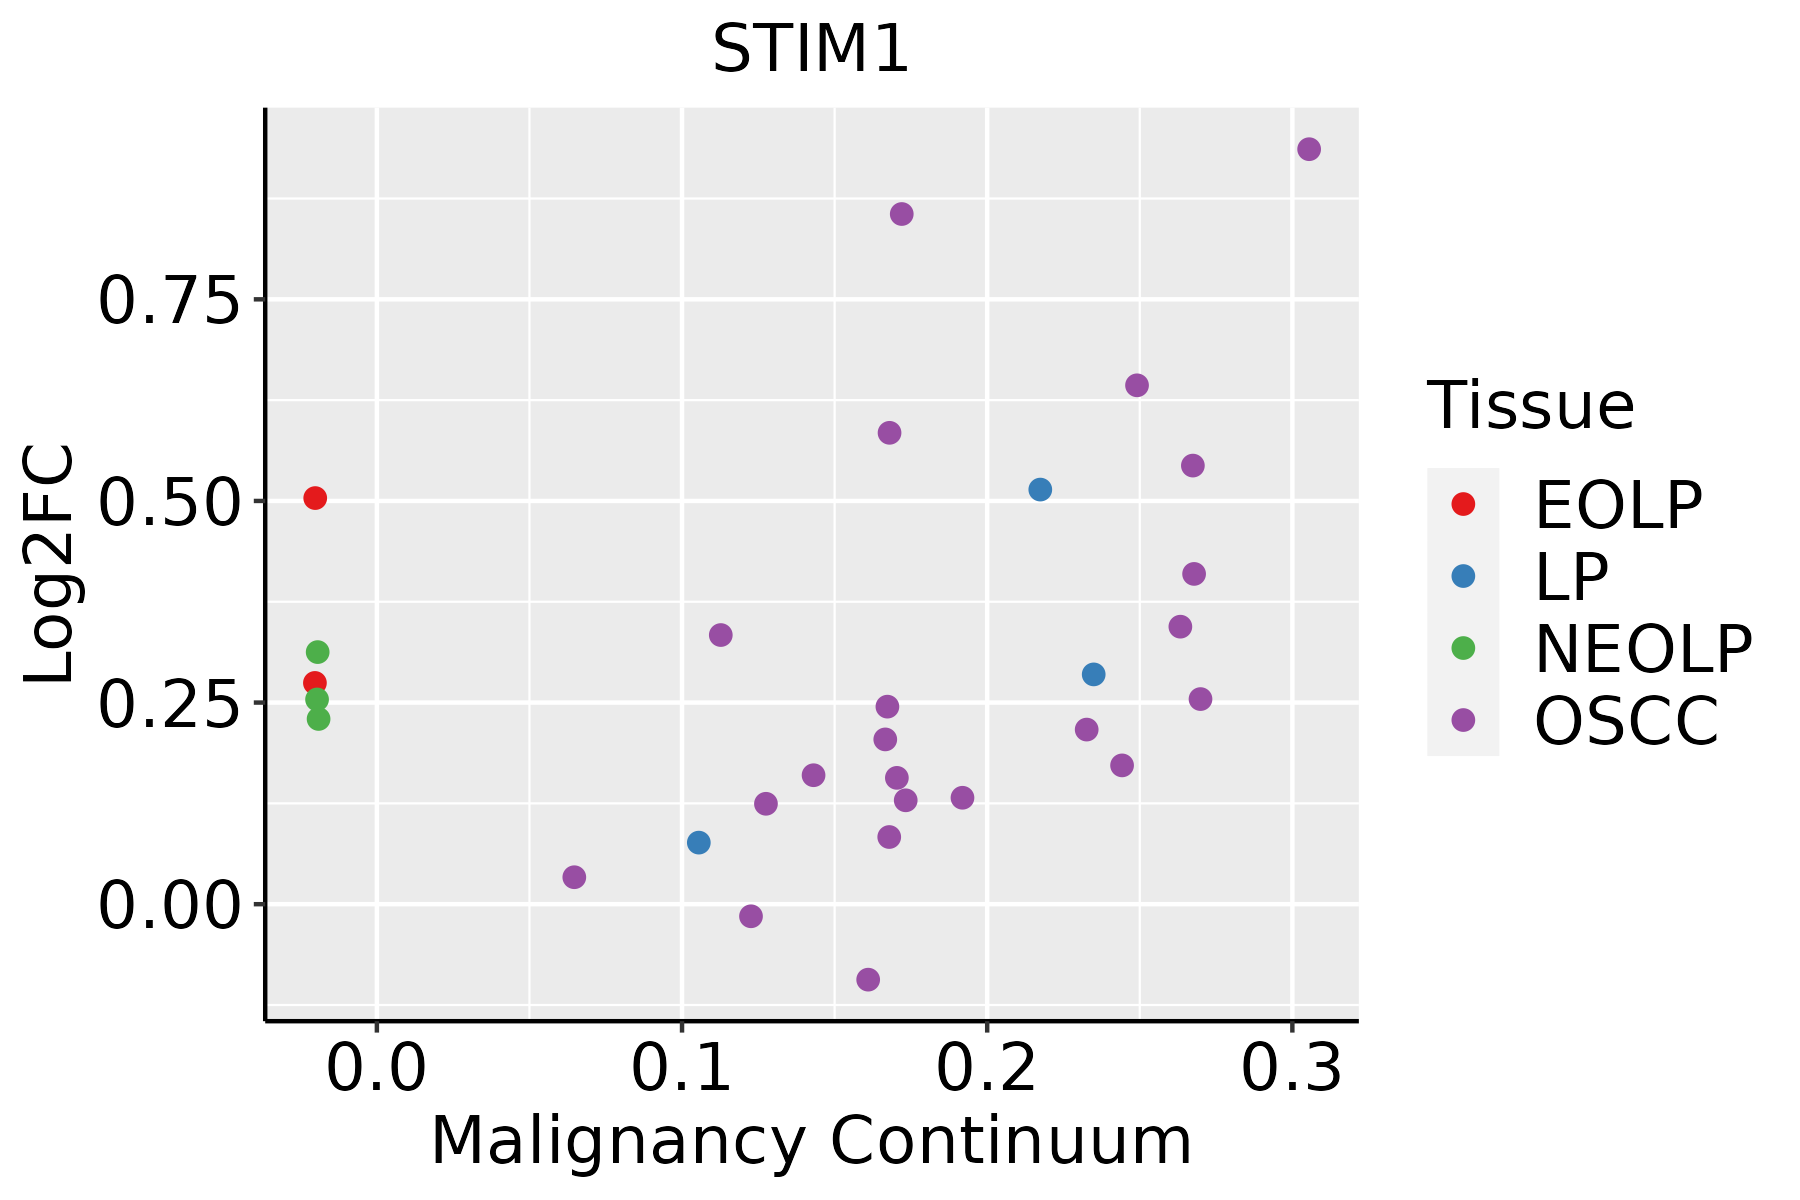 | EOLP: Erosive Oral lichen planus |
| LP: leukoplakia | ||
| NEOLP: Non-erosive oral lichen planus | ||
| OSCC: Oral squamous cell carcinoma |
| ∗log2FC in expression of this searched gene in stem-like cells from each diseased tissue sample relative to stem-like cells in normal samples in each tissue plotted against the malignancy continuum. Samples are colored based on if they are from different disease stage. |
Top |
Malignant transformation related pathway analysis |
| Find out the enriched GO biological processes and KEGG pathways involved in transition from healthy to precancer to cancer |
| Tissue | Disease Stage | Enriched GO biological Processes |
| Colorectum | AD |  |
| Colorectum | SER |  |
| Colorectum | MSS |  |
| Colorectum | MSI-H |  |
| Colorectum | FAP |  |
| ∗Top 15 enriched GO BP terms are showed in the bar plot of each disease state in each tissue. Each row represents a significant GO biological process which is colored according to the -log10(p.adjust). |
| Page: 1 2 3 4 5 6 7 8 9 |
| GO ID | Tissue | Disease Stage | Description | Gene Ratio | Bg Ratio | pvalue | p.adjust | Count |
| GO:0010038 | Colorectum | AD | response to metal ion | 106/3918 | 373/18723 | 3.22e-04 | 3.83e-03 | 106 |
| GO:0032411 | Colorectum | AD | positive regulation of transporter activity | 37/3918 | 120/18723 | 6.82e-03 | 4.22e-02 | 37 |
| GO:00324091 | Colorectum | MSS | regulation of transporter activity | 78/3467 | 310/18723 | 2.09e-03 | 1.78e-02 | 78 |
| GO:0034764 | Colorectum | MSS | positive regulation of transmembrane transport | 58/3467 | 219/18723 | 2.19e-03 | 1.83e-02 | 58 |
| GO:00324112 | Colorectum | MSS | positive regulation of transporter activity | 35/3467 | 120/18723 | 2.95e-03 | 2.28e-02 | 35 |
| GO:0022898 | Colorectum | MSS | regulation of transmembrane transporter activity | 70/3467 | 278/18723 | 3.36e-03 | 2.54e-02 | 70 |
| GO:00100382 | Colorectum | MSS | response to metal ion | 90/3467 | 373/18723 | 3.76e-03 | 2.76e-02 | 90 |
| GO:0051349 | Colorectum | MSS | positive regulation of lyase activity | 10/3467 | 23/18723 | 5.06e-03 | 3.47e-02 | 10 |
| GO:0032412 | Colorectum | MSS | regulation of ion transmembrane transporter activity | 66/3467 | 267/18723 | 6.72e-03 | 4.38e-02 | 66 |
| GO:00347641 | Colorectum | FAP | positive regulation of transmembrane transport | 53/2622 | 219/18723 | 3.54e-05 | 7.75e-04 | 53 |
| GO:00228981 | Colorectum | FAP | regulation of transmembrane transporter activity | 62/2622 | 278/18723 | 1.09e-04 | 1.80e-03 | 62 |
| GO:00324121 | Colorectum | FAP | regulation of ion transmembrane transporter activity | 60/2622 | 267/18723 | 1.12e-04 | 1.84e-03 | 60 |
| GO:00324092 | Colorectum | FAP | regulation of transporter activity | 67/2622 | 310/18723 | 1.59e-04 | 2.43e-03 | 67 |
| GO:0010959 | Colorectum | FAP | regulation of metal ion transport | 83/2622 | 406/18723 | 2.06e-04 | 2.96e-03 | 83 |
| GO:0043270 | Colorectum | FAP | positive regulation of ion transport | 58/2622 | 275/18723 | 7.98e-04 | 8.36e-03 | 58 |
| GO:0032414 | Colorectum | FAP | positive regulation of ion transmembrane transporter activity | 28/2622 | 109/18723 | 8.64e-04 | 8.87e-03 | 28 |
| GO:00324113 | Colorectum | FAP | positive regulation of transporter activity | 29/2622 | 120/18723 | 1.97e-03 | 1.65e-02 | 29 |
| GO:0034767 | Colorectum | FAP | positive regulation of ion transmembrane transport | 37/2622 | 167/18723 | 2.74e-03 | 2.12e-02 | 37 |
| GO:1904062 | Colorectum | FAP | regulation of cation transmembrane transport | 69/2622 | 357/18723 | 3.06e-03 | 2.30e-02 | 69 |
| GO:0051592 | Colorectum | FAP | response to calcium ion | 33/2622 | 149/18723 | 4.52e-03 | 3.08e-02 | 33 |
| Page: 1 2 3 |
| Pathway ID | Tissue | Disease Stage | Description | Gene Ratio | Bg Ratio | pvalue | p.adjust | qvalue | Count |
| hsa04611 | Colorectum | FAP | Platelet activation | 32/1404 | 124/8465 | 5.67e-03 | 2.18e-02 | 1.32e-02 | 32 |
| hsa046111 | Colorectum | FAP | Platelet activation | 32/1404 | 124/8465 | 5.67e-03 | 2.18e-02 | 1.32e-02 | 32 |
| hsa046112 | Liver | HCC | Platelet activation | 71/4020 | 124/8465 | 1.77e-02 | 4.15e-02 | 2.31e-02 | 71 |
| hsa0461111 | Liver | HCC | Platelet activation | 71/4020 | 124/8465 | 1.77e-02 | 4.15e-02 | 2.31e-02 | 71 |
| hsa046116 | Oral cavity | EOLP | Platelet activation | 29/1218 | 124/8465 | 4.73e-03 | 1.48e-02 | 8.75e-03 | 29 |
| hsa0461114 | Oral cavity | EOLP | Platelet activation | 29/1218 | 124/8465 | 4.73e-03 | 1.48e-02 | 8.75e-03 | 29 |
| hsa0461122 | Oral cavity | NEOLP | Platelet activation | 27/1112 | 124/8465 | 5.03e-03 | 1.97e-02 | 1.24e-02 | 27 |
| hsa0461131 | Oral cavity | NEOLP | Platelet activation | 27/1112 | 124/8465 | 5.03e-03 | 1.97e-02 | 1.24e-02 | 27 |
| Page: 1 |
Top |
Cell-cell communication analysis |
| Identification of potential cell-cell interactions between two cell types and their ligand-receptor pairs for different disease states |
| Ligand | Receptor | LRpair | Pathway | Tissue | Disease Stage |
| Page: 1 |
Top |
Single-cell gene regulatory network inference analysis |
| Find out the significant the regulons (TFs) and the target genes of each regulon across cell types for different disease states |
| TF | Cell Type | Tissue | Disease Stage | Target Gene | RSS | Regulon Activity |
| ∗The dot plots of a searched regulon are shown for all cell subpopulations in each disease state of each tissue based on the regulon specific score inferred using pySCENIC and by calculating the average expression. |
| Page: 1 |
Top |
Somatic mutation of malignant transformation related genes |
| Annotation of somatic variants for genes involved in malignant transformation |
| Hugo Symbol | Variant Class | Variant Classification | dbSNP RS | HGVSc | HGVSp | HGVSp Short | SWISSPROT | BIOTYPE | SIFT | PolyPhen | Tumor Sample Barcode | Tissue | Histology | Sex | Age | Stage | Therapy Types | Drugs | Outcome |
| STIM1 | SNV | Missense_Mutation | novel | c.1300N>A | p.Glu434Lys | p.E434K | protein_coding | deleterious(0) | probably_damaging(0.988) | TCGA-AN-A046-01 | Breast | breast invasive carcinoma | Female | >=65 | I/II | Unknown | Unknown | SD | |
| STIM1 | SNV | Missense_Mutation | c.776N>G | p.His259Arg | p.H259R | protein_coding | tolerated(0.35) | possibly_damaging(0.796) | TCGA-AR-A1AQ-01 | Breast | breast invasive carcinoma | Female | <65 | I/II | Chemotherapy | doxorubicin | SD | ||
| STIM1 | SNV | Missense_Mutation | rs202147687 | c.1943G>A | p.Arg648His | p.R648H | protein_coding | tolerated_low_confidence(0.13) | benign(0.011) | TCGA-C8-A138-01 | Breast | breast invasive carcinoma | Female | <65 | III/IV | Unknown | Unknown | SD | |
| STIM1 | insertion | Frame_Shift_Ins | novel | c.355_356insGGCTTCAGCGTAGCCAGGCTTCTTACATTTTGACTCAGGGCCCCTC | p.Asp119GlyfsTer33 | p.D119Gfs*33 | protein_coding | TCGA-AN-A03X-01 | Breast | breast invasive carcinoma | Female | >=65 | I/II | Unknown | Unknown | SD | |||
| STIM1 | insertion | Frame_Shift_Ins | novel | c.955_956insGGAACTC | p.Glu319GlyfsTer40 | p.E319Gfs*40 | protein_coding | TCGA-BH-A0B8-01 | Breast | breast invasive carcinoma | Female | <65 | I/II | Hormone Therapy | arimidex | SD | |||
| STIM1 | insertion | Nonsense_Mutation | novel | c.942_943insTGACTCCATCTTTTGGG | p.Lys315Ter | p.K315* | protein_coding | TCGA-BH-A0BD-01 | Breast | breast invasive carcinoma | Female | <65 | I/II | Chemotherapy | doxorubicin | SD | |||
| STIM1 | deletion | Frame_Shift_Del | novel | c.1032delN | p.Glu345ArgfsTer9 | p.E345Rfs*9 | protein_coding | TCGA-D8-A27V-01 | Breast | breast invasive carcinoma | Female | <65 | I/II | Hormone Therapy | tamoxiphen | SD | |||
| STIM1 | SNV | Missense_Mutation | novel | c.1474T>C | p.Ser492Pro | p.S492P | protein_coding | deleterious(0.02) | possibly_damaging(0.644) | TCGA-AA-3947-01 | Colorectum | colon adenocarcinoma | Female | <65 | I/II | Unknown | Unknown | SD | |
| STIM1 | SNV | Missense_Mutation | c.183G>T | p.Glu61Asp | p.E61D | protein_coding | tolerated(1) | benign(0.044) | TCGA-CA-6718-01 | Colorectum | colon adenocarcinoma | Male | <65 | I/II | Unknown | Unknown | PD | ||
| STIM1 | SNV | Missense_Mutation | rs748049243 | c.1601G>A | p.Arg534His | p.R534H | protein_coding | tolerated_low_confidence(0.33) | unknown(0) | TCGA-CA-6718-01 | Colorectum | colon adenocarcinoma | Male | <65 | I/II | Unknown | Unknown | PD |
| Page: 1 2 3 4 5 6 |
Top |
Related drugs of malignant transformation related genes |
| Identification of chemicals and drugs interact with genes involved in malignant transfromation |
| (DGIdb 4.0) |
| Entrez ID | Symbol | Category | Interaction Types | Drug Claim Name | Drug Name | PMIDs |
| Page: 1 |

Copyright 2023-Present -The University of Texas Health Science Center at Houston |