
|
|||||
|
 | |
| |
| |
| |
| |
| |
|
Gene: STEAP4 |
Gene summary for STEAP4 |
| Gene information | Species | Human | Gene symbol | STEAP4 | Gene ID | 79689 |
| Gene name | STEAP4 metalloreductase | |
| Gene Alias | STAMP2 | |
| Cytomap | 7q21.12 | |
| Gene Type | protein-coding | GO ID | GO:0000041 | UniProtAcc | Q687X5 |
Top |
Malignant transformation analysis |
| Identification of the aberrant gene expression in precancerous and cancerous lesions by comparing the gene expression of stem-like cells in diseased tissues with normal stem cells |
| Entrez ID | Symbol | Replicates | Species | Organ | Tissue | Adj P-value | Log2FC | Malignancy |
| 79689 | STEAP4 | sample1 | Human | Cervix | CC | 9.67e-14 | 5.22e-01 | 0.0959 |
| 79689 | STEAP4 | H2 | Human | Cervix | HSIL_HPV | 1.25e-11 | 4.78e-01 | 0.0632 |
| 79689 | STEAP4 | L1 | Human | Cervix | CC | 2.49e-02 | 3.12e-01 | 0.0802 |
| 79689 | STEAP4 | T1 | Human | Cervix | CC | 6.45e-24 | 5.55e-01 | 0.0918 |
| 79689 | STEAP4 | T2 | Human | Cervix | CC | 7.02e-08 | 5.12e-01 | 0.0709 |
| 79689 | STEAP4 | LZE24T | Human | Esophagus | ESCC | 9.19e-08 | 1.02e+00 | 0.0596 |
| 79689 | STEAP4 | P8T-E | Human | Esophagus | ESCC | 1.25e-08 | 3.76e-01 | 0.0889 |
| 79689 | STEAP4 | P20T-E | Human | Esophagus | ESCC | 3.02e-07 | -9.61e-02 | 0.1124 |
| 79689 | STEAP4 | P24T-E | Human | Esophagus | ESCC | 1.51e-02 | -1.18e-01 | 0.1287 |
| 79689 | STEAP4 | P39T-E | Human | Esophagus | ESCC | 4.98e-05 | 4.73e-01 | 0.0894 |
| 79689 | STEAP4 | P44T-E | Human | Esophagus | ESCC | 1.05e-03 | -6.65e-02 | 0.1096 |
| 79689 | STEAP4 | P57T-E | Human | Esophagus | ESCC | 3.58e-06 | 3.62e-01 | 0.0926 |
| 79689 | STEAP4 | P75T-E | Human | Esophagus | ESCC | 1.03e-07 | 5.53e-01 | 0.1125 |
| 79689 | STEAP4 | P82T-E | Human | Esophagus | ESCC | 8.48e-05 | 1.58e+00 | 0.1072 |
| 79689 | STEAP4 | P127T-E | Human | Esophagus | ESCC | 3.03e-03 | 5.75e-01 | 0.0826 |
| 79689 | STEAP4 | P5_S10_cSCC | Human | Skin | cSCC | 2.62e-02 | 1.92e-01 | -0.299 |
| 79689 | STEAP4 | P1_cSCC | Human | Skin | cSCC | 2.64e-06 | 5.26e-01 | 0.0292 |
| 79689 | STEAP4 | P4_cSCC | Human | Skin | cSCC | 5.49e-06 | 2.63e-01 | -0.00290000000000005 |
| 79689 | STEAP4 | P10_cSCC | Human | Skin | cSCC | 1.18e-02 | 2.46e-01 | 0.1017 |
| 79689 | STEAP4 | male-WTA | Human | Thyroid | PTC | 2.22e-08 | 1.72e-01 | 0.1037 |
| Page: 1 2 |
| Tissue | Expression Dynamics | Abbreviation |
| Cervix |  | CC: Cervix cancer |
| HSIL_HPV: HPV-infected high-grade squamous intraepithelial lesions | ||
| N_HPV: HPV-infected normal cervix | ||
| Esophagus |  | ESCC: Esophageal squamous cell carcinoma |
| HGIN: High-grade intraepithelial neoplasias | ||
| LGIN: Low-grade intraepithelial neoplasias | ||
| Prostate |  | BPH: Benign Prostatic Hyperplasia |
| Skin |  | AK: Actinic keratosis |
| cSCC: Cutaneous squamous cell carcinoma | ||
| SCCIS:squamous cell carcinoma in situ | ||
| Thyroid | 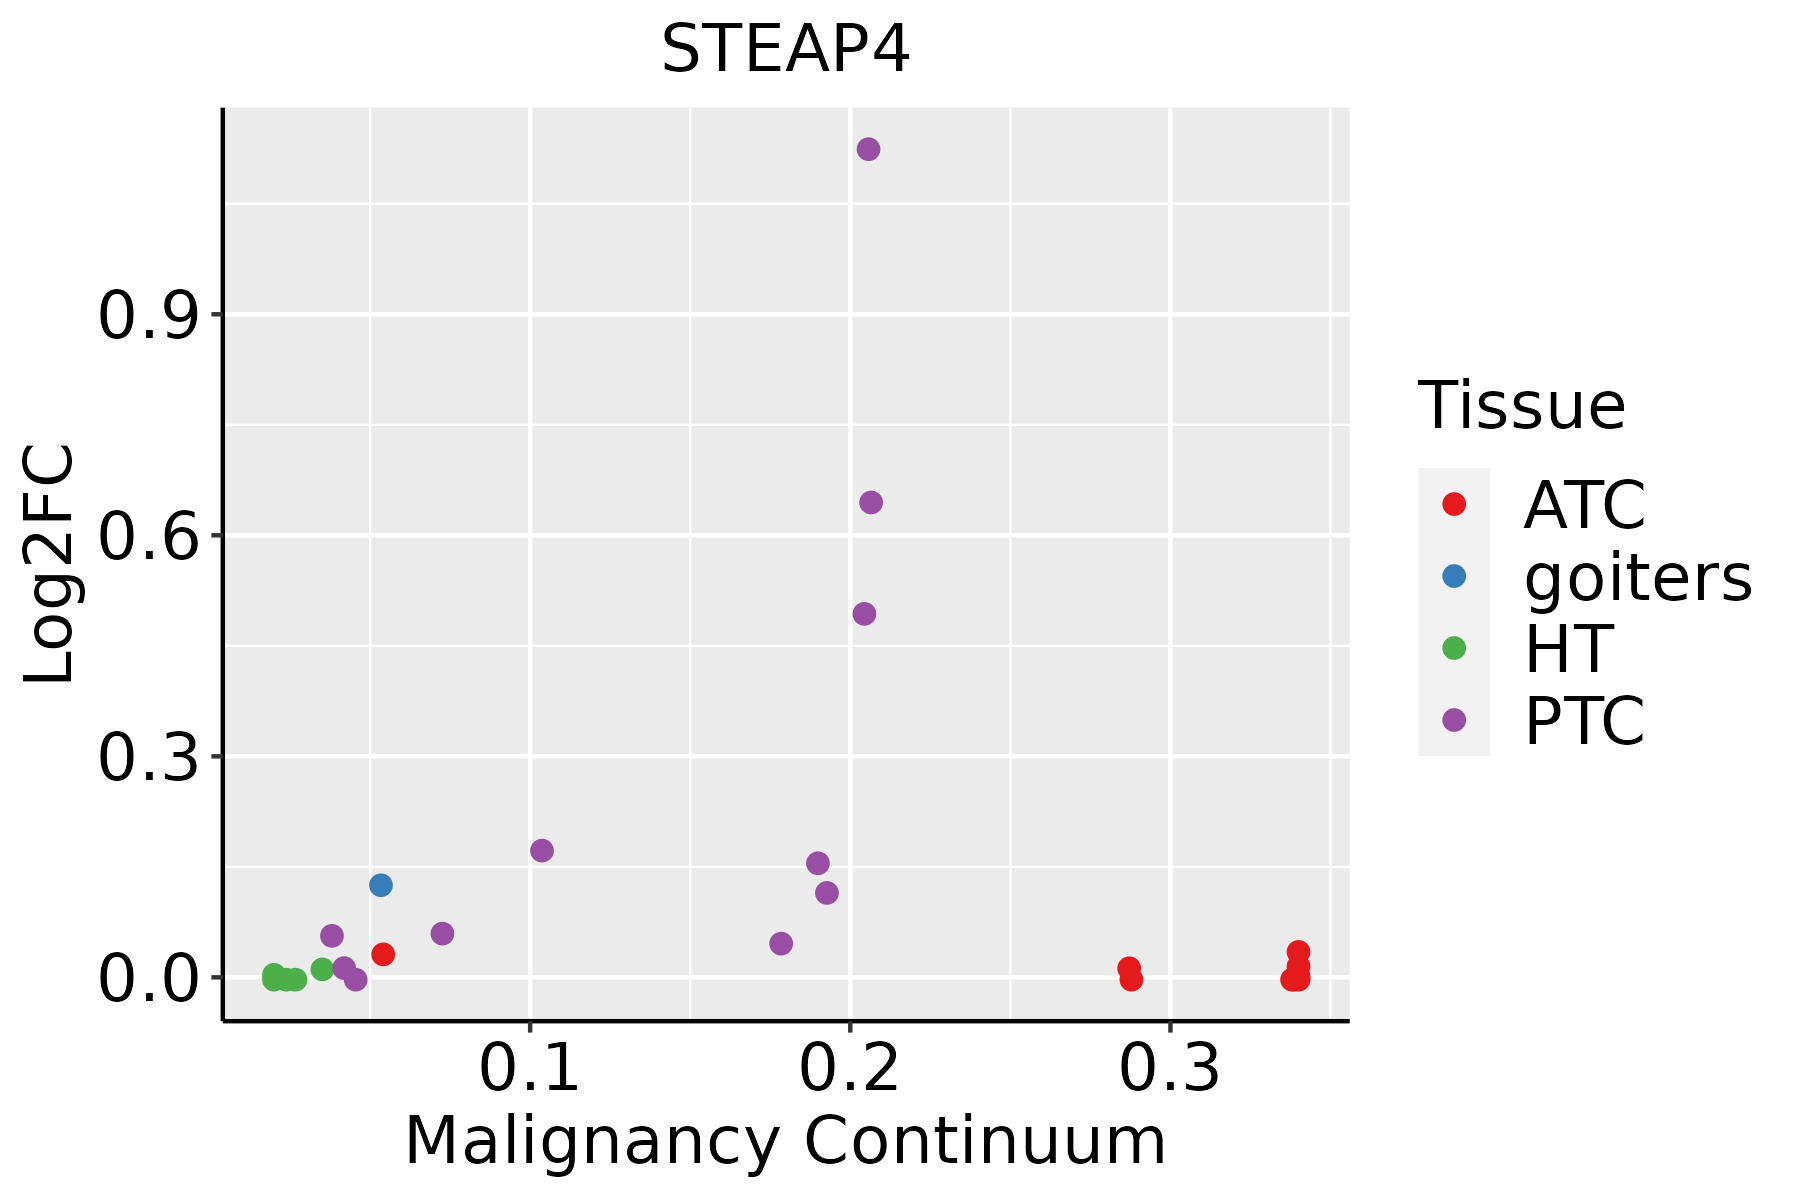 | ATC: Anaplastic thyroid cancer |
| HT: Hashimoto's thyroiditis | ||
| PTC: Papillary thyroid cancer |
| ∗log2FC in expression of this searched gene in stem-like cells from each diseased tissue sample relative to stem-like cells in normal samples in each tissue plotted against the malignancy continuum. Samples are colored based on if they are from different disease stage. |
Top |
Malignant transformation related pathway analysis |
| Find out the enriched GO biological processes and KEGG pathways involved in transition from healthy to precancer to cancer |
| Tissue | Disease Stage | Enriched GO biological Processes |
| Colorectum | AD |  |
| Colorectum | SER |  |
| Colorectum | MSS |  |
| Colorectum | MSI-H |  |
| Colorectum | FAP |  |
| ∗Top 15 enriched GO BP terms are showed in the bar plot of each disease state in each tissue. Each row represents a significant GO biological process which is colored according to the -log10(p.adjust). |
| Page: 1 2 3 4 5 6 7 8 9 |
| GO ID | Tissue | Disease Stage | Description | Gene Ratio | Bg Ratio | pvalue | p.adjust | Count |
| GO:00229009 | Cervix | CC | electron transport chain | 53/2311 | 175/18723 | 2.23e-10 | 3.43e-08 | 53 |
| GO:00060919 | Cervix | CC | generation of precursor metabolites and energy | 105/2311 | 490/18723 | 7.40e-09 | 6.61e-07 | 105 |
| GO:00454445 | Cervix | CC | fat cell differentiation | 53/2311 | 229/18723 | 3.72e-06 | 9.75e-05 | 53 |
| GO:0070206 | Cervix | CC | protein trimerization | 7/2311 | 17/18723 | 2.72e-03 | 1.85e-02 | 7 |
| GO:00550726 | Cervix | CC | iron ion homeostasis | 19/2311 | 85/18723 | 6.88e-03 | 3.74e-02 | 19 |
| GO:00550768 | Cervix | CC | transition metal ion homeostasis | 27/2311 | 138/18723 | 9.89e-03 | 4.85e-02 | 27 |
| GO:002290014 | Cervix | HSIL_HPV | electron transport chain | 18/737 | 175/18723 | 1.93e-04 | 3.56e-03 | 18 |
| GO:00702061 | Cervix | HSIL_HPV | protein trimerization | 5/737 | 17/18723 | 3.89e-04 | 6.04e-03 | 5 |
| GO:00469166 | Cervix | HSIL_HPV | cellular transition metal ion homeostasis | 13/737 | 115/18723 | 5.95e-04 | 8.37e-03 | 13 |
| GO:005507614 | Cervix | HSIL_HPV | transition metal ion homeostasis | 14/737 | 138/18723 | 1.10e-03 | 1.36e-02 | 14 |
| GO:000609114 | Cervix | HSIL_HPV | generation of precursor metabolites and energy | 32/737 | 490/18723 | 3.69e-03 | 3.27e-02 | 32 |
| GO:004544413 | Cervix | HSIL_HPV | fat cell differentiation | 18/737 | 229/18723 | 4.27e-03 | 3.64e-02 | 18 |
| GO:0006091110 | Esophagus | ESCC | generation of precursor metabolites and energy | 331/8552 | 490/18723 | 3.86e-23 | 8.45e-21 | 331 |
| GO:0022900110 | Esophagus | ESCC | electron transport chain | 133/8552 | 175/18723 | 2.18e-16 | 1.67e-14 | 133 |
| GO:005507617 | Esophagus | ESCC | transition metal ion homeostasis | 87/8552 | 138/18723 | 2.85e-05 | 2.37e-04 | 87 |
| GO:00454449 | Esophagus | ESCC | fat cell differentiation | 135/8552 | 229/18723 | 3.38e-05 | 2.78e-04 | 135 |
| GO:00469169 | Esophagus | ESCC | cellular transition metal ion homeostasis | 70/8552 | 115/18723 | 7.28e-04 | 3.79e-03 | 70 |
| GO:00550729 | Esophagus | ESCC | iron ion homeostasis | 52/8552 | 85/18723 | 2.86e-03 | 1.21e-02 | 52 |
| GO:00512592 | Esophagus | ESCC | protein complex oligomerization | 130/8552 | 238/18723 | 3.29e-03 | 1.36e-02 | 130 |
| GO:000609116 | Prostate | BPH | generation of precursor metabolites and energy | 161/3107 | 490/18723 | 3.05e-19 | 1.45e-16 | 161 |
| Page: 1 2 3 |
| Pathway ID | Tissue | Disease Stage | Description | Gene Ratio | Bg Ratio | pvalue | p.adjust | qvalue | Count |
| Page: 1 |
Top |
Cell-cell communication analysis |
| Identification of potential cell-cell interactions between two cell types and their ligand-receptor pairs for different disease states |
| Ligand | Receptor | LRpair | Pathway | Tissue | Disease Stage |
| Page: 1 |
Top |
Single-cell gene regulatory network inference analysis |
| Find out the significant the regulons (TFs) and the target genes of each regulon across cell types for different disease states |
| TF | Cell Type | Tissue | Disease Stage | Target Gene | RSS | Regulon Activity |
| ∗The dot plots of a searched regulon are shown for all cell subpopulations in each disease state of each tissue based on the regulon specific score inferred using pySCENIC and by calculating the average expression. |
| Page: 1 |
Top |
Somatic mutation of malignant transformation related genes |
| Annotation of somatic variants for genes involved in malignant transformation |
| Hugo Symbol | Variant Class | Variant Classification | dbSNP RS | HGVSc | HGVSp | HGVSp Short | SWISSPROT | BIOTYPE | SIFT | PolyPhen | Tumor Sample Barcode | Tissue | Histology | Sex | Age | Stage | Therapy Types | Drugs | Outcome |
| STEAP4 | SNV | Missense_Mutation | rs758443467 | c.734G>A | p.Arg245His | p.R245H | Q687X5 | protein_coding | tolerated(0.14) | benign(0.003) | TCGA-2W-A8YY-01 | Cervix | cervical & endocervical cancer | Female | <65 | I/II | Chemotherapy | cisplatin | CR |
| STEAP4 | SNV | Missense_Mutation | novel | c.445G>A | p.Ala149Thr | p.A149T | Q687X5 | protein_coding | deleterious(0.02) | possibly_damaging(0.666) | TCGA-2W-A8YY-01 | Cervix | cervical & endocervical cancer | Female | <65 | I/II | Chemotherapy | cisplatin | CR |
| STEAP4 | SNV | Missense_Mutation | rs749073411 | c.833N>A | p.Arg278Gln | p.R278Q | Q687X5 | protein_coding | deleterious(0.03) | possibly_damaging(0.527) | TCGA-FU-A3HY-01 | Cervix | cervical & endocervical cancer | Female | <65 | I/II | Chemotherapy | cisplatin | CR |
| STEAP4 | SNV | Missense_Mutation | c.305N>C | p.Val102Ala | p.V102A | Q687X5 | protein_coding | deleterious(0) | possibly_damaging(0.887) | TCGA-A6-3809-01 | Colorectum | colon adenocarcinoma | Female | >=65 | I/II | Unknown | Unknown | SD | |
| STEAP4 | SNV | Missense_Mutation | novel | c.644N>C | p.Phe215Ser | p.F215S | Q687X5 | protein_coding | deleterious(0) | possibly_damaging(0.827) | TCGA-AA-3864-01 | Colorectum | colon adenocarcinoma | Male | >=65 | I/II | Unknown | Unknown | SD |
| STEAP4 | SNV | Missense_Mutation | novel | c.539A>G | p.Gln180Arg | p.Q180R | Q687X5 | protein_coding | tolerated(0.87) | benign(0) | TCGA-AA-3950-01 | Colorectum | colon adenocarcinoma | Female | >=65 | I/II | Unknown | Unknown | SD |
| STEAP4 | SNV | Missense_Mutation | c.911A>G | p.His304Arg | p.H304R | Q687X5 | protein_coding | deleterious(0) | probably_damaging(1) | TCGA-AD-6889-01 | Colorectum | colon adenocarcinoma | Male | >=65 | I/II | Chemotherapy | xeloda | PD | |
| STEAP4 | SNV | Missense_Mutation | rs368689133 | c.941N>A | p.Arg314Gln | p.R314Q | Q687X5 | protein_coding | deleterious(0) | probably_damaging(1) | TCGA-AZ-4315-01 | Colorectum | colon adenocarcinoma | Male | <65 | I/II | Unknown | Unknown | SD |
| STEAP4 | SNV | Missense_Mutation | rs769390918 | c.709N>T | p.Arg237Cys | p.R237C | Q687X5 | protein_coding | tolerated(0.07) | possibly_damaging(0.855) | TCGA-AZ-4315-01 | Colorectum | colon adenocarcinoma | Male | <65 | I/II | Unknown | Unknown | SD |
| STEAP4 | SNV | Missense_Mutation | rs750091751 | c.149N>A | p.Arg50Gln | p.R50Q | Q687X5 | protein_coding | deleterious(0) | probably_damaging(1) | TCGA-D5-6927-01 | Colorectum | colon adenocarcinoma | Male | <65 | I/II | Unknown | Unknown | SD |
| Page: 1 2 3 4 5 6 7 8 |
Top |
Related drugs of malignant transformation related genes |
| Identification of chemicals and drugs interact with genes involved in malignant transfromation |
| (DGIdb 4.0) |
| Entrez ID | Symbol | Category | Interaction Types | Drug Claim Name | Drug Name | PMIDs |
| Page: 1 |

Copyright 2023-Present -The University of Texas Health Science Center at Houston |