
|
|||||
|
 | |
| |
| |
| |
| |
| |
|
Gene: STEAP3 |
Gene summary for STEAP3 |
| Gene information | Species | Human | Gene symbol | STEAP3 | Gene ID | 55240 |
| Gene name | STEAP3 metalloreductase | |
| Gene Alias | AHMIO2 | |
| Cytomap | 2q14.2 | |
| Gene Type | protein-coding | GO ID | GO:0000041 | UniProtAcc | A0A024RAD7 |
Top |
Malignant transformation analysis |
| Identification of the aberrant gene expression in precancerous and cancerous lesions by comparing the gene expression of stem-like cells in diseased tissues with normal stem cells |
| Entrez ID | Symbol | Replicates | Species | Organ | Tissue | Adj P-value | Log2FC | Malignancy |
| 55240 | STEAP3 | LZE4T | Human | Esophagus | ESCC | 2.14e-03 | 1.71e-01 | 0.0811 |
| 55240 | STEAP3 | LZE8T | Human | Esophagus | ESCC | 9.19e-04 | 1.46e-01 | 0.067 |
| 55240 | STEAP3 | LZE24T | Human | Esophagus | ESCC | 5.81e-07 | 2.96e-01 | 0.0596 |
| 55240 | STEAP3 | P1T-E | Human | Esophagus | ESCC | 1.04e-06 | 3.44e-01 | 0.0875 |
| 55240 | STEAP3 | P2T-E | Human | Esophagus | ESCC | 1.56e-08 | 1.97e-01 | 0.1177 |
| 55240 | STEAP3 | P4T-E | Human | Esophagus | ESCC | 2.27e-09 | 2.76e-01 | 0.1323 |
| 55240 | STEAP3 | P5T-E | Human | Esophagus | ESCC | 4.69e-15 | 3.07e-01 | 0.1327 |
| 55240 | STEAP3 | P8T-E | Human | Esophagus | ESCC | 2.19e-07 | 1.36e-01 | 0.0889 |
| 55240 | STEAP3 | P9T-E | Human | Esophagus | ESCC | 1.06e-03 | 1.34e-01 | 0.1131 |
| 55240 | STEAP3 | P10T-E | Human | Esophagus | ESCC | 2.74e-03 | 1.03e-01 | 0.116 |
| 55240 | STEAP3 | P11T-E | Human | Esophagus | ESCC | 3.43e-06 | 4.69e-01 | 0.1426 |
| 55240 | STEAP3 | P12T-E | Human | Esophagus | ESCC | 2.90e-08 | 2.83e-01 | 0.1122 |
| 55240 | STEAP3 | P15T-E | Human | Esophagus | ESCC | 5.25e-11 | 3.20e-01 | 0.1149 |
| 55240 | STEAP3 | P16T-E | Human | Esophagus | ESCC | 3.03e-06 | 5.52e-02 | 0.1153 |
| 55240 | STEAP3 | P20T-E | Human | Esophagus | ESCC | 7.95e-14 | 3.53e-01 | 0.1124 |
| 55240 | STEAP3 | P21T-E | Human | Esophagus | ESCC | 3.41e-22 | 5.66e-01 | 0.1617 |
| 55240 | STEAP3 | P22T-E | Human | Esophagus | ESCC | 1.15e-06 | 2.08e-01 | 0.1236 |
| 55240 | STEAP3 | P23T-E | Human | Esophagus | ESCC | 1.31e-20 | 5.61e-01 | 0.108 |
| 55240 | STEAP3 | P24T-E | Human | Esophagus | ESCC | 9.52e-15 | 3.59e-01 | 0.1287 |
| 55240 | STEAP3 | P26T-E | Human | Esophagus | ESCC | 5.31e-13 | 2.64e-01 | 0.1276 |
| Page: 1 2 3 4 5 |
| Tissue | Expression Dynamics | Abbreviation |
| Esophagus | 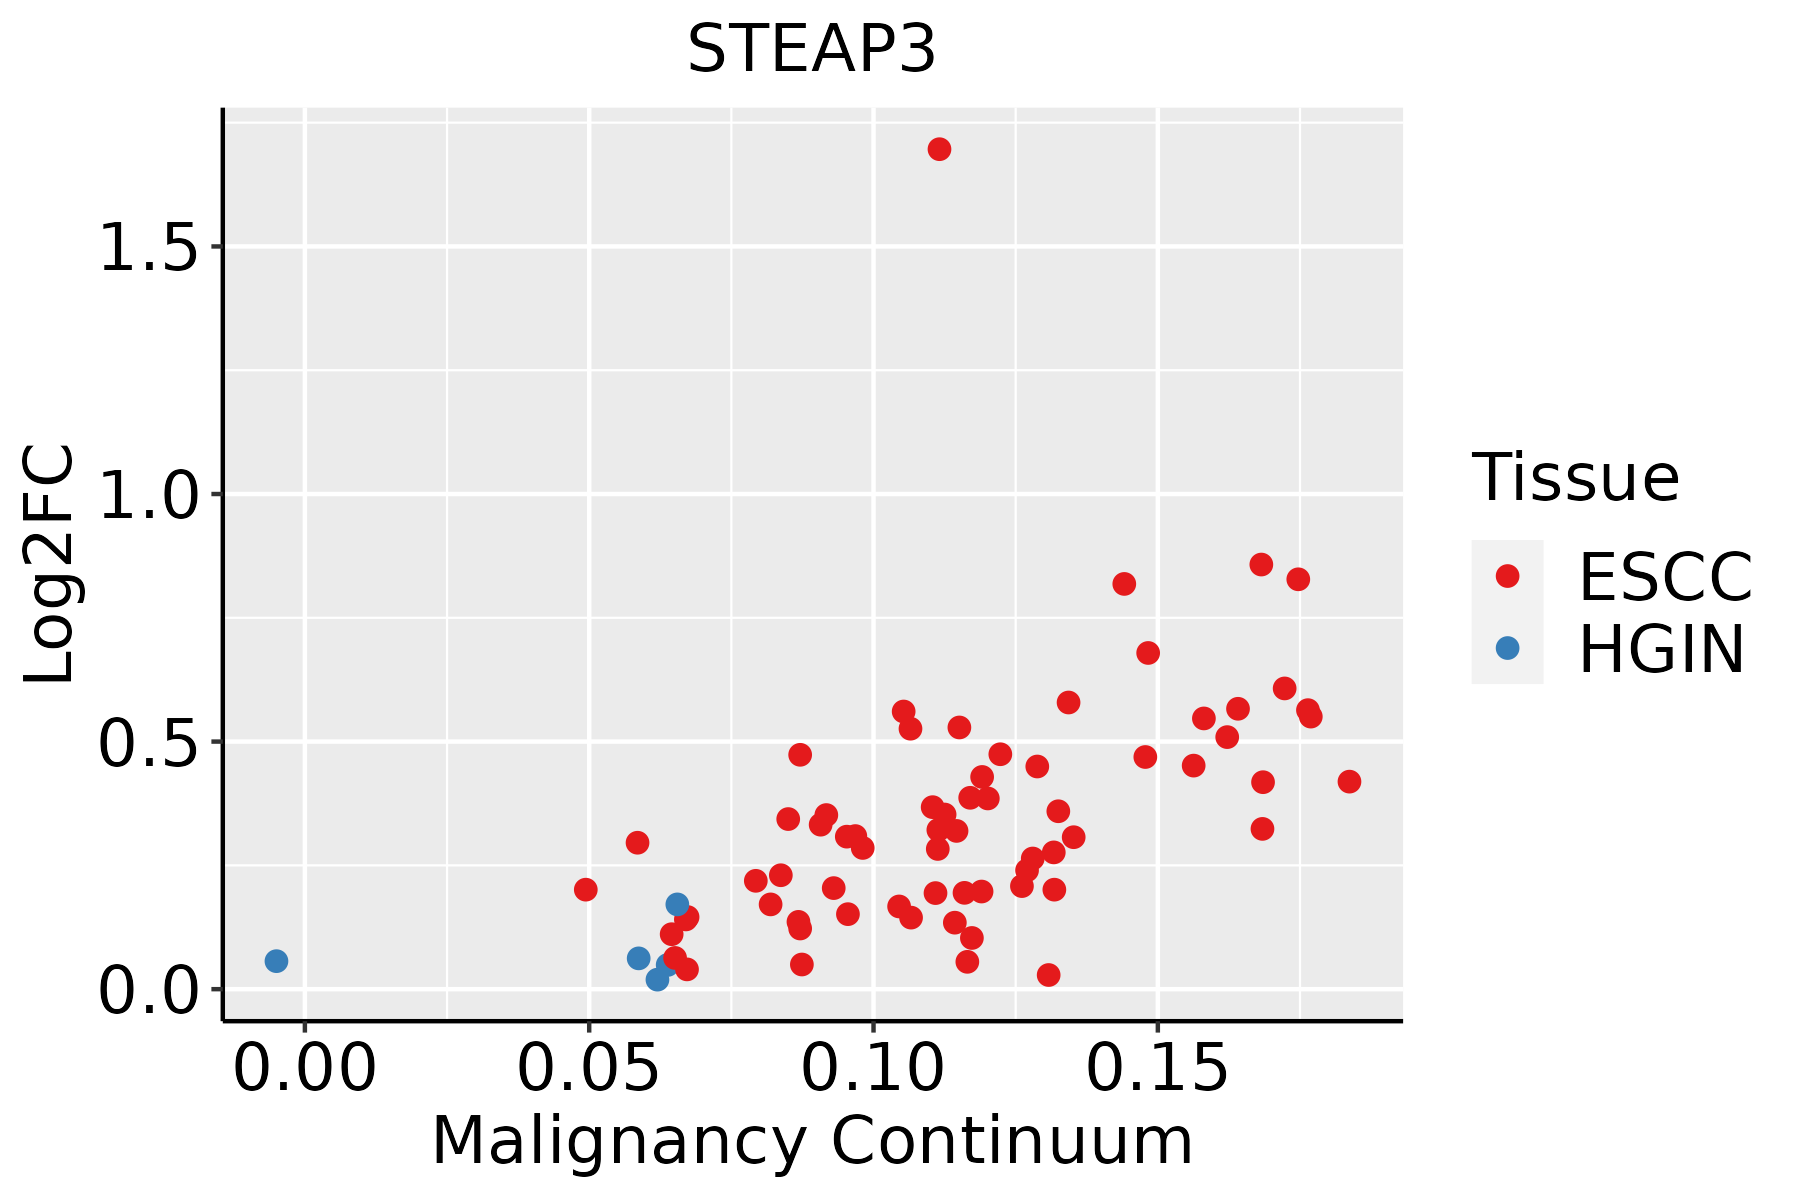 | ESCC: Esophageal squamous cell carcinoma |
| HGIN: High-grade intraepithelial neoplasias | ||
| LGIN: Low-grade intraepithelial neoplasias | ||
| Liver | 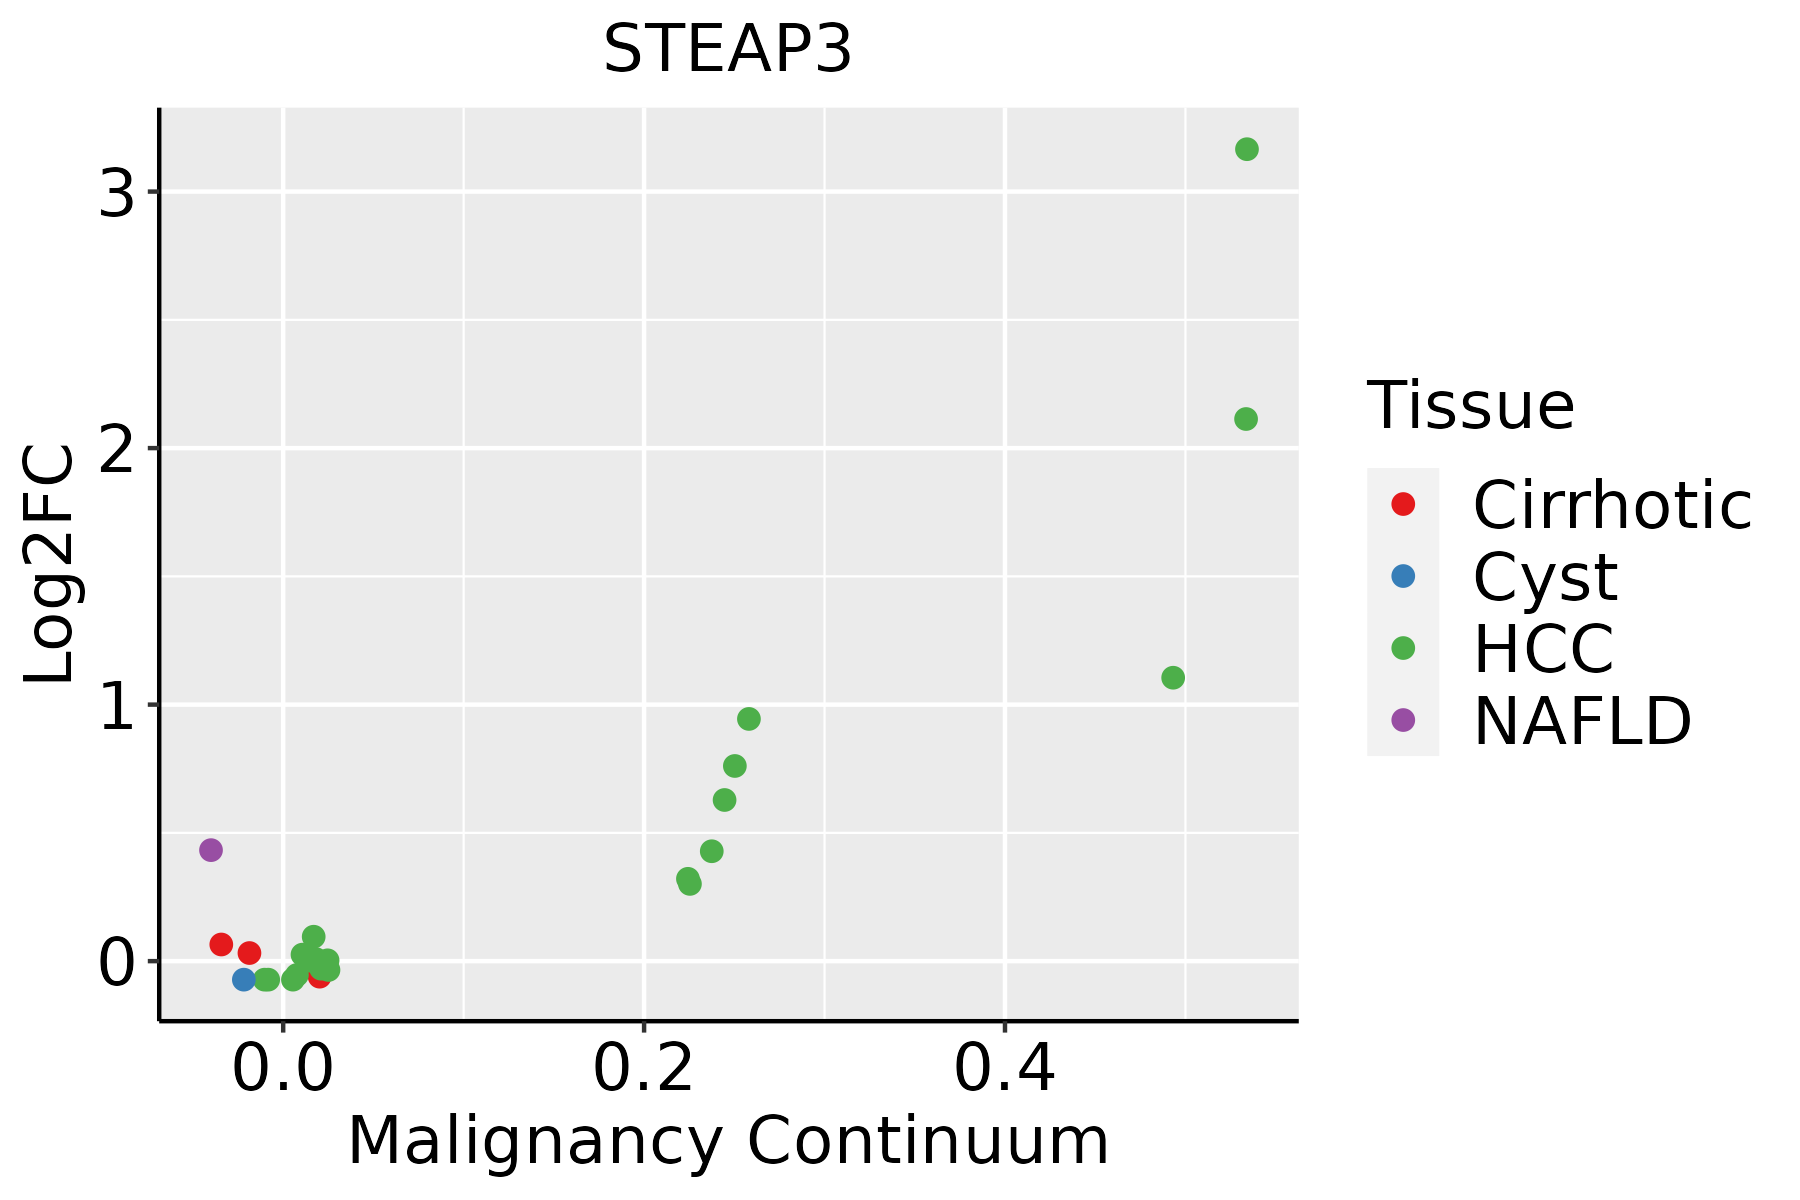 | HCC: Hepatocellular carcinoma |
| NAFLD: Non-alcoholic fatty liver disease | ||
| Oral Cavity | 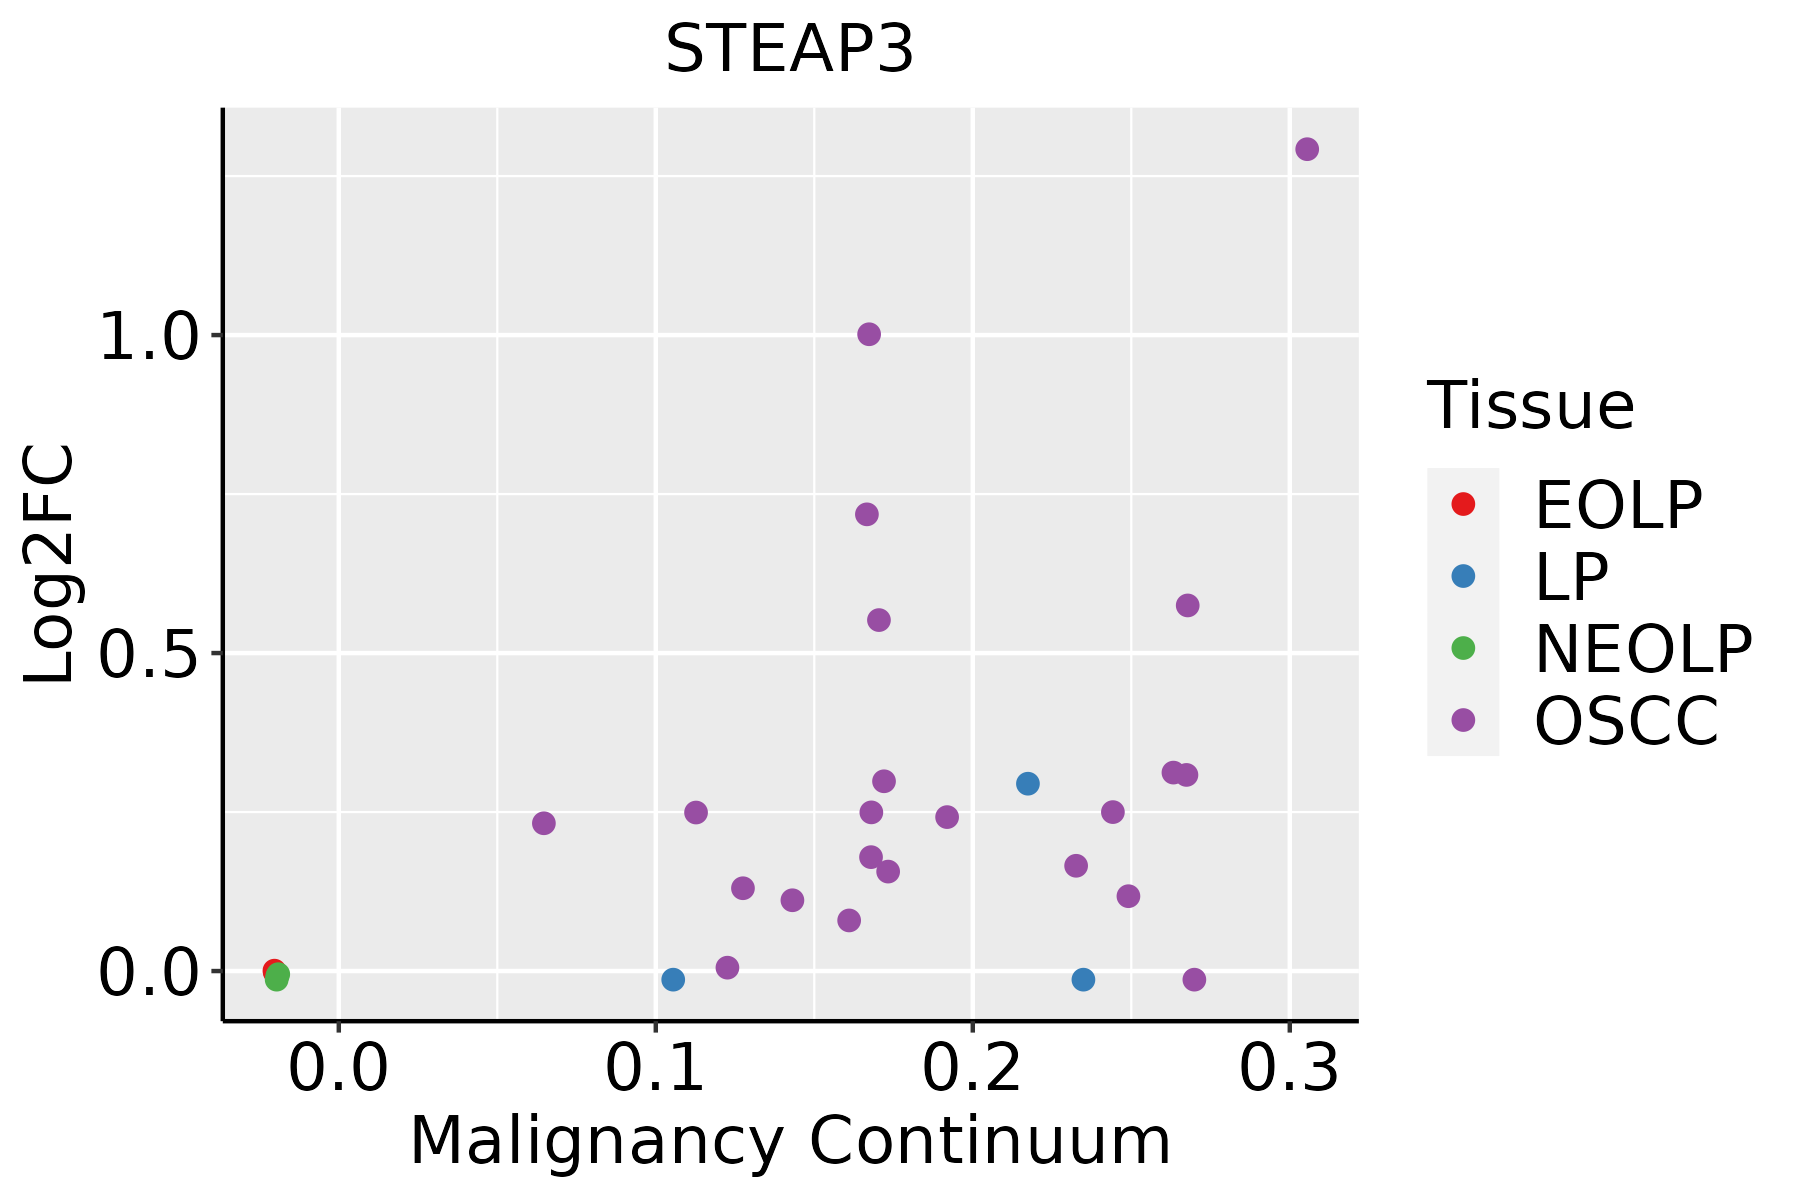 | EOLP: Erosive Oral lichen planus |
| LP: leukoplakia | ||
| NEOLP: Non-erosive oral lichen planus | ||
| OSCC: Oral squamous cell carcinoma | ||
| Thyroid |  | ATC: Anaplastic thyroid cancer |
| HT: Hashimoto's thyroiditis | ||
| PTC: Papillary thyroid cancer |
| ∗log2FC in expression of this searched gene in stem-like cells from each diseased tissue sample relative to stem-like cells in normal samples in each tissue plotted against the malignancy continuum. Samples are colored based on if they are from different disease stage. |
Top |
Malignant transformation related pathway analysis |
| Find out the enriched GO biological processes and KEGG pathways involved in transition from healthy to precancer to cancer |
| Tissue | Disease Stage | Enriched GO biological Processes |
| Colorectum | AD |  |
| Colorectum | SER |  |
| Colorectum | MSS |  |
| Colorectum | MSI-H |  |
| Colorectum | FAP |  |
| ∗Top 15 enriched GO BP terms are showed in the bar plot of each disease state in each tissue. Each row represents a significant GO biological process which is colored according to the -log10(p.adjust). |
| Page: 1 2 3 4 5 6 7 8 9 |
| GO ID | Tissue | Disease Stage | Description | Gene Ratio | Bg Ratio | pvalue | p.adjust | Count |
| GO:005507617 | Esophagus | ESCC | transition metal ion homeostasis | 87/8552 | 138/18723 | 2.85e-05 | 2.37e-04 | 87 |
| GO:00550729 | Esophagus | ESCC | iron ion homeostasis | 52/8552 | 85/18723 | 2.86e-03 | 1.21e-02 | 52 |
| GO:000930617 | Esophagus | ESCC | protein secretion | 190/8552 | 359/18723 | 3.22e-03 | 1.34e-02 | 190 |
| GO:003559217 | Esophagus | ESCC | establishment of protein localization to extracellular region | 190/8552 | 360/18723 | 3.77e-03 | 1.53e-02 | 190 |
| GO:007169210 | Esophagus | ESCC | protein localization to extracellular region | 193/8552 | 368/18723 | 5.01e-03 | 1.92e-02 | 193 |
| GO:00335723 | Liver | NAFLD | transferrin transport | 5/1882 | 10/18723 | 1.67e-03 | 1.74e-02 | 5 |
| GO:00068262 | Liver | NAFLD | iron ion transport | 13/1882 | 58/18723 | 4.32e-03 | 3.55e-02 | 13 |
| GO:00355926 | Liver | NAFLD | establishment of protein localization to extracellular region | 52/1882 | 360/18723 | 4.80e-03 | 3.81e-02 | 52 |
| GO:00093066 | Liver | NAFLD | protein secretion | 51/1882 | 359/18723 | 7.17e-03 | 4.96e-02 | 51 |
| GO:005507612 | Liver | HCC | transition metal ion homeostasis | 81/7958 | 138/18723 | 8.87e-05 | 7.72e-04 | 81 |
| GO:003357211 | Liver | HCC | transferrin transport | 9/7958 | 10/18723 | 2.79e-03 | 1.31e-02 | 9 |
| GO:00000411 | Liver | HCC | transition metal ion transport | 59/7958 | 105/18723 | 3.18e-03 | 1.47e-02 | 59 |
| GO:003559212 | Liver | HCC | establishment of protein localization to extracellular region | 176/7958 | 360/18723 | 7.96e-03 | 3.15e-02 | 176 |
| GO:000930612 | Liver | HCC | protein secretion | 175/7958 | 359/18723 | 9.32e-03 | 3.57e-02 | 175 |
| GO:00068261 | Liver | HCC | iron ion transport | 34/7958 | 58/18723 | 9.66e-03 | 3.63e-02 | 34 |
| GO:005507211 | Liver | HCC | iron ion homeostasis | 47/7958 | 85/18723 | 1.17e-02 | 4.28e-02 | 47 |
| GO:005507610 | Oral cavity | OSCC | transition metal ion homeostasis | 81/7305 | 138/18723 | 2.13e-06 | 2.72e-05 | 81 |
| GO:000930610 | Oral cavity | OSCC | protein secretion | 169/7305 | 359/18723 | 1.04e-03 | 5.34e-03 | 169 |
| GO:003559210 | Oral cavity | OSCC | establishment of protein localization to extracellular region | 169/7305 | 360/18723 | 1.21e-03 | 6.08e-03 | 169 |
| GO:00716929 | Oral cavity | OSCC | protein localization to extracellular region | 172/7305 | 368/18723 | 1.40e-03 | 6.79e-03 | 172 |
| Page: 1 2 |
| Pathway ID | Tissue | Disease Stage | Description | Gene Ratio | Bg Ratio | pvalue | p.adjust | qvalue | Count |
| hsa0411524 | Esophagus | ESCC | p53 signaling pathway | 65/4205 | 74/8465 | 3.88e-12 | 6.50e-11 | 3.33e-11 | 65 |
| hsa0421629 | Esophagus | ESCC | Ferroptosis | 33/4205 | 41/8465 | 4.58e-05 | 1.99e-04 | 1.02e-04 | 33 |
| hsa0411534 | Esophagus | ESCC | p53 signaling pathway | 65/4205 | 74/8465 | 3.88e-12 | 6.50e-11 | 3.33e-11 | 65 |
| hsa0421638 | Esophagus | ESCC | Ferroptosis | 33/4205 | 41/8465 | 4.58e-05 | 1.99e-04 | 1.02e-04 | 33 |
| hsa042168 | Liver | NAFLD | Ferroptosis | 12/1043 | 41/8465 | 2.98e-03 | 2.96e-02 | 2.39e-02 | 12 |
| hsa0421611 | Liver | NAFLD | Ferroptosis | 12/1043 | 41/8465 | 2.98e-03 | 2.96e-02 | 2.39e-02 | 12 |
| hsa0421641 | Liver | HCC | Ferroptosis | 33/4020 | 41/8465 | 1.42e-05 | 9.88e-05 | 5.50e-05 | 33 |
| hsa041156 | Liver | HCC | p53 signaling pathway | 46/4020 | 74/8465 | 7.64e-03 | 2.08e-02 | 1.16e-02 | 46 |
| hsa0421651 | Liver | HCC | Ferroptosis | 33/4020 | 41/8465 | 1.42e-05 | 9.88e-05 | 5.50e-05 | 33 |
| hsa0411511 | Liver | HCC | p53 signaling pathway | 46/4020 | 74/8465 | 7.64e-03 | 2.08e-02 | 1.16e-02 | 46 |
| hsa041159 | Oral cavity | OSCC | p53 signaling pathway | 57/3704 | 74/8465 | 4.99e-09 | 5.07e-08 | 2.58e-08 | 57 |
| hsa0421620 | Oral cavity | OSCC | Ferroptosis | 29/3704 | 41/8465 | 4.26e-04 | 1.30e-03 | 6.60e-04 | 29 |
| hsa0411514 | Oral cavity | OSCC | p53 signaling pathway | 57/3704 | 74/8465 | 4.99e-09 | 5.07e-08 | 2.58e-08 | 57 |
| hsa04216110 | Oral cavity | OSCC | Ferroptosis | 29/3704 | 41/8465 | 4.26e-04 | 1.30e-03 | 6.60e-04 | 29 |
| Page: 1 |
Top |
Cell-cell communication analysis |
| Identification of potential cell-cell interactions between two cell types and their ligand-receptor pairs for different disease states |
| Ligand | Receptor | LRpair | Pathway | Tissue | Disease Stage |
| Page: 1 |
Top |
Single-cell gene regulatory network inference analysis |
| Find out the significant the regulons (TFs) and the target genes of each regulon across cell types for different disease states |
| TF | Cell Type | Tissue | Disease Stage | Target Gene | RSS | Regulon Activity |
| ∗The dot plots of a searched regulon are shown for all cell subpopulations in each disease state of each tissue based on the regulon specific score inferred using pySCENIC and by calculating the average expression. |
| Page: 1 |
Top |
Somatic mutation of malignant transformation related genes |
| Annotation of somatic variants for genes involved in malignant transformation |
| Hugo Symbol | Variant Class | Variant Classification | dbSNP RS | HGVSc | HGVSp | HGVSp Short | SWISSPROT | BIOTYPE | SIFT | PolyPhen | Tumor Sample Barcode | Tissue | Histology | Sex | Age | Stage | Therapy Types | Drugs | Outcome |
| STEAP3 | SNV | Missense_Mutation | c.1139N>T | p.Thr380Met | p.T380M | Q658P3 | protein_coding | deleterious(0.05) | benign(0.01) | TCGA-A2-A0ER-01 | Breast | breast invasive carcinoma | Female | <65 | I/II | Chemotherapy | cytoxan | SD | |
| STEAP3 | SNV | Missense_Mutation | c.1241N>C | p.Val414Ala | p.V414A | Q658P3 | protein_coding | tolerated(0.19) | benign(0.013) | TCGA-C8-A274-01 | Breast | breast invasive carcinoma | Female | <65 | I/II | Hormone Therapy | tamoxiphen | SD | |
| STEAP3 | insertion | Frame_Shift_Ins | novel | c.1165_1166insG | p.Leu389ArgfsTer147 | p.L389Rfs*147 | Q658P3 | protein_coding | TCGA-A2-A0CT-01 | Breast | breast invasive carcinoma | Female | >=65 | I/II | Chemotherapy | cytoxan | SD | ||
| STEAP3 | insertion | Nonsense_Mutation | novel | c.1166_1167insGACTGTTCTGATTGGCTGCCCCGGGGCAGATATGTGAAA | p.Leu389_Pro390insThrValLeuIleGlyCysProGlyAlaAspMetTerLys | p.L389_P390insTVLIGCPGADM*K | Q658P3 | protein_coding | TCGA-A2-A0CT-01 | Breast | breast invasive carcinoma | Female | >=65 | I/II | Chemotherapy | cytoxan | SD | ||
| STEAP3 | SNV | Missense_Mutation | novel | c.1184C>T | p.Ser395Leu | p.S395L | Q658P3 | protein_coding | deleterious(0.05) | possibly_damaging(0.55) | TCGA-VS-A9V5-01 | Cervix | cervical & endocervical cancer | Female | <65 | I/II | Chemotherapy | carboplatin | PD |
| STEAP3 | SNV | Missense_Mutation | novel | c.655C>A | p.Leu219Ile | p.L219I | Q658P3 | protein_coding | deleterious(0.01) | benign(0.024) | TCGA-AA-3524-01 | Colorectum | colon adenocarcinoma | Male | >=65 | I/II | Unknown | Unknown | SD |
| STEAP3 | SNV | Missense_Mutation | rs748187004 | c.649C>T | p.Arg217Cys | p.R217C | Q658P3 | protein_coding | deleterious(0.04) | benign(0.025) | TCGA-AD-6895-01 | Colorectum | colon adenocarcinoma | Male | >=65 | III/IV | Unknown | Unknown | SD |
| STEAP3 | SNV | Missense_Mutation | rs748187004 | c.649C>T | p.Arg217Cys | p.R217C | Q658P3 | protein_coding | deleterious(0.04) | benign(0.025) | TCGA-G4-6304-01 | Colorectum | colon adenocarcinoma | Female | >=65 | I/II | Chemotherapy | fluorouracil | PD |
| STEAP3 | SNV | Missense_Mutation | novel | c.953N>C | p.Leu318Pro | p.L318P | Q658P3 | protein_coding | deleterious(0) | probably_damaging(0.967) | TCGA-G4-6320-01 | Colorectum | colon adenocarcinoma | Male | >=65 | III/IV | Chemotherapy | oxaliplatin | SD |
| STEAP3 | SNV | Missense_Mutation | rs140512748 | c.307N>T | p.Arg103Trp | p.R103W | Q658P3 | protein_coding | deleterious(0) | benign(0.348) | TCGA-AF-4110-01 | Colorectum | rectum adenocarcinoma | Male | >=65 | I/II | Chemotherapy | oxaliplatin | SD |
| Page: 1 2 3 4 5 6 |
Top |
Related drugs of malignant transformation related genes |
| Identification of chemicals and drugs interact with genes involved in malignant transfromation |
| (DGIdb 4.0) |
| Entrez ID | Symbol | Category | Interaction Types | Drug Claim Name | Drug Name | PMIDs |
| Page: 1 |

Copyright 2023-Present -The University of Texas Health Science Center at Houston |