
|
|||||
|
 | |
| |
| |
| |
| |
| |
|
Gene: STEAP2 |
Gene summary for STEAP2 |
| Gene information | Species | Human | Gene symbol | STEAP2 | Gene ID | 261729 |
| Gene name | STEAP2 metalloreductase | |
| Gene Alias | IPCA1 | |
| Cytomap | 7q21.13 | |
| Gene Type | protein-coding | GO ID | GO:0000041 | UniProtAcc | B3KS24 |
Top |
Malignant transformation analysis |
| Identification of the aberrant gene expression in precancerous and cancerous lesions by comparing the gene expression of stem-like cells in diseased tissues with normal stem cells |
| Entrez ID | Symbol | Replicates | Species | Organ | Tissue | Adj P-value | Log2FC | Malignancy |
| 261729 | STEAP2 | LZE24T | Human | Esophagus | ESCC | 1.00e-02 | 8.64e-02 | 0.0596 |
| 261729 | STEAP2 | LZE21T | Human | Esophagus | ESCC | 6.24e-03 | 2.42e-01 | 0.0655 |
| 261729 | STEAP2 | P1T-E | Human | Esophagus | ESCC | 5.94e-05 | 2.43e-01 | 0.0875 |
| 261729 | STEAP2 | P2T-E | Human | Esophagus | ESCC | 3.57e-25 | 3.69e-01 | 0.1177 |
| 261729 | STEAP2 | P4T-E | Human | Esophagus | ESCC | 6.43e-15 | 4.03e-01 | 0.1323 |
| 261729 | STEAP2 | P8T-E | Human | Esophagus | ESCC | 1.15e-08 | 2.63e-01 | 0.0889 |
| 261729 | STEAP2 | P9T-E | Human | Esophagus | ESCC | 2.23e-12 | 3.45e-01 | 0.1131 |
| 261729 | STEAP2 | P10T-E | Human | Esophagus | ESCC | 4.92e-16 | 3.73e-01 | 0.116 |
| 261729 | STEAP2 | P12T-E | Human | Esophagus | ESCC | 9.40e-16 | 3.58e-01 | 0.1122 |
| 261729 | STEAP2 | P15T-E | Human | Esophagus | ESCC | 3.01e-13 | 4.14e-01 | 0.1149 |
| 261729 | STEAP2 | P16T-E | Human | Esophagus | ESCC | 1.54e-45 | 8.52e-01 | 0.1153 |
| 261729 | STEAP2 | P20T-E | Human | Esophagus | ESCC | 2.93e-19 | 5.03e-01 | 0.1124 |
| 261729 | STEAP2 | P21T-E | Human | Esophagus | ESCC | 1.21e-06 | 7.90e-02 | 0.1617 |
| 261729 | STEAP2 | P22T-E | Human | Esophagus | ESCC | 9.53e-15 | 2.41e-01 | 0.1236 |
| 261729 | STEAP2 | P23T-E | Human | Esophagus | ESCC | 3.95e-05 | 2.69e-01 | 0.108 |
| 261729 | STEAP2 | P24T-E | Human | Esophagus | ESCC | 2.02e-03 | 1.41e-01 | 0.1287 |
| 261729 | STEAP2 | P26T-E | Human | Esophagus | ESCC | 9.31e-10 | 1.00e-01 | 0.1276 |
| 261729 | STEAP2 | P27T-E | Human | Esophagus | ESCC | 2.22e-14 | 1.76e-01 | 0.1055 |
| 261729 | STEAP2 | P28T-E | Human | Esophagus | ESCC | 1.66e-06 | 1.21e-01 | 0.1149 |
| 261729 | STEAP2 | P36T-E | Human | Esophagus | ESCC | 2.08e-10 | 4.54e-01 | 0.1187 |
| Page: 1 2 3 4 |
| Tissue | Expression Dynamics | Abbreviation |
| Esophagus | 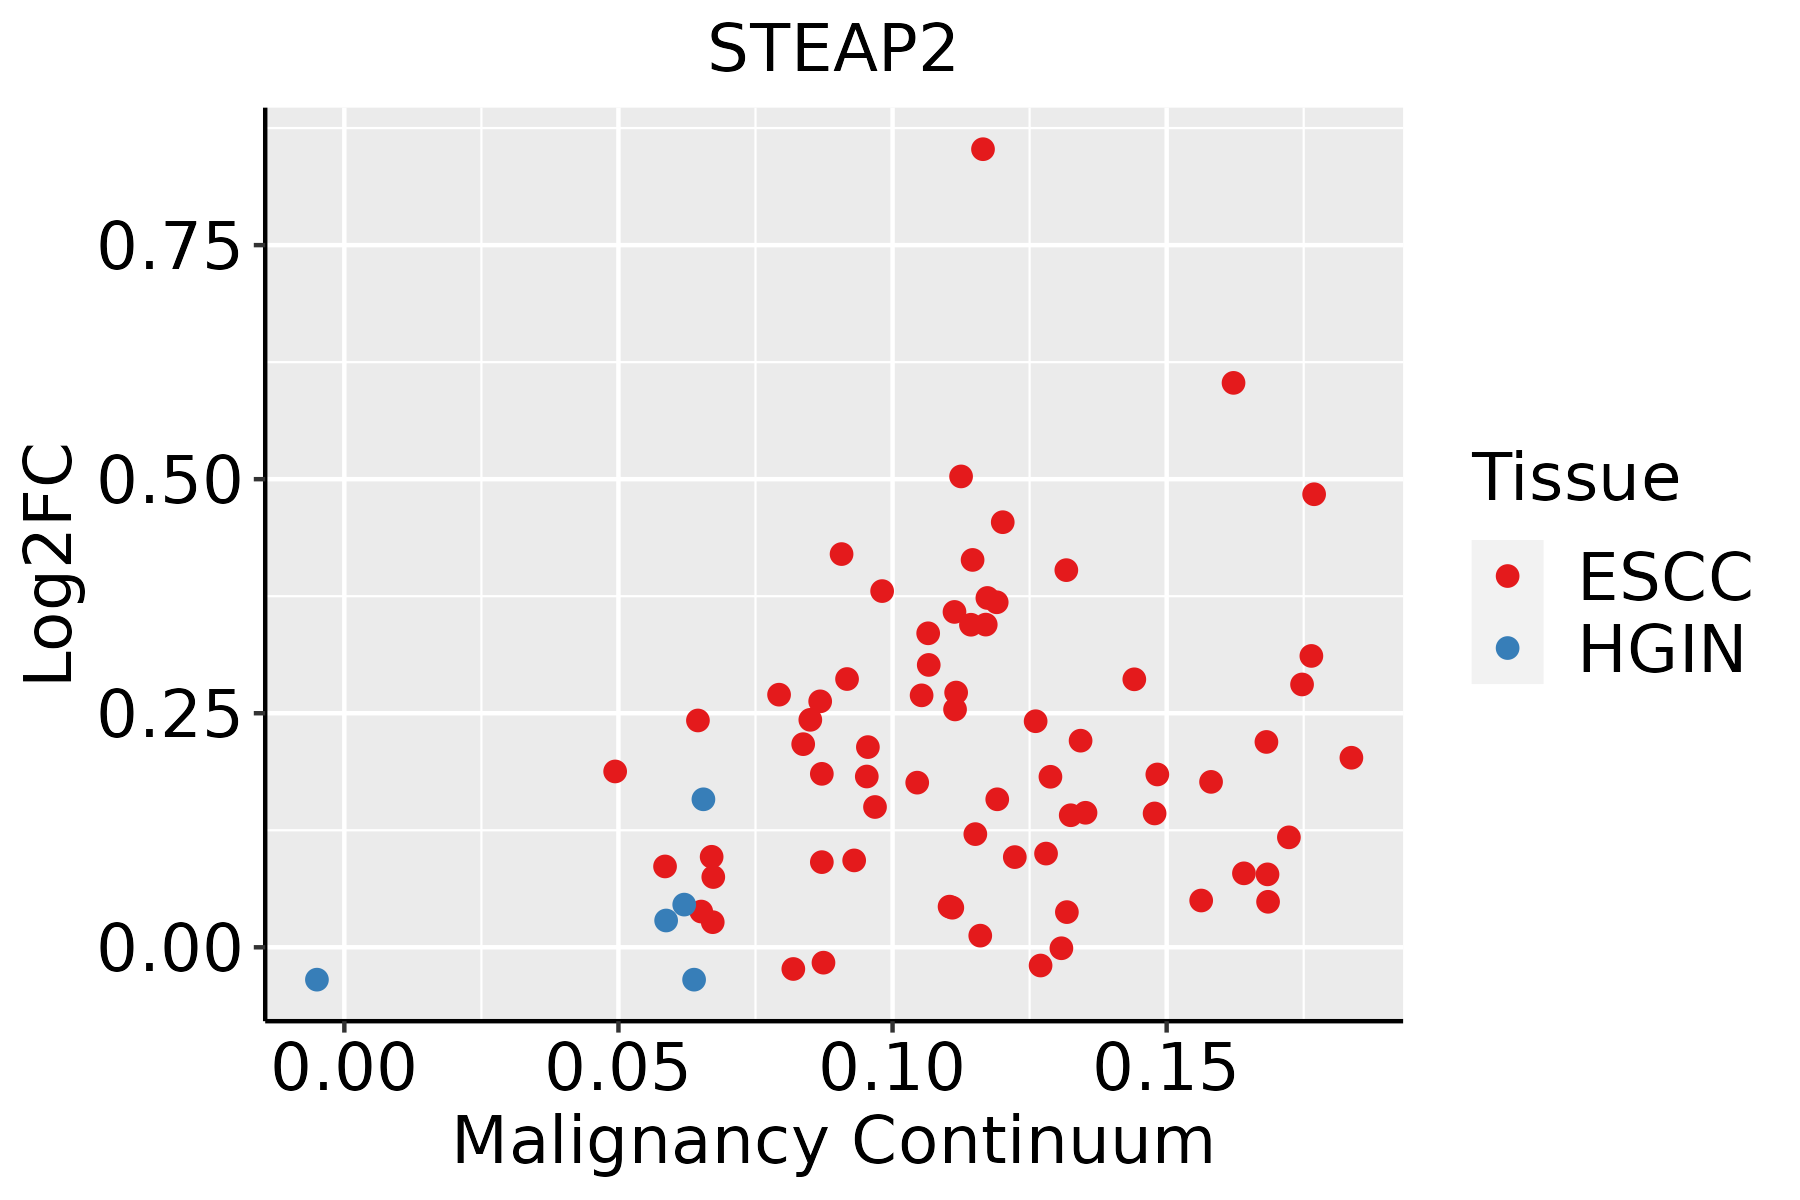 | ESCC: Esophageal squamous cell carcinoma |
| HGIN: High-grade intraepithelial neoplasias | ||
| LGIN: Low-grade intraepithelial neoplasias | ||
| GC |  | CAG: Chronic atrophic gastritis |
| CAG with IM: Chronic atrophic gastritis with intestinal metaplasia | ||
| CSG: Chronic superficial gastritis | ||
| GC: Gastric cancer | ||
| SIM: Severe intestinal metaplasia | ||
| WIM: Wild intestinal metaplasia | ||
| Prostate | 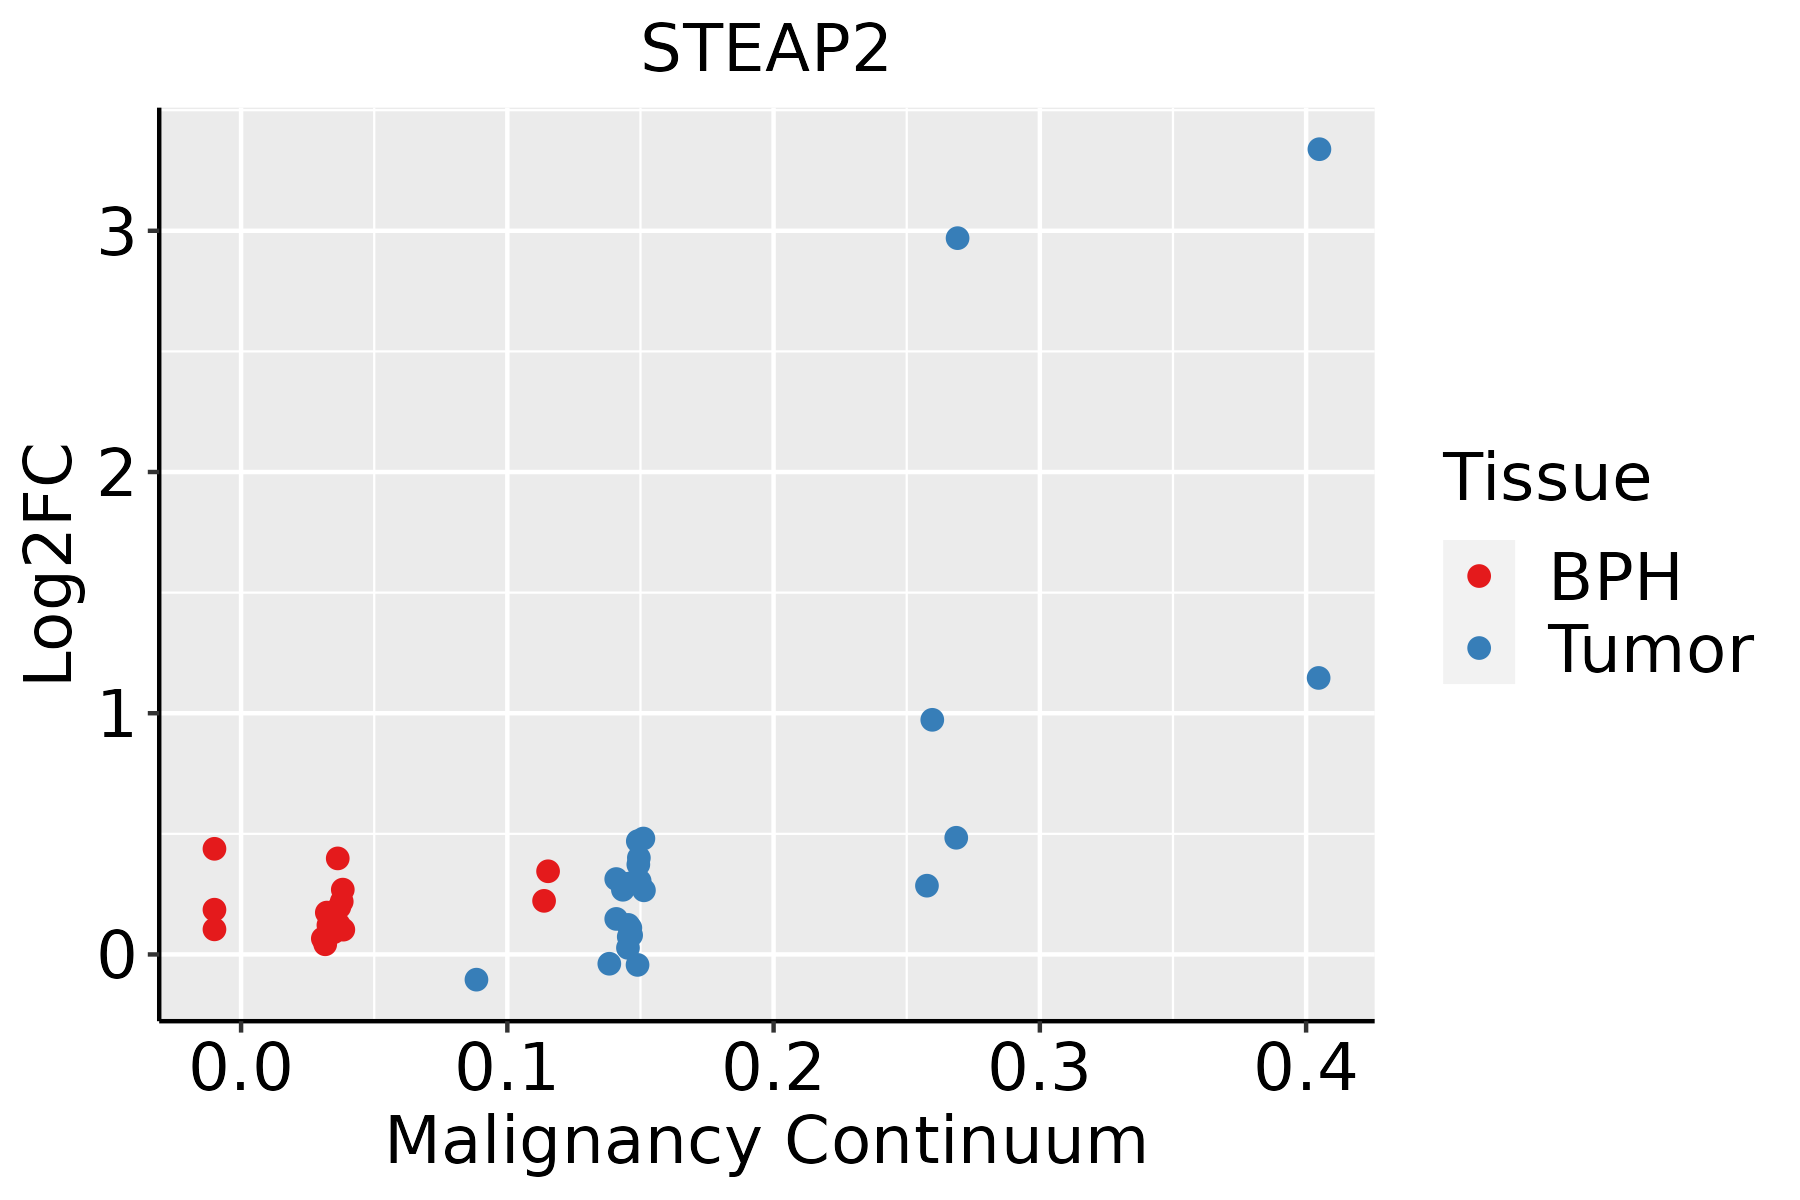 | BPH: Benign Prostatic Hyperplasia |
| Thyroid | 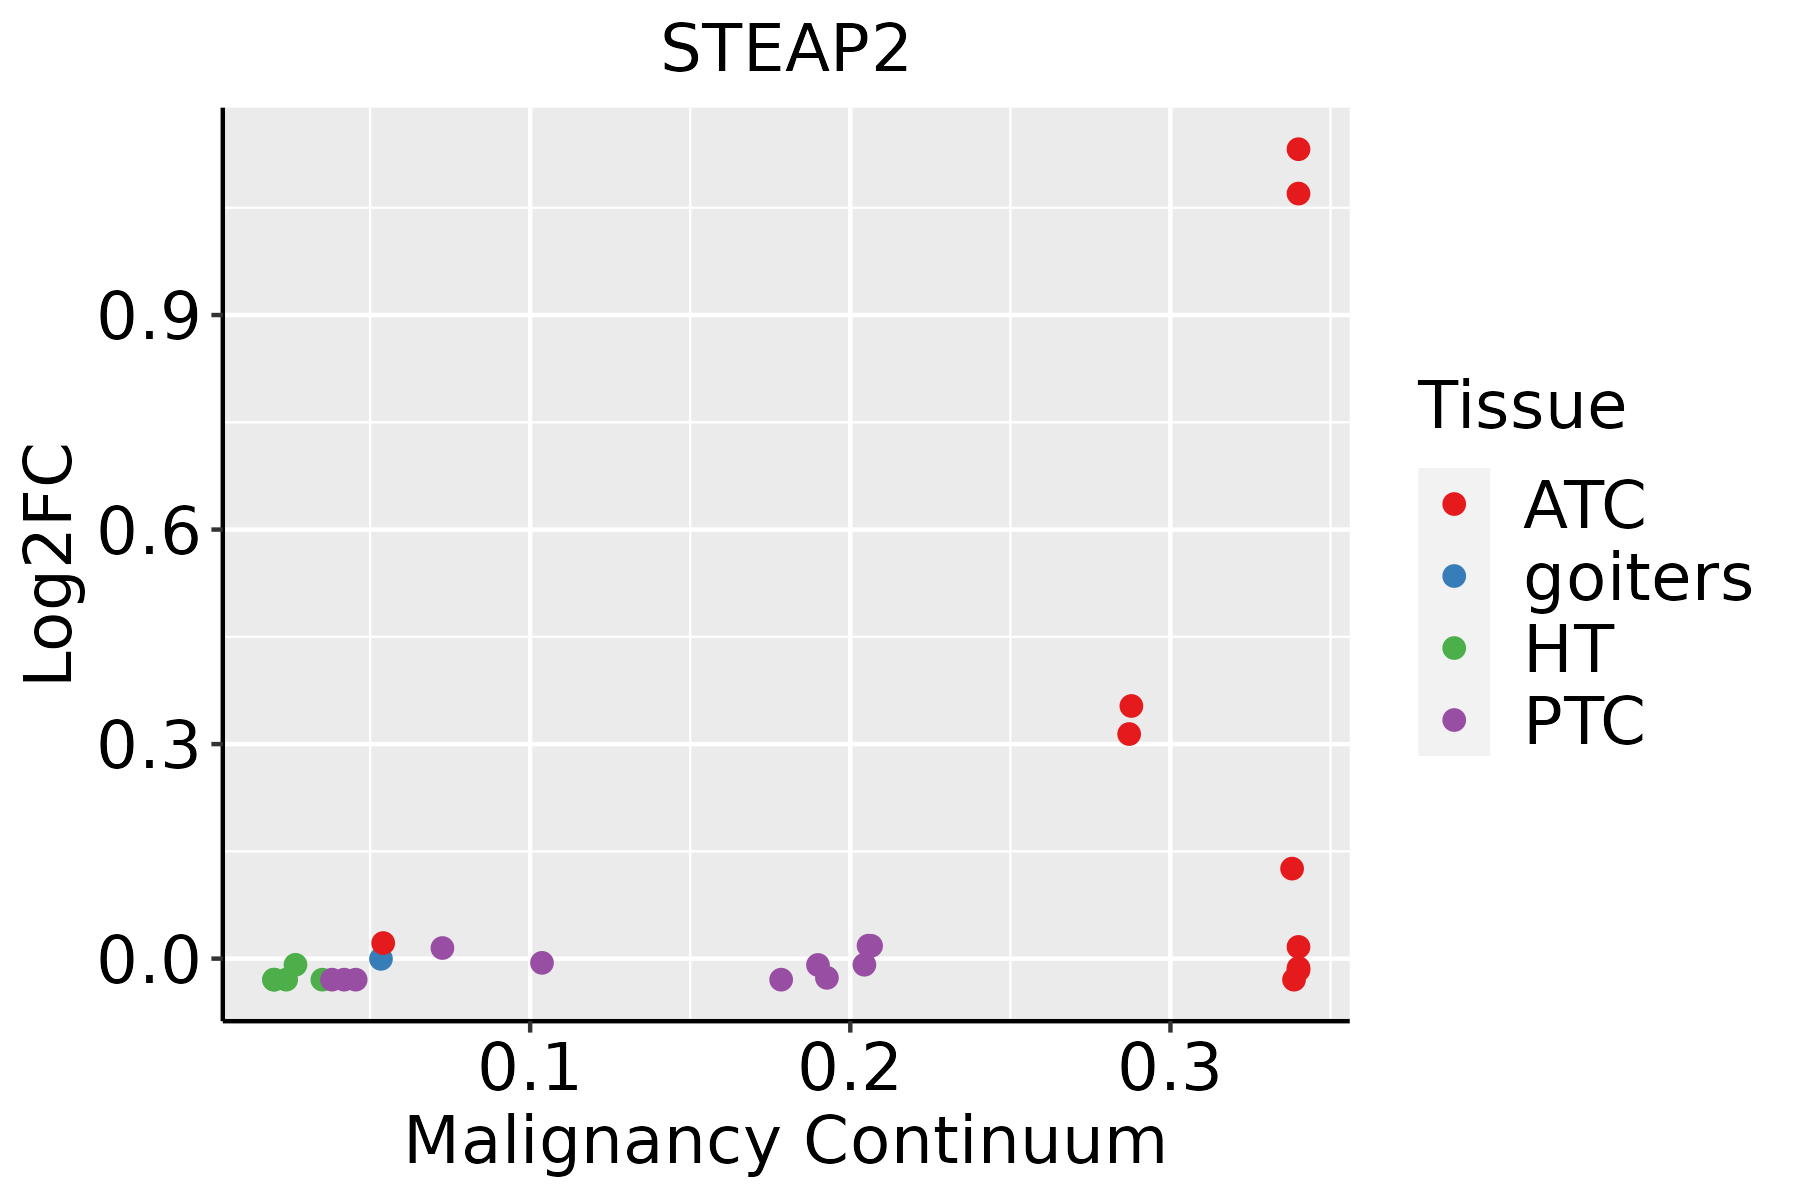 | ATC: Anaplastic thyroid cancer |
| HT: Hashimoto's thyroiditis | ||
| PTC: Papillary thyroid cancer |
| ∗log2FC in expression of this searched gene in stem-like cells from each diseased tissue sample relative to stem-like cells in normal samples in each tissue plotted against the malignancy continuum. Samples are colored based on if they are from different disease stage. |
Top |
Malignant transformation related pathway analysis |
| Find out the enriched GO biological processes and KEGG pathways involved in transition from healthy to precancer to cancer |
| Tissue | Disease Stage | Enriched GO biological Processes |
| Colorectum | AD |  |
| Colorectum | SER |  |
| Colorectum | MSS |  |
| Colorectum | MSI-H |  |
| Colorectum | FAP |  |
| ∗Top 15 enriched GO BP terms are showed in the bar plot of each disease state in each tissue. Each row represents a significant GO biological process which is colored according to the -log10(p.adjust). |
| Page: 1 2 3 4 5 6 7 8 9 |
| GO ID | Tissue | Disease Stage | Description | Gene Ratio | Bg Ratio | pvalue | p.adjust | Count |
| GO:004819318 | Esophagus | ESCC | Golgi vesicle transport | 231/8552 | 296/18723 | 1.82e-30 | 9.63e-28 | 231 |
| GO:000689215 | Esophagus | ESCC | post-Golgi vesicle-mediated transport | 82/8552 | 104/18723 | 4.00e-12 | 1.55e-10 | 82 |
| GO:009887615 | Esophagus | ESCC | vesicle-mediated transport to the plasma membrane | 99/8552 | 136/18723 | 1.13e-10 | 3.39e-09 | 99 |
| GO:000689315 | Esophagus | ESCC | Golgi to plasma membrane transport | 48/8552 | 60/18723 | 5.11e-08 | 9.16e-07 | 48 |
| GO:005507617 | Esophagus | ESCC | transition metal ion homeostasis | 87/8552 | 138/18723 | 2.85e-05 | 2.37e-04 | 87 |
| GO:00469169 | Esophagus | ESCC | cellular transition metal ion homeostasis | 70/8552 | 115/18723 | 7.28e-04 | 3.79e-03 | 70 |
| GO:00550729 | Esophagus | ESCC | iron ion homeostasis | 52/8552 | 85/18723 | 2.86e-03 | 1.21e-02 | 52 |
| GO:004819310 | Prostate | BPH | Golgi vesicle transport | 102/3107 | 296/18723 | 3.90e-14 | 4.56e-12 | 102 |
| GO:00988768 | Prostate | BPH | vesicle-mediated transport to the plasma membrane | 43/3107 | 136/18723 | 1.11e-05 | 1.51e-04 | 43 |
| GO:00550769 | Prostate | BPH | transition metal ion homeostasis | 43/3107 | 138/18723 | 1.66e-05 | 2.07e-04 | 43 |
| GO:00068928 | Prostate | BPH | post-Golgi vesicle-mediated transport | 34/3107 | 104/18723 | 4.14e-05 | 4.43e-04 | 34 |
| GO:00550727 | Prostate | BPH | iron ion homeostasis | 29/3107 | 85/18723 | 6.22e-05 | 6.23e-04 | 29 |
| GO:00469167 | Prostate | BPH | cellular transition metal ion homeostasis | 35/3107 | 115/18723 | 1.64e-04 | 1.42e-03 | 35 |
| GO:00068793 | Prostate | BPH | cellular iron ion homeostasis | 21/3107 | 67/18723 | 2.09e-03 | 1.17e-02 | 21 |
| GO:00068937 | Prostate | BPH | Golgi to plasma membrane transport | 19/3107 | 60/18723 | 2.94e-03 | 1.54e-02 | 19 |
| GO:0006825 | Prostate | BPH | copper ion transport | 7/3107 | 15/18723 | 6.42e-03 | 2.91e-02 | 7 |
| GO:004819314 | Prostate | Tumor | Golgi vesicle transport | 105/3246 | 296/18723 | 3.55e-14 | 4.33e-12 | 105 |
| GO:005507615 | Prostate | Tumor | transition metal ion homeostasis | 45/3246 | 138/18723 | 9.11e-06 | 1.33e-04 | 45 |
| GO:005507213 | Prostate | Tumor | iron ion homeostasis | 31/3246 | 85/18723 | 1.89e-05 | 2.47e-04 | 31 |
| GO:000689213 | Prostate | Tumor | post-Golgi vesicle-mediated transport | 35/3246 | 104/18723 | 4.14e-05 | 4.70e-04 | 35 |
| Page: 1 2 |
| Pathway ID | Tissue | Disease Stage | Description | Gene Ratio | Bg Ratio | pvalue | p.adjust | qvalue | Count |
| hsa0497814 | Prostate | BPH | Mineral absorption | 20/1718 | 60/8465 | 1.22e-02 | 3.61e-02 | 2.23e-02 | 20 |
| hsa0497815 | Prostate | BPH | Mineral absorption | 20/1718 | 60/8465 | 1.22e-02 | 3.61e-02 | 2.23e-02 | 20 |
| hsa04978 | Stomach | GC | Mineral absorption | 15/708 | 60/8465 | 8.88e-05 | 9.80e-04 | 6.90e-04 | 15 |
| hsa049781 | Stomach | GC | Mineral absorption | 15/708 | 60/8465 | 8.88e-05 | 9.80e-04 | 6.90e-04 | 15 |
| hsa049782 | Stomach | CAG with IM | Mineral absorption | 12/640 | 60/8465 | 1.52e-03 | 1.01e-02 | 7.10e-03 | 12 |
| hsa049783 | Stomach | CAG with IM | Mineral absorption | 12/640 | 60/8465 | 1.52e-03 | 1.01e-02 | 7.10e-03 | 12 |
| Page: 1 |
Top |
Cell-cell communication analysis |
| Identification of potential cell-cell interactions between two cell types and their ligand-receptor pairs for different disease states |
| Ligand | Receptor | LRpair | Pathway | Tissue | Disease Stage |
| Page: 1 |
Top |
Single-cell gene regulatory network inference analysis |
| Find out the significant the regulons (TFs) and the target genes of each regulon across cell types for different disease states |
| TF | Cell Type | Tissue | Disease Stage | Target Gene | RSS | Regulon Activity |
| ∗The dot plots of a searched regulon are shown for all cell subpopulations in each disease state of each tissue based on the regulon specific score inferred using pySCENIC and by calculating the average expression. |
| Page: 1 |
Top |
Somatic mutation of malignant transformation related genes |
| Annotation of somatic variants for genes involved in malignant transformation |
| Hugo Symbol | Variant Class | Variant Classification | dbSNP RS | HGVSc | HGVSp | HGVSp Short | SWISSPROT | BIOTYPE | SIFT | PolyPhen | Tumor Sample Barcode | Tissue | Histology | Sex | Age | Stage | Therapy Types | Drugs | Outcome |
| STEAP2 | SNV | Missense_Mutation | novel | c.551N>G | p.Gln184Arg | p.Q184R | Q8NFT2 | protein_coding | tolerated(0.51) | benign(0.003) | TCGA-A2-A0D0-01 | Breast | breast invasive carcinoma | Female | <65 | I/II | Chemotherapy | cytoxan | SD |
| STEAP2 | SNV | Missense_Mutation | c.917N>A | p.Gly306Glu | p.G306E | Q8NFT2 | protein_coding | deleterious(0) | probably_damaging(1) | TCGA-AC-A23H-01 | Breast | breast invasive carcinoma | Female | >=65 | I/II | Unknown | Unknown | PD | |
| STEAP2 | SNV | Missense_Mutation | c.1157T>C | p.Leu386Ser | p.L386S | Q8NFT2 | protein_coding | deleterious(0) | probably_damaging(0.998) | TCGA-BH-A0EE-01 | Breast | breast invasive carcinoma | Female | >=65 | I/II | Chemotherapy | docetaxel | SD | |
| STEAP2 | SNV | Missense_Mutation | c.1051N>A | p.Glu351Lys | p.E351K | Q8NFT2 | protein_coding | tolerated(0.17) | probably_damaging(0.997) | TCGA-D8-A1JA-01 | Breast | breast invasive carcinoma | Female | <65 | III/IV | Chemotherapy | adriamycin | PD | |
| STEAP2 | insertion | Nonsense_Mutation | novel | c.346_347insCTTTTTAAAAAATGGTTTTTCTTTCTTCTCTTGTCT | p.Val116delinsAlaPheTerLysMetValPheLeuSerSerLeuValLeu | p.V116delinsAF*KMVFLSSLVL | Q8NFT2 | protein_coding | TCGA-A2-A0EV-01 | Breast | breast invasive carcinoma | Female | >=65 | I/II | Unknown | Unknown | SD | ||
| STEAP2 | insertion | Nonsense_Mutation | novel | c.1453_1454insCAATGCTTTAAACTGGAGAGAATTCAGTTTTATTC | p.Glu485AlafsTer4 | p.E485Afs*4 | Q8NFT2 | protein_coding | TCGA-AO-A03R-01 | Breast | breast invasive carcinoma | Female | <65 | I/II | Chemotherapy | doxorubicin | SD | ||
| STEAP2 | SNV | Missense_Mutation | novel | c.1142N>T | p.Ser381Leu | p.S381L | Q8NFT2 | protein_coding | deleterious(0) | probably_damaging(1) | TCGA-VS-A9V5-01 | Cervix | cervical & endocervical cancer | Female | <65 | I/II | Chemotherapy | carboplatin | PD |
| STEAP2 | deletion | Frame_Shift_Del | novel | c.1288_1307delNNNNNNNNNNNNNNNNNNNN | p.Pro430CysfsTer10 | p.P430Cfs*10 | Q8NFT2 | protein_coding | TCGA-DS-A1OD-01 | Cervix | cervical & endocervical cancer | Female | <65 | I/II | Chemotherapy | cisplatin | SD | ||
| STEAP2 | SNV | Missense_Mutation | c.1106G>A | p.Gly369Asp | p.G369D | Q8NFT2 | protein_coding | tolerated(0.13) | probably_damaging(0.998) | TCGA-A6-5665-01 | Colorectum | colon adenocarcinoma | Female | >=65 | I/II | Unknown | Unknown | PD | |
| STEAP2 | SNV | Missense_Mutation | novel | c.380N>G | p.Glu127Gly | p.E127G | Q8NFT2 | protein_coding | deleterious(0.01) | benign(0.068) | TCGA-AZ-4315-01 | Colorectum | colon adenocarcinoma | Male | <65 | I/II | Unknown | Unknown | SD |
| Page: 1 2 3 4 5 |
Top |
Related drugs of malignant transformation related genes |
| Identification of chemicals and drugs interact with genes involved in malignant transfromation |
| (DGIdb 4.0) |
| Entrez ID | Symbol | Category | Interaction Types | Drug Claim Name | Drug Name | PMIDs |
| Page: 1 |

Copyright 2023-Present -The University of Texas Health Science Center at Houston |