
|
|||||
|
 | |
| |
| |
| |
| |
| |
|
Gene: STEAP1B |
Gene summary for STEAP1B |
| Gene information | Species | Human | Gene symbol | STEAP1B | Gene ID | 256227 |
| Gene name | STEAP family member 1B | |
| Gene Alias | STEAP1B | |
| Cytomap | 7p15.3 | |
| Gene Type | protein-coding | GO ID | GO:0005575 | UniProtAcc | Q6NZ63 |
Top |
Malignant transformation analysis |
| Identification of the aberrant gene expression in precancerous and cancerous lesions by comparing the gene expression of stem-like cells in diseased tissues with normal stem cells |
| Entrez ID | Symbol | Replicates | Species | Organ | Tissue | Adj P-value | Log2FC | Malignancy |
| 256227 | STEAP1B | CCI_1 | Human | Cervix | CC | 7.68e-06 | 4.13e-01 | 0.528 |
| 256227 | STEAP1B | CCI_2 | Human | Cervix | CC | 2.37e-06 | 5.50e-01 | 0.5249 |
| 256227 | STEAP1B | Tumor | Human | Cervix | CC | 1.14e-02 | 1.16e-01 | 0.1241 |
| 256227 | STEAP1B | sample3 | Human | Cervix | CC | 2.20e-02 | 1.49e-01 | 0.1387 |
| 256227 | STEAP1B | HTA11_3410_2000001011 | Human | Colorectum | AD | 3.79e-111 | 2.33e+00 | 0.0155 |
| 256227 | STEAP1B | HTA11_2487_2000001011 | Human | Colorectum | SER | 9.44e-74 | 3.41e+00 | -0.1808 |
| 256227 | STEAP1B | HTA11_2951_2000001011 | Human | Colorectum | AD | 4.67e-35 | 3.85e+00 | 0.0216 |
| 256227 | STEAP1B | HTA11_1938_2000001011 | Human | Colorectum | AD | 2.41e-69 | 3.78e+00 | -0.0811 |
| 256227 | STEAP1B | HTA11_78_2000001011 | Human | Colorectum | AD | 6.98e-71 | 4.46e+00 | -0.1088 |
| 256227 | STEAP1B | HTA11_347_2000001011 | Human | Colorectum | AD | 4.58e-93 | 3.94e+00 | -0.1954 |
| 256227 | STEAP1B | HTA11_411_2000001011 | Human | Colorectum | SER | 1.07e-23 | 4.28e+00 | -0.2602 |
| 256227 | STEAP1B | HTA11_2112_2000001011 | Human | Colorectum | SER | 4.88e-20 | 3.35e+00 | -0.2196 |
| 256227 | STEAP1B | HTA11_3361_2000001011 | Human | Colorectum | AD | 5.04e-57 | 3.35e+00 | -0.1207 |
| 256227 | STEAP1B | HTA11_83_2000001011 | Human | Colorectum | SER | 1.00e-58 | 3.68e+00 | -0.1526 |
| 256227 | STEAP1B | HTA11_696_2000001011 | Human | Colorectum | AD | 1.33e-135 | 3.80e+00 | -0.1464 |
| 256227 | STEAP1B | HTA11_866_2000001011 | Human | Colorectum | AD | 1.80e-115 | 3.47e+00 | -0.1001 |
| 256227 | STEAP1B | HTA11_1391_2000001011 | Human | Colorectum | AD | 6.96e-101 | 4.36e+00 | -0.059 |
| 256227 | STEAP1B | HTA11_2992_2000001011 | Human | Colorectum | SER | 1.39e-36 | 3.69e+00 | -0.1706 |
| 256227 | STEAP1B | HTA11_5212_2000001011 | Human | Colorectum | AD | 2.48e-37 | 2.85e+00 | -0.2061 |
| 256227 | STEAP1B | HTA11_5216_2000001011 | Human | Colorectum | SER | 1.28e-36 | 3.66e+00 | -0.1462 |
| Page: 1 2 3 4 5 |
| Tissue | Expression Dynamics | Abbreviation |
| Cervix | 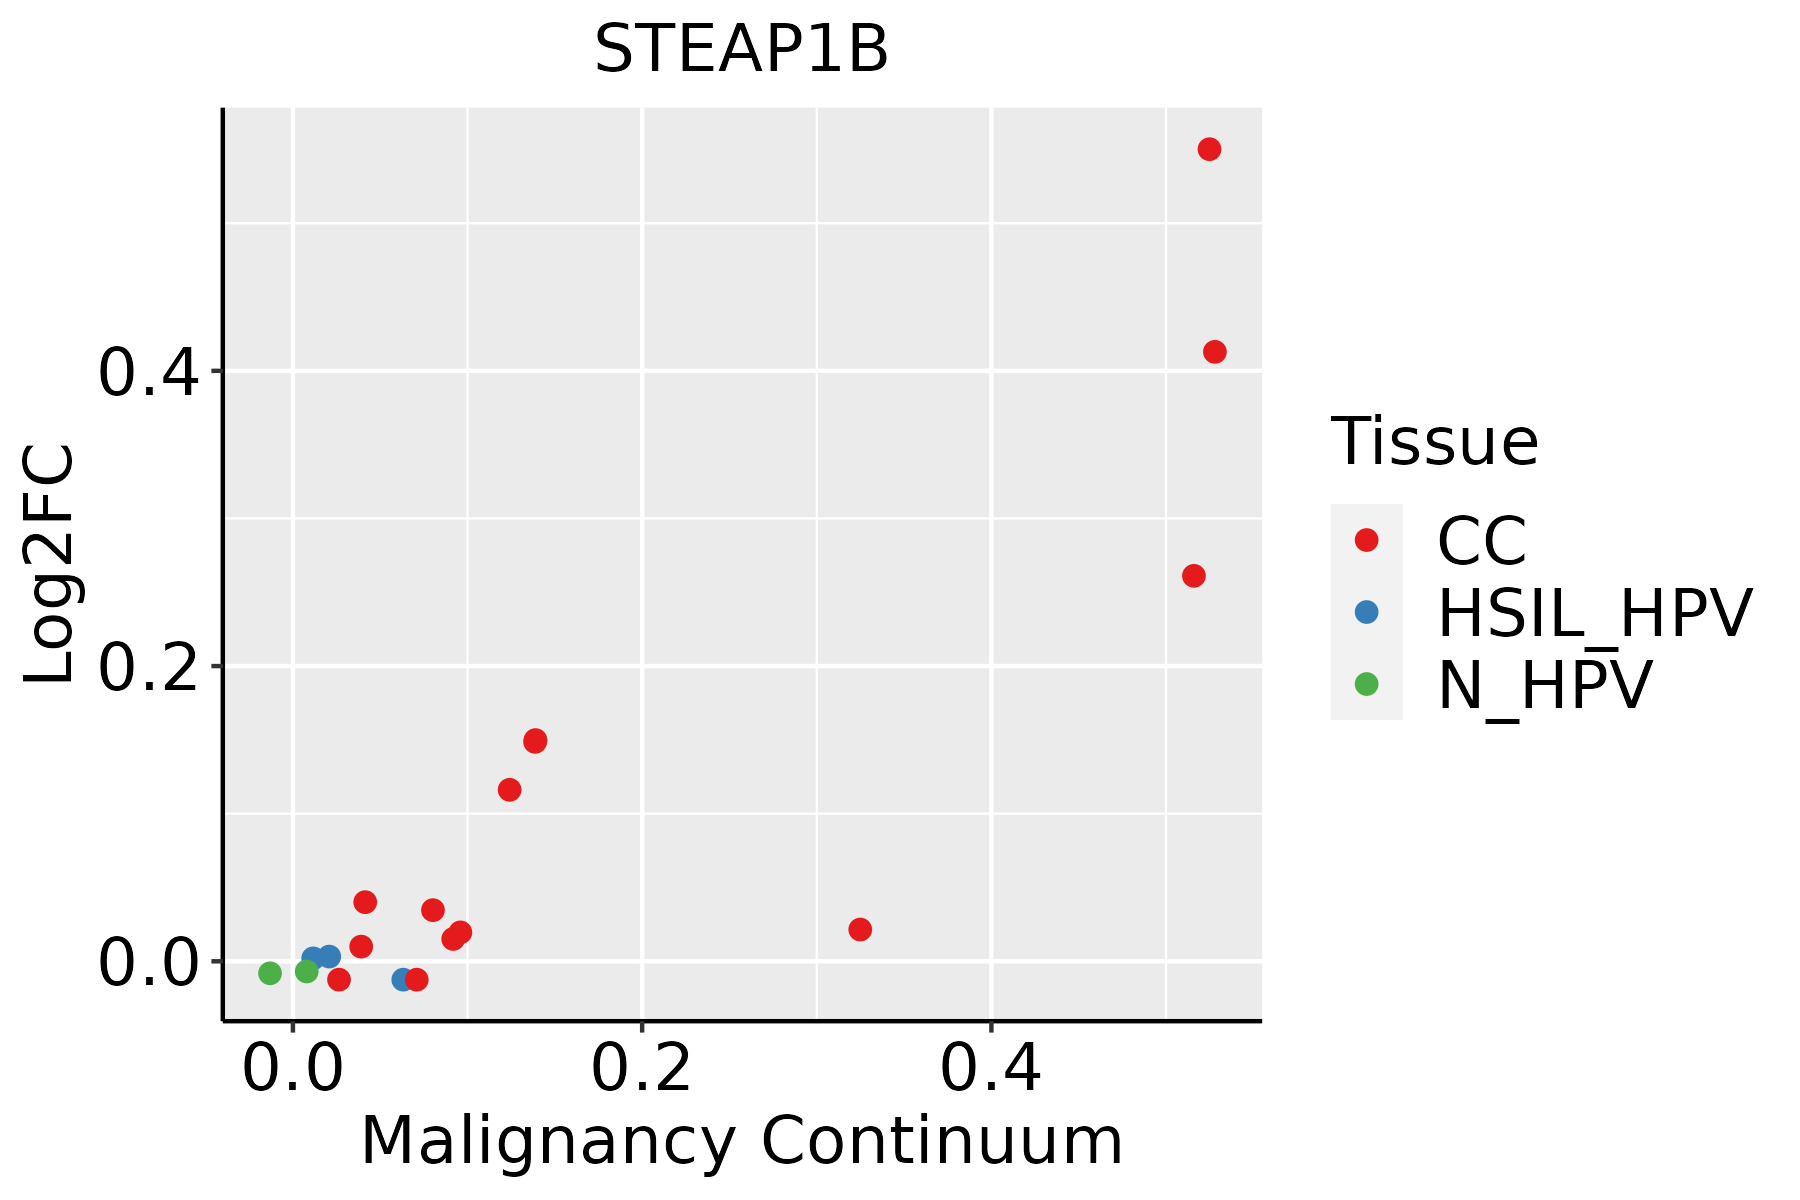 | CC: Cervix cancer |
| HSIL_HPV: HPV-infected high-grade squamous intraepithelial lesions | ||
| N_HPV: HPV-infected normal cervix | ||
| Colorectum (GSE201348) |  | FAP: Familial adenomatous polyposis |
| CRC: Colorectal cancer | ||
| Colorectum (HTA11) |  | AD: Adenomas |
| SER: Sessile serrated lesions | ||
| MSI-H: Microsatellite-high colorectal cancer | ||
| MSS: Microsatellite stable colorectal cancer | ||
| Esophagus |  | ESCC: Esophageal squamous cell carcinoma |
| HGIN: High-grade intraepithelial neoplasias | ||
| LGIN: Low-grade intraepithelial neoplasias | ||
| Liver | 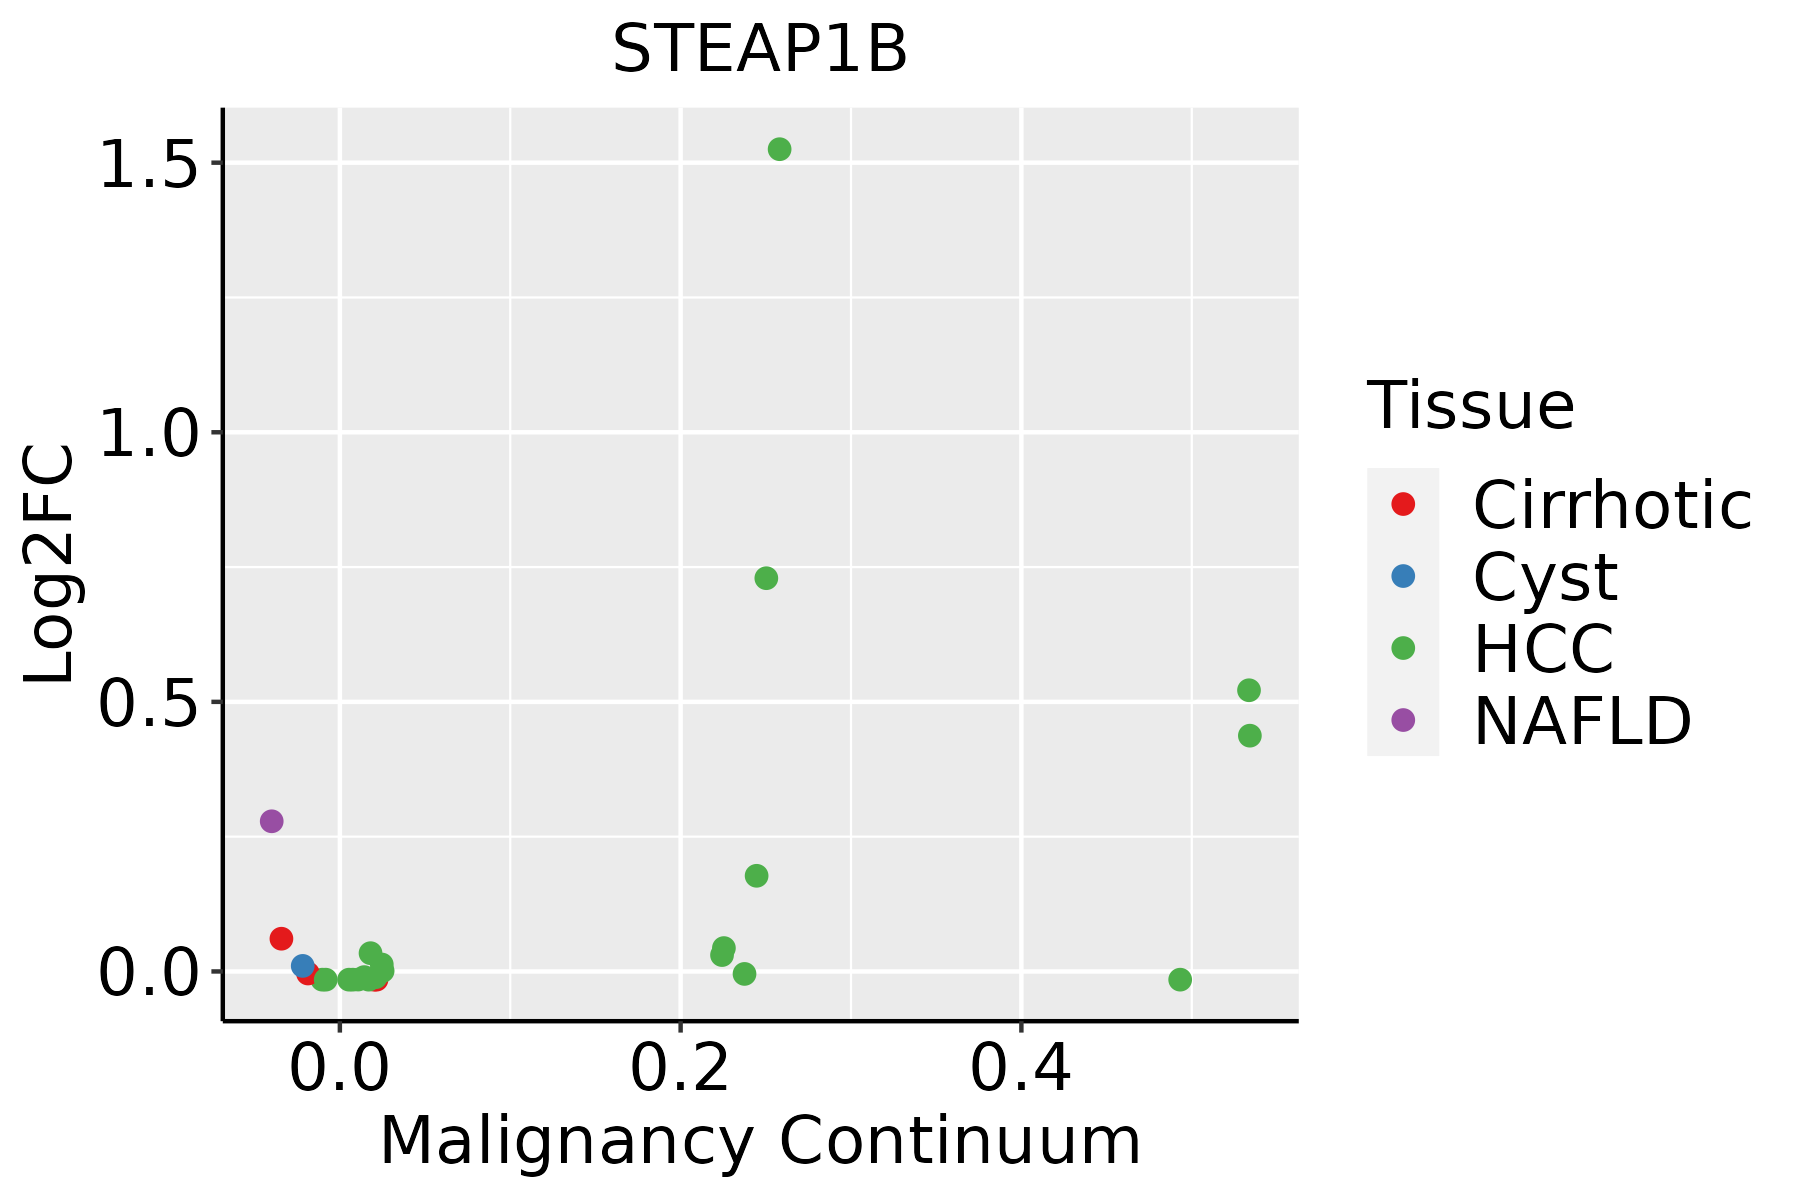 | HCC: Hepatocellular carcinoma |
| NAFLD: Non-alcoholic fatty liver disease | ||
| Skin | 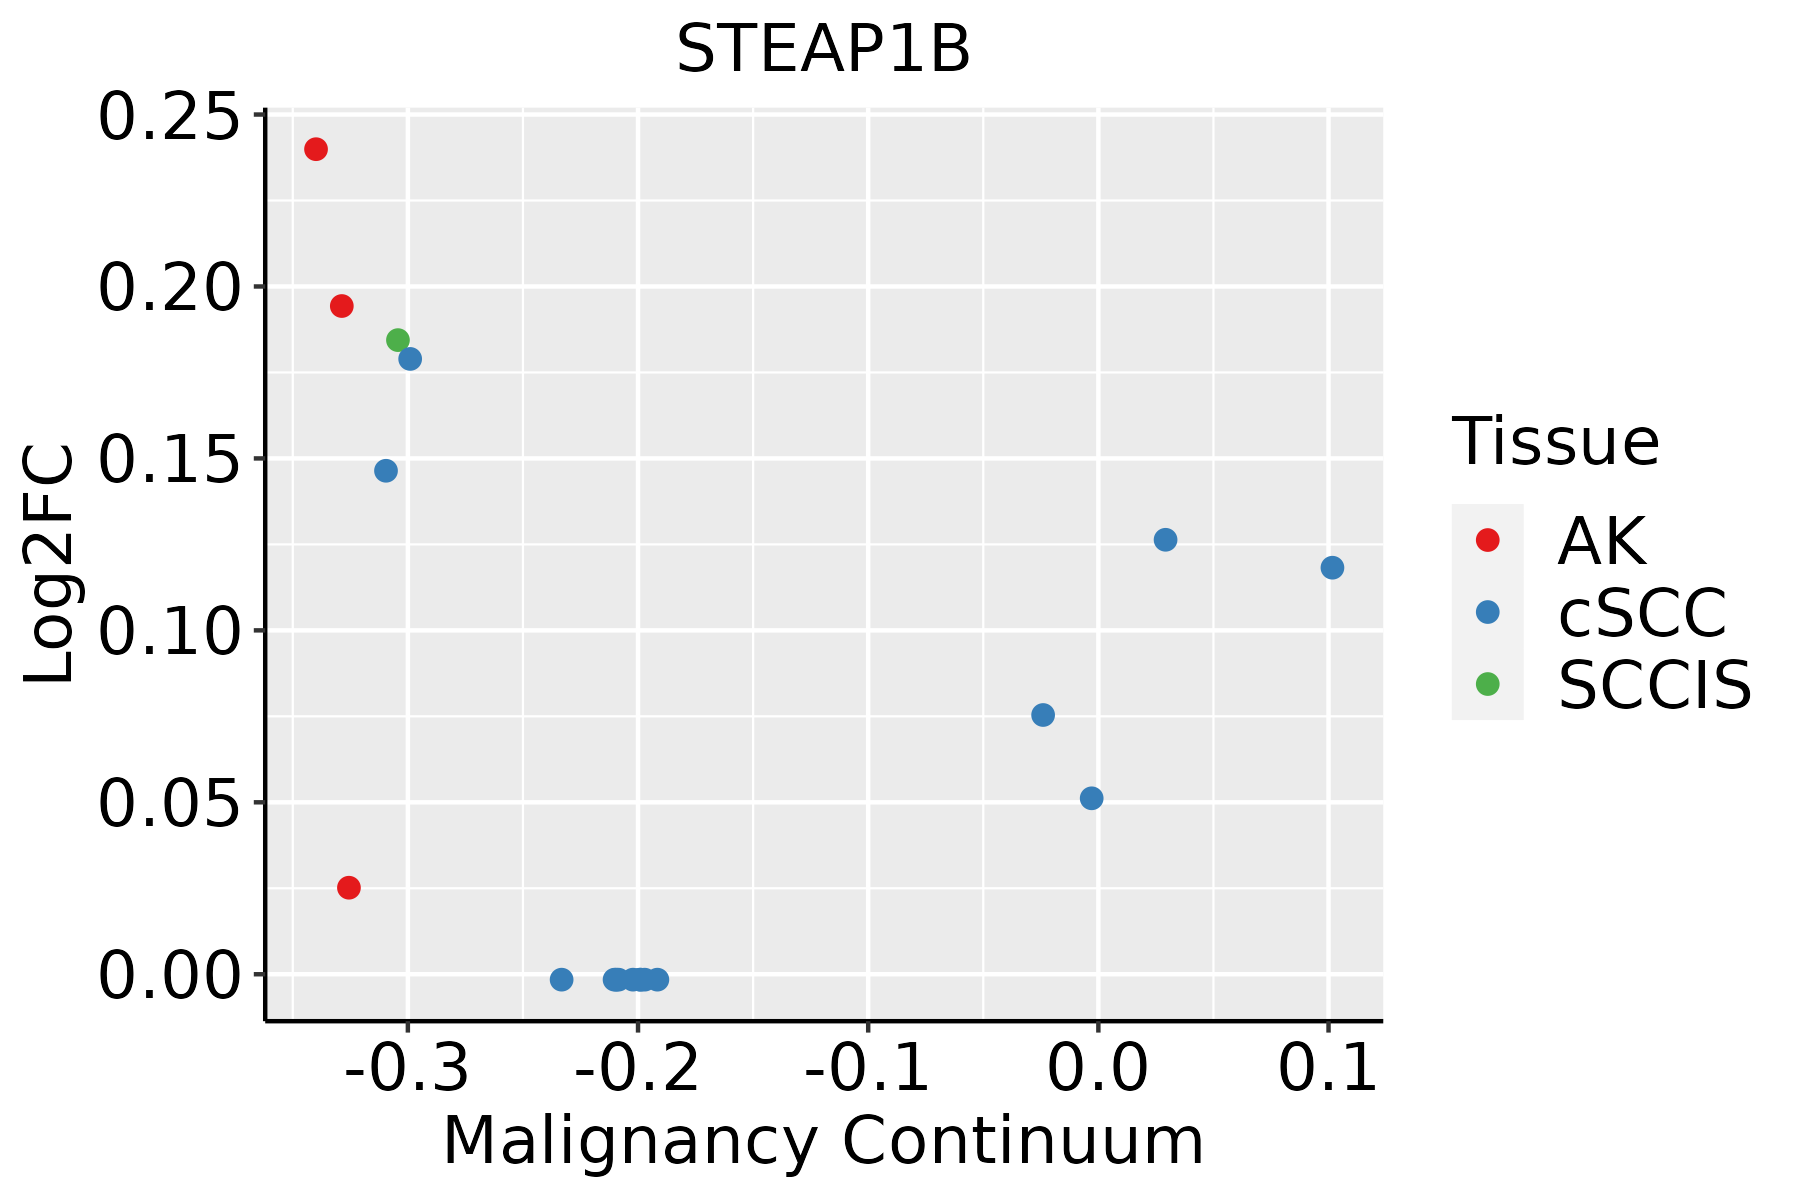 | AK: Actinic keratosis |
| cSCC: Cutaneous squamous cell carcinoma | ||
| SCCIS:squamous cell carcinoma in situ | ||
| Thyroid | 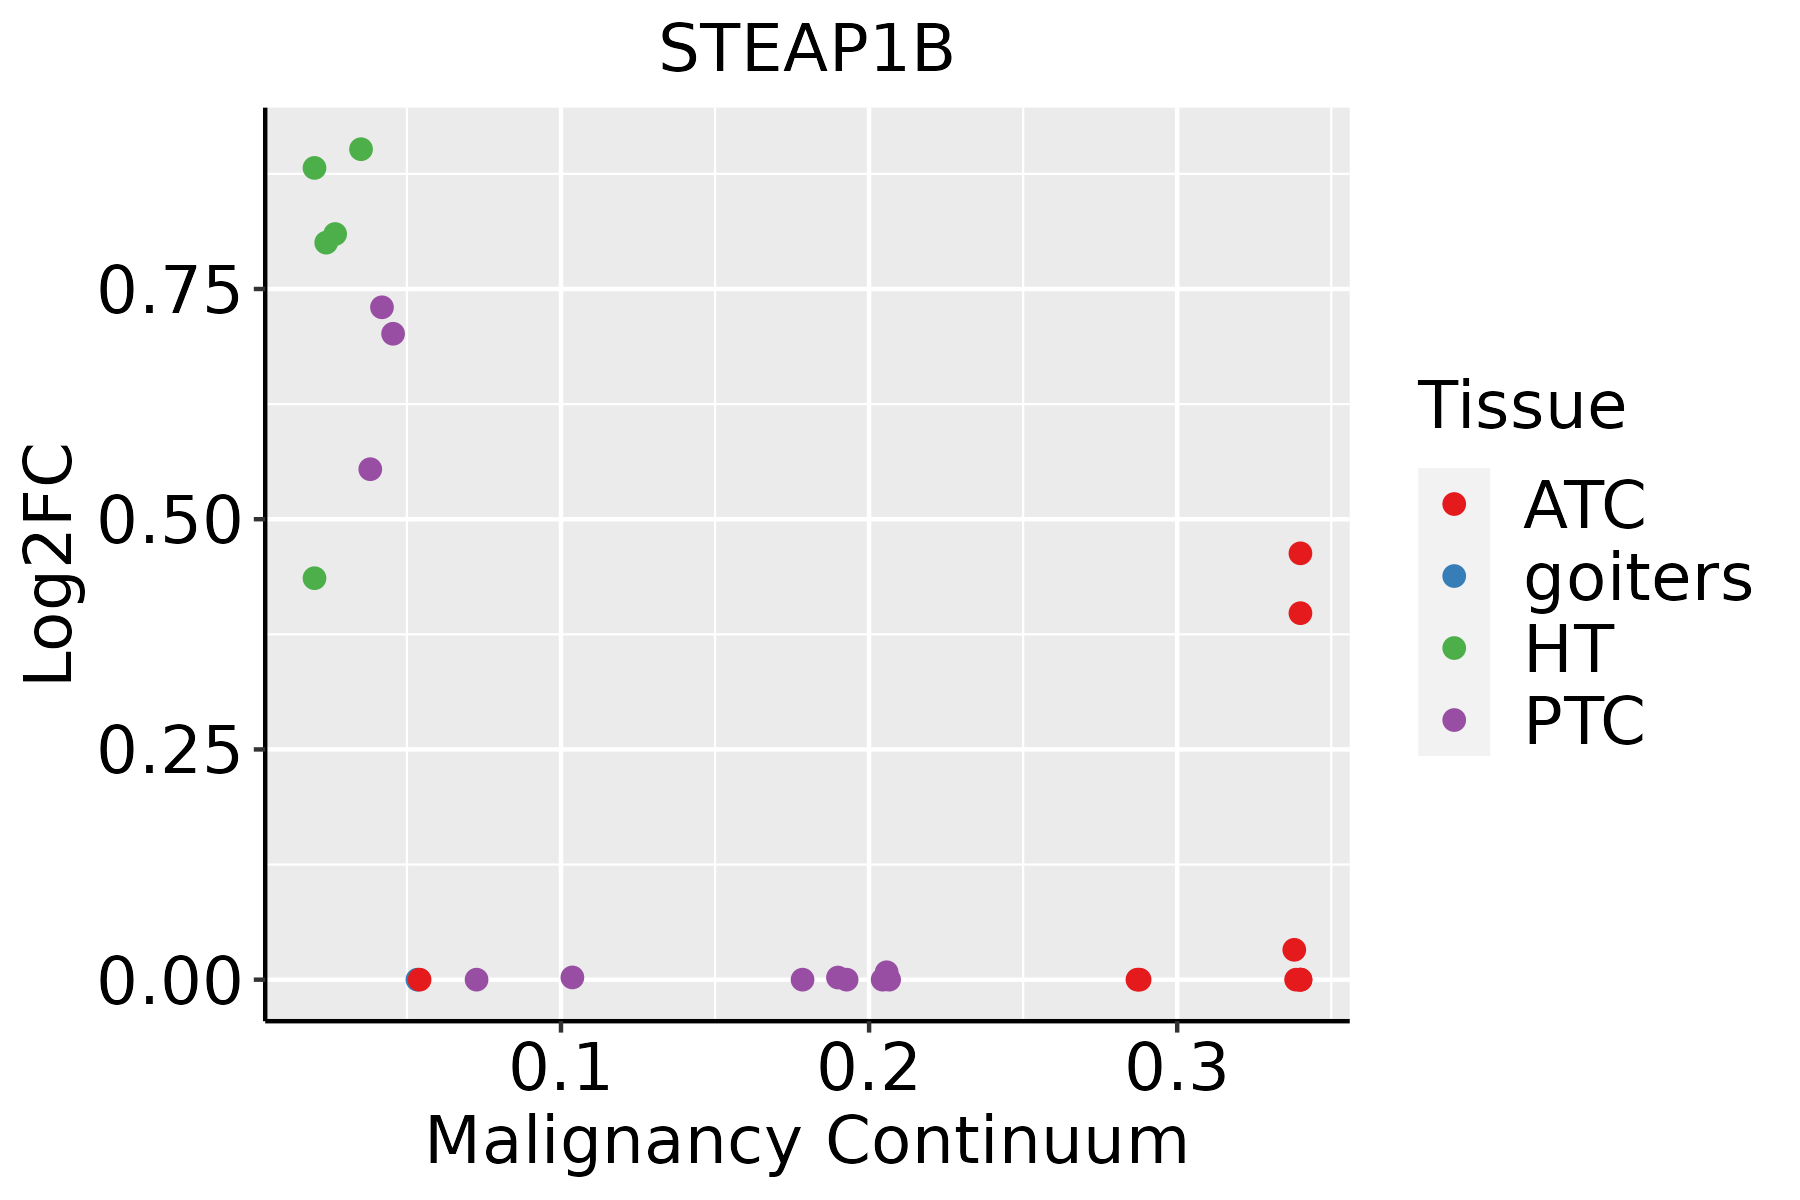 | ATC: Anaplastic thyroid cancer |
| HT: Hashimoto's thyroiditis | ||
| PTC: Papillary thyroid cancer |
| ∗log2FC in expression of this searched gene in stem-like cells from each diseased tissue sample relative to stem-like cells in normal samples in each tissue plotted against the malignancy continuum. Samples are colored based on if they are from different disease stage. |
Top |
Malignant transformation related pathway analysis |
| Find out the enriched GO biological processes and KEGG pathways involved in transition from healthy to precancer to cancer |
| Tissue | Disease Stage | Enriched GO biological Processes |
| Colorectum | AD |  |
| Colorectum | SER |  |
| Colorectum | MSS |  |
| Colorectum | MSI-H |  |
| Colorectum | FAP |  |
| ∗Top 15 enriched GO BP terms are showed in the bar plot of each disease state in each tissue. Each row represents a significant GO biological process which is colored according to the -log10(p.adjust). |
| Page: 1 2 3 4 5 6 7 8 9 |
| GO ID | Tissue | Disease Stage | Description | Gene Ratio | Bg Ratio | pvalue | p.adjust | Count |
| Page: 1 |
| Pathway ID | Tissue | Disease Stage | Description | Gene Ratio | Bg Ratio | pvalue | p.adjust | qvalue | Count |
| Page: 1 |
Top |
Cell-cell communication analysis |
| Identification of potential cell-cell interactions between two cell types and their ligand-receptor pairs for different disease states |
| Ligand | Receptor | LRpair | Pathway | Tissue | Disease Stage |
| Page: 1 |
Top |
Single-cell gene regulatory network inference analysis |
| Find out the significant the regulons (TFs) and the target genes of each regulon across cell types for different disease states |
| TF | Cell Type | Tissue | Disease Stage | Target Gene | RSS | Regulon Activity |
| ∗The dot plots of a searched regulon are shown for all cell subpopulations in each disease state of each tissue based on the regulon specific score inferred using pySCENIC and by calculating the average expression. |
| Page: 1 |
Top |
Somatic mutation of malignant transformation related genes |
| Annotation of somatic variants for genes involved in malignant transformation |
| Hugo Symbol | Variant Class | Variant Classification | dbSNP RS | HGVSc | HGVSp | HGVSp Short | SWISSPROT | BIOTYPE | SIFT | PolyPhen | Tumor Sample Barcode | Tissue | Histology | Sex | Age | Stage | Therapy Types | Drugs | Outcome |
| STEAP1B | SNV | Missense_Mutation | novel | c.125T>C | p.Val42Ala | p.V42A | Q6NZ63 | protein_coding | tolerated_low_confidence(1) | benign(0) | TCGA-AN-A046-01 | Breast | breast invasive carcinoma | Female | >=65 | I/II | Unknown | Unknown | SD |
| STEAP1B | SNV | Missense_Mutation | c.805N>A | p.Ala269Thr | p.A269T | Q6NZ63 | protein_coding | deleterious(0.02) | probably_damaging(0.996) | TCGA-C8-A275-01 | Breast | breast invasive carcinoma | Female | <65 | I/II | Unknown | Unknown | SD | |
| STEAP1B | SNV | Missense_Mutation | c.662C>T | p.Ser221Phe | p.S221F | Q6NZ63 | protein_coding | tolerated(0.06) | probably_damaging(0.99) | TCGA-FU-A3HZ-01 | Cervix | cervical & endocervical cancer | Female | <65 | I/II | Chemotherapy | cisplatin | CR | |
| STEAP1B | SNV | Missense_Mutation | c.997N>T | p.Asp333Tyr | p.D333Y | Q6NZ63 | protein_coding | possibly_damaging(0.861) | TCGA-AA-3510-01 | Colorectum | colon adenocarcinoma | Male | >=65 | I/II | Unknown | Unknown | SD | ||
| STEAP1B | SNV | Missense_Mutation | novel | c.748N>G | p.Phe250Val | p.F250V | Q6NZ63 | protein_coding | deleterious(0) | probably_damaging(0.999) | TCGA-AA-A010-01 | Colorectum | colon adenocarcinoma | Female | <65 | I/II | Chemotherapy | folinic | CR |
| STEAP1B | SNV | Missense_Mutation | novel | c.505N>G | p.Leu169Val | p.L169V | Q6NZ63 | protein_coding | deleterious(0.03) | benign(0.193) | TCGA-AA-A010-01 | Colorectum | colon adenocarcinoma | Female | <65 | I/II | Chemotherapy | folinic | CR |
| STEAP1B | SNV | Missense_Mutation | novel | c.271C>A | p.Leu91Met | p.L91M | Q6NZ63 | protein_coding | tolerated(0.06) | benign(0.045) | TCGA-F5-6814-01 | Colorectum | rectum adenocarcinoma | Male | <65 | I/II | Unknown | Unknown | SD |
| STEAP1B | SNV | Missense_Mutation | novel | c.360G>A | p.Met120Ile | p.M120I | Q6NZ63 | protein_coding | tolerated(0.7) | benign(0.08) | TCGA-A5-A2K5-01 | Endometrium | uterine corpus endometrioid carcinoma | Female | >=65 | I/II | Unknown | Unknown | SD |
| STEAP1B | SNV | Missense_Mutation | novel | c.671N>G | p.Ile224Ser | p.I224S | Q6NZ63 | protein_coding | deleterious(0) | probably_damaging(0.999) | TCGA-AJ-A3EK-01 | Endometrium | uterine corpus endometrioid carcinoma | Female | <65 | I/II | Chemotherapy | carboplatin | CR |
| STEAP1B | SNV | Missense_Mutation | novel | c.719N>A | p.Ser240Tyr | p.S240Y | Q6NZ63 | protein_coding | deleterious(0) | probably_damaging(0.999) | TCGA-AP-A1DV-01 | Endometrium | uterine corpus endometrioid carcinoma | Female | <65 | I/II | Unknown | Unknown | SD |
| Page: 1 2 3 4 |
Top |
Related drugs of malignant transformation related genes |
| Identification of chemicals and drugs interact with genes involved in malignant transfromation |
| (DGIdb 4.0) |
| Entrez ID | Symbol | Category | Interaction Types | Drug Claim Name | Drug Name | PMIDs |
| Page: 1 |

Copyright 2023-Present -The University of Texas Health Science Center at Houston |