Schematic overview of the cellular and molecular mechanisms involved in the cancer progression, including the proposed cellular and molecular mechanisms in cancer cells trajectory. AT1: alveolar type 1 cells; AT2: alveolar type 2 cells; AAH: atypical adenomatous hyperplasia; AIS: adenocarcinoma in situ; MIA: minimally invasive adenocarcinoma; IA: invasive adenocarcinoma; EMT: epithelial-mesenchymal transition

Home

Download

Statistics

Help

Contact

Center for Computational Systems Medicine
leaf

Gene summary

leaf

Malignant transformation analysis

leaf

Malignant transformation related pathway analysis

leaf

Cell-cell communication analysis

leaf

Single-cell gene regulatory network inference analysis

leaf

Somatic mutation of malignant transformation related genes

leaf

Related drugs of malignant transformation related genes

Gene: STAU1

Gene summary for STAU1

check button Gene summary.

Gene informationSpeciesHuman
Gene symbol

STAU1

Gene ID

6780

Gene namestaufen double-stranded RNA binding protein 1
Gene AliasPPP1R150
Cytomap20q13.13
Gene Typeprotein-coding
GO ID

GO:0006950

UniProtAcc

B3KRE0


Top

Malignant transformation analysis

check button Identification of the aberrant gene expression in precancerous and cancerous lesions by comparing the gene expression of stem-like cells in diseased tissues with normal stem cells
check button Malignant transformation involving gene list.
Entrez IDSymbolReplicatesSpeciesOrganTissueAdj P-valueLog2FCMalignancy
6780STAU1HTA11_3410_2000001011HumanColorectumAD8.89e-03-3.32e-010.0155
6780STAU1HTA11_347_2000001011HumanColorectumAD2.07e-063.82e-01-0.1954
6780STAU1HTA11_99999965062_69753HumanColorectumMSI-H1.18e-061.21e+000.3487
6780STAU1HTA11_99999965104_69814HumanColorectumMSS9.55e-066.01e-010.281
6780STAU1HTA11_99999971662_82457HumanColorectumMSS2.16e-109.52e-010.3859
6780STAU1A015-C-203HumanColorectumFAP8.16e-20-1.54e-01-0.1294
6780STAU1A015-C-204HumanColorectumFAP4.50e-02-2.01e-01-0.0228
6780STAU1A014-C-040HumanColorectumFAP4.82e-03-4.14e-01-0.1184
6780STAU1A002-C-201HumanColorectumFAP3.21e-05-9.57e-020.0324
6780STAU1A002-C-203HumanColorectumFAP3.51e-03-1.03e-010.2786
6780STAU1A001-C-119HumanColorectumFAP3.79e-031.63e-01-0.1557
6780STAU1A001-C-108HumanColorectumFAP3.64e-11-1.84e-01-0.0272
6780STAU1A002-C-205HumanColorectumFAP3.43e-12-1.54e-01-0.1236
6780STAU1A015-C-006HumanColorectumFAP1.07e-09-3.08e-01-0.0994
6780STAU1A015-C-106HumanColorectumFAP4.69e-08-1.46e-01-0.0511
6780STAU1A002-C-114HumanColorectumFAP1.10e-10-2.75e-01-0.1561
6780STAU1A015-C-104HumanColorectumFAP1.53e-22-3.74e-01-0.1899
6780STAU1A001-C-014HumanColorectumFAP8.29e-09-1.64e-010.0135
6780STAU1A002-C-016HumanColorectumFAP1.07e-16-2.12e-010.0521
6780STAU1A015-C-002HumanColorectumFAP4.01e-06-2.44e-01-0.0763
Page: 1 2 3 4 5 6 7 8 

check button Transcriptomic changes along malignancy continuum.
TissueExpression DynamicsAbbreviation
Colorectum (GSE201348)The image shows the transcriptomic changes along malignancy continuum.log2FC in expression of this searched gene in stem-like cells from each diseased tissue sample relative to stem-like cells in normal samples in each tissue plotted against the malignancy continuum. Samples are colored based on if they are from different disease stage.FAP: Familial adenomatous polyposis
CRC: Colorectal cancer
Colorectum (HTA11)The image shows the transcriptomic changes along malignancy continuum.log2FC in expression of this searched gene in stem-like cells from each diseased tissue sample relative to stem-like cells in normal samples in each tissue plotted against the malignancy continuum. Samples are colored based on if they are from different disease stage.AD: Adenomas
SER: Sessile serrated lesions
MSI-H: Microsatellite-high colorectal cancer
MSS: Microsatellite stable colorectal cancer
EsophagusThe image shows the transcriptomic changes along malignancy continuum.log2FC in expression of this searched gene in stem-like cells from each diseased tissue sample relative to stem-like cells in normal samples in each tissue plotted against the malignancy continuum. Samples are colored based on if they are from different disease stage.ESCC: Esophageal squamous cell carcinoma
HGIN: High-grade intraepithelial neoplasias
LGIN: Low-grade intraepithelial neoplasias
LiverThe image shows the transcriptomic changes along malignancy continuum.log2FC in expression of this searched gene in stem-like cells from each diseased tissue sample relative to stem-like cells in normal samples in each tissue plotted against the malignancy continuum. Samples are colored based on if they are from different disease stage.
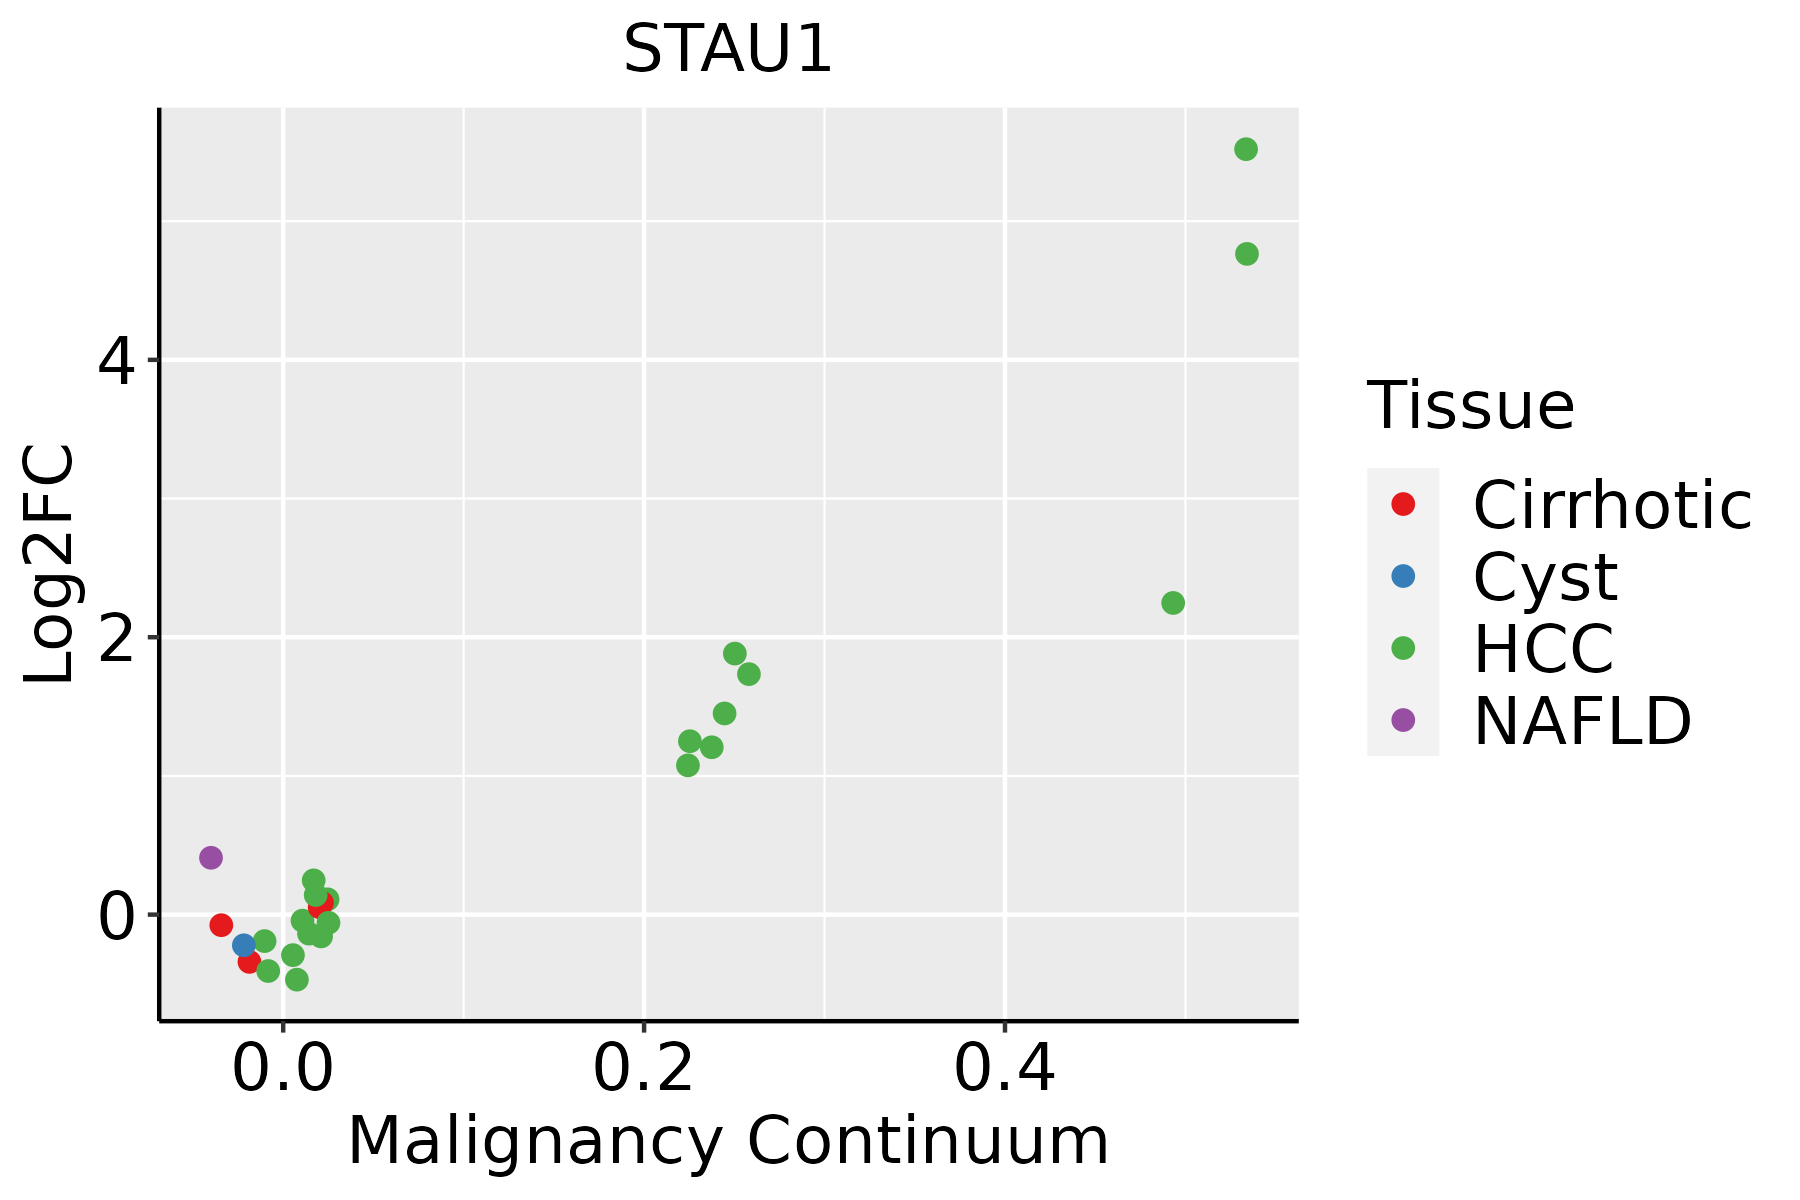
HCC: Hepatocellular carcinoma
NAFLD: Non-alcoholic fatty liver disease
Oral CavityThe image shows the transcriptomic changes along malignancy continuum.log2FC in expression of this searched gene in stem-like cells from each diseased tissue sample relative to stem-like cells in normal samples in each tissue plotted against the malignancy continuum. Samples are colored based on if they are from different disease stage.EOLP: Erosive Oral lichen planus
LP: leukoplakia
NEOLP: Non-erosive oral lichen planus
OSCC: Oral squamous cell carcinoma
SkinThe image shows the transcriptomic changes along malignancy continuum.log2FC in expression of this searched gene in stem-like cells from each diseased tissue sample relative to stem-like cells in normal samples in each tissue plotted against the malignancy continuum. Samples are colored based on if they are from different disease stage.
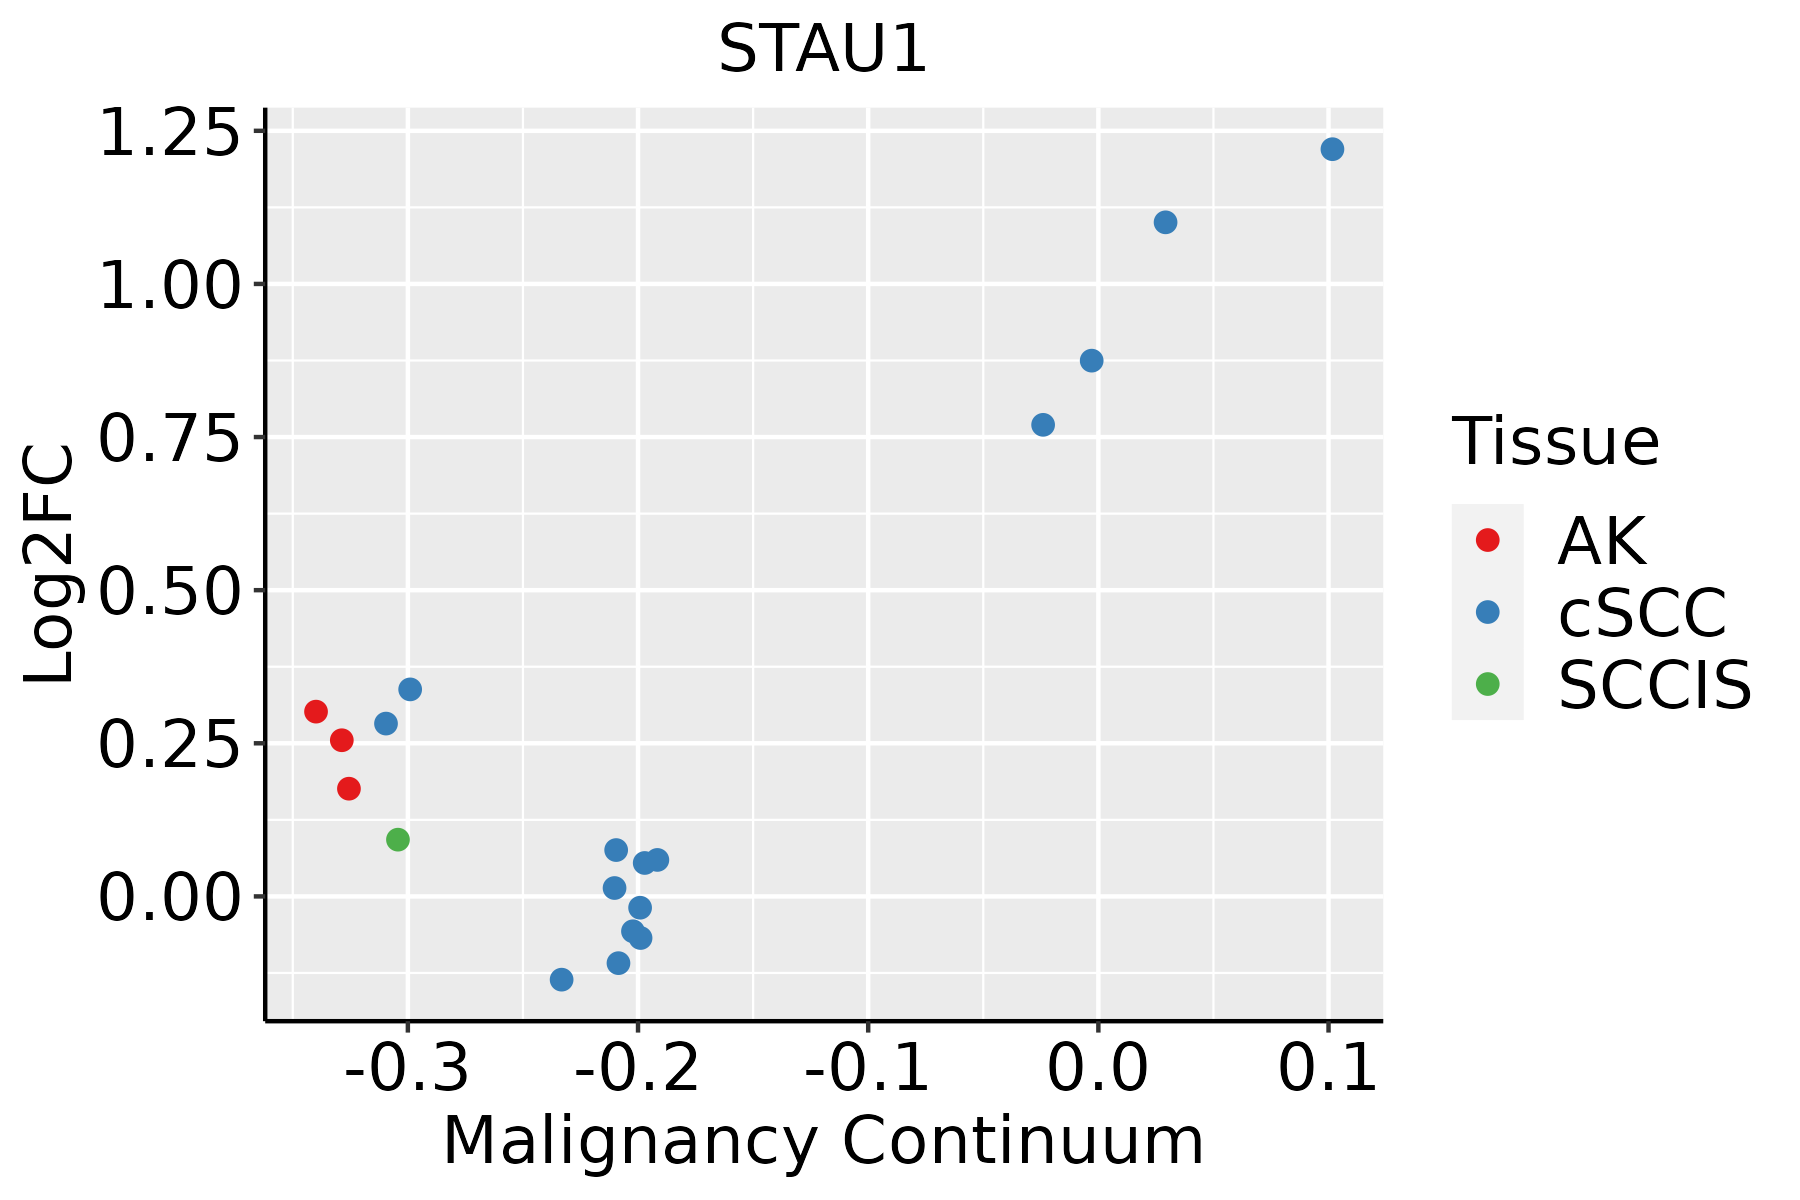
AK: Actinic keratosis
cSCC: Cutaneous squamous cell carcinoma
SCCIS:squamous cell carcinoma in situ
ThyroidThe image shows the transcriptomic changes along malignancy continuum.log2FC in expression of this searched gene in stem-like cells from each diseased tissue sample relative to stem-like cells in normal samples in each tissue plotted against the malignancy continuum. Samples are colored based on if they are from different disease stage.
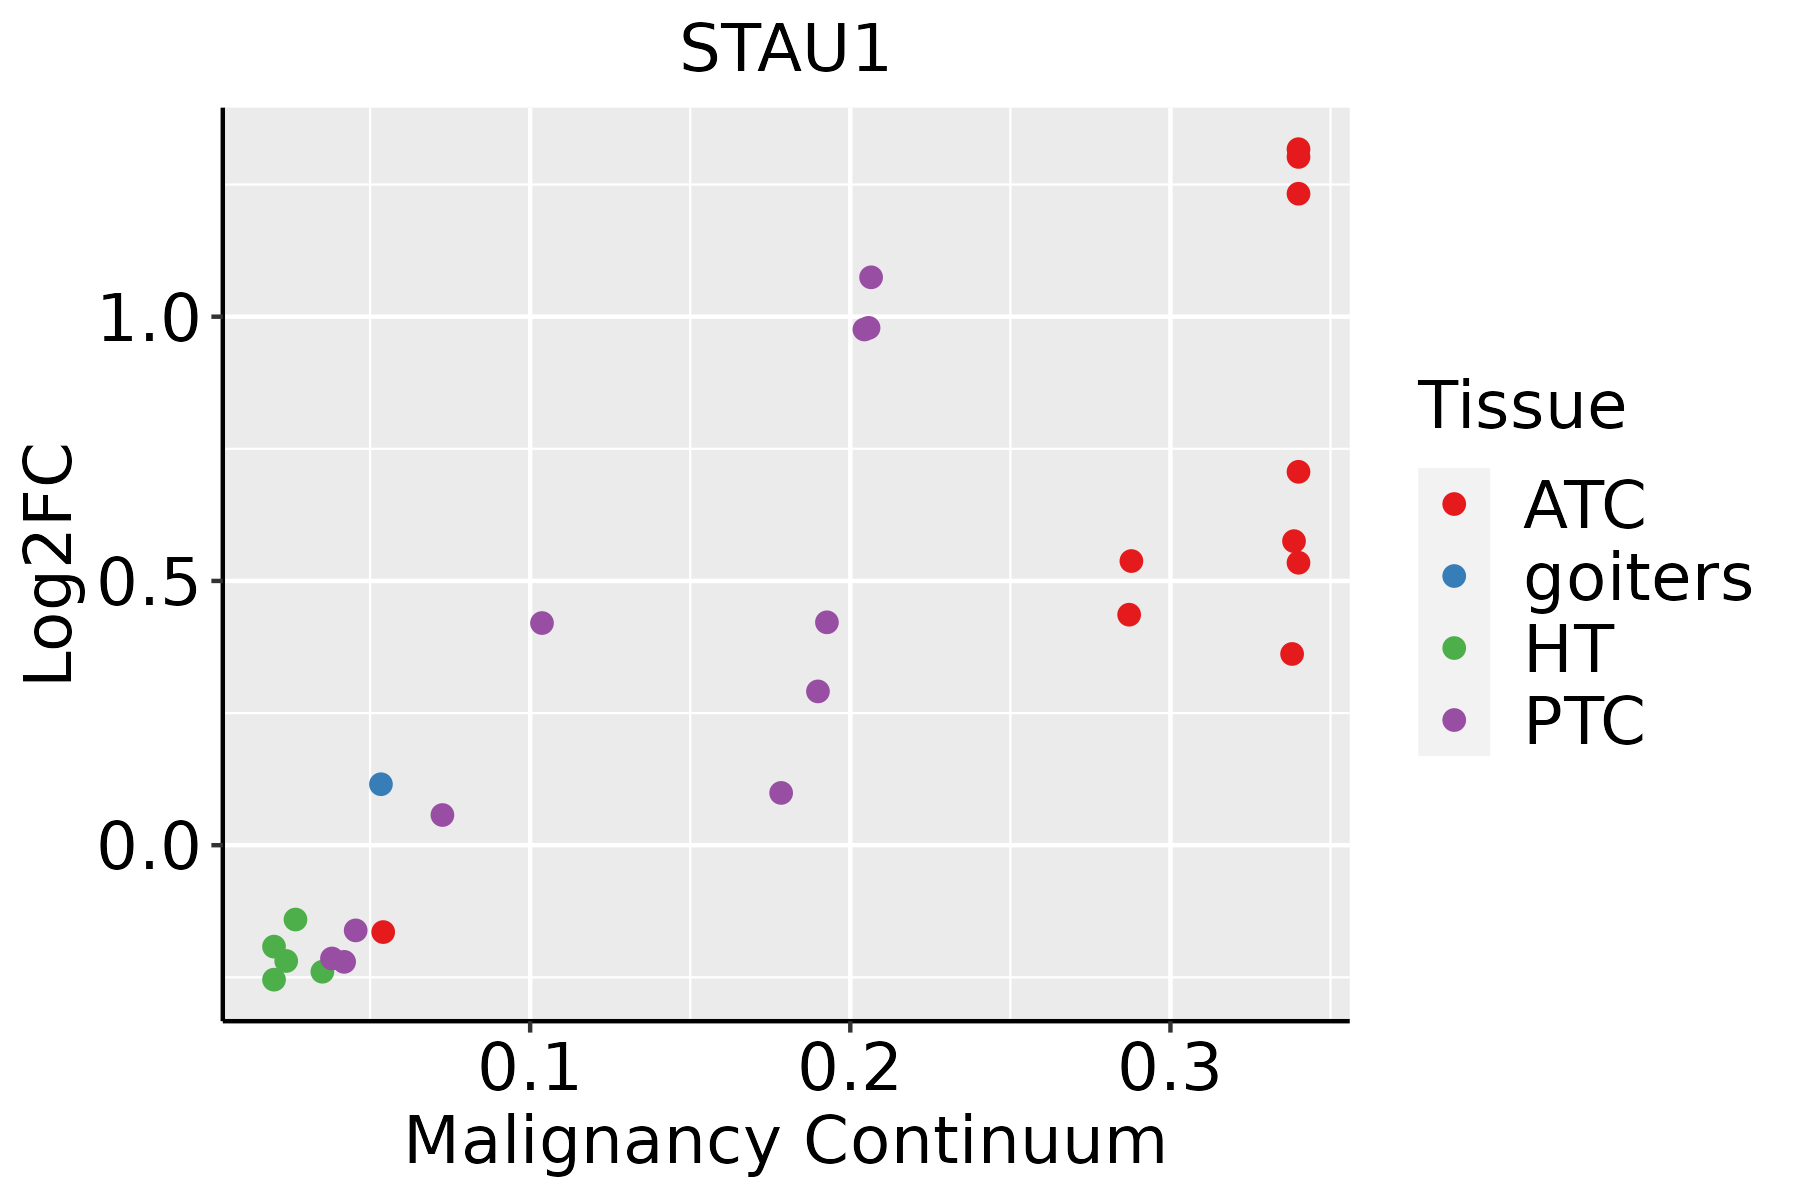
ATC: Anaplastic thyroid cancer
HT: Hashimoto's thyroiditis
PTC: Papillary thyroid cancer
∗log2FC in expression of this searched gene in stem-like cells from each diseased tissue sample relative to stem-like cells in normal samples in each tissue plotted against the malignancy continuum. Samples are colored based on if they are from different disease stage.

Top

Malignant transformation related pathway analysis

check buttonFind out the enriched GO biological processes and KEGG pathways involved in transition from healthy to precancer to cancer
check button Figure of enriched GO biological processes.
TissueDisease StageEnriched GO biological Processes
ColorectumADGO analysis - Figure of enriched GO biological processes: Top 15 enriched GO BP terms are showed in the bar plot of each disease state in each tissue. Each row represents a significant GO biological process which is colored according to the -log10(p.adjust).
ColorectumSERGO analysis - Figure of enriched GO biological processes: Top 15 enriched GO BP terms are showed in the bar plot of each disease state in each tissue. Each row represents a significant GO biological process which is colored according to the -log10(p.adjust).
ColorectumMSSGO analysis - Figure of enriched GO biological processes: Top 15 enriched GO BP terms are showed in the bar plot of each disease state in each tissue. Each row represents a significant GO biological process which is colored according to the -log10(p.adjust).
ColorectumMSI-HGO analysis - Figure of enriched GO biological processes: Top 15 enriched GO BP terms are showed in the bar plot of each disease state in each tissue. Each row represents a significant GO biological process which is colored according to the -log10(p.adjust).
ColorectumFAPGO analysis - Figure of enriched GO biological processes: Top 15 enriched GO BP terms are showed in the bar plot of each disease state in each tissue. Each row represents a significant GO biological process which is colored according to the -log10(p.adjust).
∗Top 15 enriched GO BP terms are showed in the bar plot of each disease state in each tissue. Each row represents a significant GO biological process which is colored according to the -log10(p.adjust).
Page: 1 2 3 4 5 6 7 8 9 

check button Enriched GO biological processes.
GO IDTissueDisease StageDescriptionGene RatioBg Ratiopvaluep.adjustCount
GO:0016032ColorectumADviral process168/3918415/187234.67e-203.66e-17168
GO:0019058ColorectumADviral life cycle119/3918317/187236.18e-128.23e-10119
GO:0006979ColorectumADresponse to oxidative stress145/3918446/187235.16e-093.23e-07145
GO:0062197ColorectumADcellular response to chemical stress109/3918337/187235.33e-071.95e-05109
GO:0048524ColorectumADpositive regulation of viral process31/391865/187231.33e-064.23e-0531
GO:0019079ColorectumADviral genome replication51/3918131/187231.83e-065.51e-0551
GO:0034599ColorectumADcellular response to oxidative stress94/3918288/187232.03e-066.02e-0594
GO:0050792ColorectumADregulation of viral process59/3918164/187235.95e-061.52e-0459
GO:1903900ColorectumADregulation of viral life cycle51/3918148/187239.01e-051.38e-0351
GO:0045069ColorectumADregulation of viral genome replication32/391885/187232.97e-043.60e-0332
GO:0045070ColorectumADpositive regulation of viral genome replication14/391830/187231.43e-031.22e-0214
GO:0099010ColorectumADmodification of postsynaptic structure9/391816/187232.06e-031.64e-029
GO:0099563ColorectumADmodification of synaptic structure11/391822/187232.32e-031.80e-0211
GO:0050808ColorectumADsynapse organization112/3918426/187234.25e-032.92e-02112
GO:00160322ColorectumMSSviral process157/3467415/187237.94e-216.19e-18157
GO:00190582ColorectumMSSviral life cycle111/3467317/187231.65e-122.95e-10111
GO:00069792ColorectumMSSresponse to oxidative stress128/3467446/187237.65e-083.81e-06128
GO:00621972ColorectumMSScellular response to chemical stress102/3467337/187239.73e-084.71e-06102
GO:00190792ColorectumMSSviral genome replication49/3467131/187232.73e-071.11e-0549
GO:00345992ColorectumMSScellular response to oxidative stress88/3467288/187234.58e-071.77e-0588
Page: 1 2 3 4 5 6 7 8 9 10 

check button Enriched KEGG pathways.
Pathway IDTissueDisease StageDescriptionGene RatioBg Ratiopvaluep.adjustqvalueCount
Page: 1 

Top

Cell-cell communication analysis

check buttonIdentification of potential cell-cell interactions between two cell types and their ligand-receptor pairs for different disease states
LigandReceptorLRpairPathwayTissueDisease Stage
Page: 1 

Top

Single-cell gene regulatory network inference analysis

check buttonFind out the significant the regulons (TFs) and the target genes of each regulon across cell types for different disease states
TFCell TypeTissueDisease StageTarget GeneRSSRegulon Activity
∗The dot plots of a searched regulon are shown for all cell subpopulations in each disease state of each tissue based on the regulon specific score inferred using pySCENIC and by calculating the average expression.
Page: 1 

Top

Somatic mutation of malignant transformation related genes

check buttonAnnotation of somatic variants for genes involved in malignant transformation
Hugo SymbolVariant ClassVariant ClassificationdbSNP RSHGVScHGVSpHGVSp ShortSWISSPROTBIOTYPESIFTPolyPhenTumor Sample BarcodeTissueHistologySexAgeStageTherapy TypesDrugsOutcome
STAU1SNVMissense_Mutationc.1169N>Tp.Ser390Phep.S390FO95793protein_codingdeleterious(0.01)benign(0.11)TCGA-A8-A09X-01Breastbreast invasive carcinomaFemale<65III/IVUnknownUnknownSD
STAU1SNVMissense_Mutationc.1362G>Ap.Met454Ilep.M454IO95793protein_codingtolerated(0.15)benign(0.009)TCGA-AC-A23H-01Breastbreast invasive carcinomaFemale>=65I/IIUnknownUnknownPD
STAU1SNVMissense_Mutationrs772776840c.1040A>Cp.Asn347Thrp.N347TO95793protein_codingtolerated(0.37)benign(0.18)TCGA-BH-A0DH-01Breastbreast invasive carcinomaFemale<65I/IIChemotherapycyclophosphamideSD
STAU1SNVMissense_Mutationc.382C>Gp.Gln128Glup.Q128EO95793protein_codingtolerated(0.25)benign(0.193)TCGA-D8-A1J9-01Breastbreast invasive carcinomaFemale<65I/IIUnknownUnknownSD
STAU1insertionFrame_Shift_Insnovelc.984_985insCTGAGCTCAGGAGTTCAAGACCAGCCTGGCCAACGTGp.Thr329LeufsTer71p.T329Lfs*71O95793protein_codingTCGA-AN-A049-01Breastbreast invasive carcinomaFemale<65I/IIUnknownUnknownSD
STAU1insertionNonsense_Mutationnovelc.951_952insTATAGCAATTTATAACTTAGAAAGTTp.Glu318TyrfsTer5p.E318Yfs*5O95793protein_codingTCGA-B6-A0IK-01Breastbreast invasive carcinomaFemale<65III/IVUnknownUnknownPD
STAU1SNVMissense_Mutationnovelc.471N>Cp.Leu157Phep.L157FO95793protein_codingdeleterious(0.02)probably_damaging(0.99)TCGA-EK-A3GK-01Cervixcervical & endocervical cancerFemale<65I/IIUnknownUnknownSD
STAU1SNVMissense_Mutationc.47N>Tp.Ser16Leup.S16LO95793protein_codingdeleterious_low_confidence(0.03)benign(0.011)TCGA-VS-A9UZ-01Cervixcervical & endocervical cancerFemale<65I/IIUnknownUnknownSD
STAU1SNVMissense_Mutationnovelc.1361T>Cp.Met454Thrp.M454TO95793protein_codingtolerated(1)benign(0.003)TCGA-A6-2672-01Colorectumcolon adenocarcinomaFemale>=65III/IVUnknownUnknownSD
STAU1SNVMissense_Mutationc.1580C>Ap.Pro527Glnp.P527QO95793protein_codingdeleterious(0)probably_damaging(0.987)TCGA-AA-3713-01Colorectumcolon adenocarcinomaMale>=65III/IVChemotherapy5-fluorouracilPR
Page: 1 2 3 4 5 6 

Top

Related drugs of malignant transformation related genes

check buttonIdentification of chemicals and drugs interact with genes involved in malignant transfromation
(DGIdb 4.0)
Entrez IDSymbolCategoryInteraction TypesDrug Claim NameDrug NamePMIDs
Page: 1