
|
|||||
|
 | |
| |
| |
| |
| |
| |
|
Gene: STAT6 |
Gene summary for STAT6 |
| Gene information | Species | Human | Gene symbol | STAT6 | Gene ID | 6778 |
| Gene name | signal transducer and activator of transcription 6 | |
| Gene Alias | D12S1644 | |
| Cytomap | 12q13.3 | |
| Gene Type | protein-coding | GO ID | GO:0000018 | UniProtAcc | P42226 |
Top |
Malignant transformation analysis |
| Identification of the aberrant gene expression in precancerous and cancerous lesions by comparing the gene expression of stem-like cells in diseased tissues with normal stem cells |
| Entrez ID | Symbol | Replicates | Species | Organ | Tissue | Adj P-value | Log2FC | Malignancy |
| 6778 | STAT6 | HTA11_3410_2000001011 | Human | Colorectum | AD | 2.10e-03 | 1.88e-01 | 0.0155 |
| 6778 | STAT6 | HTA11_2487_2000001011 | Human | Colorectum | SER | 5.99e-12 | 7.19e-01 | -0.1808 |
| 6778 | STAT6 | HTA11_1938_2000001011 | Human | Colorectum | AD | 1.50e-12 | 8.16e-01 | -0.0811 |
| 6778 | STAT6 | HTA11_78_2000001011 | Human | Colorectum | AD | 9.00e-06 | 5.15e-01 | -0.1088 |
| 6778 | STAT6 | HTA11_347_2000001011 | Human | Colorectum | AD | 7.49e-17 | 6.81e-01 | -0.1954 |
| 6778 | STAT6 | HTA11_411_2000001011 | Human | Colorectum | SER | 7.83e-05 | 1.01e+00 | -0.2602 |
| 6778 | STAT6 | HTA11_696_2000001011 | Human | Colorectum | AD | 3.67e-06 | 5.15e-01 | -0.1464 |
| 6778 | STAT6 | HTA11_866_2000001011 | Human | Colorectum | AD | 1.17e-12 | 6.63e-01 | -0.1001 |
| 6778 | STAT6 | HTA11_1391_2000001011 | Human | Colorectum | AD | 3.45e-14 | 8.46e-01 | -0.059 |
| 6778 | STAT6 | HTA11_866_3004761011 | Human | Colorectum | AD | 4.05e-11 | 5.42e-01 | 0.096 |
| 6778 | STAT6 | HTA11_8622_2000001021 | Human | Colorectum | SER | 1.78e-05 | 5.09e-01 | 0.0528 |
| 6778 | STAT6 | HTA11_10623_2000001011 | Human | Colorectum | AD | 3.34e-02 | 4.69e-01 | -0.0177 |
| 6778 | STAT6 | HTA11_10711_2000001011 | Human | Colorectum | AD | 7.97e-06 | 5.85e-01 | 0.0338 |
| 6778 | STAT6 | HTA11_7696_3000711011 | Human | Colorectum | AD | 3.24e-11 | 6.15e-01 | 0.0674 |
| 6778 | STAT6 | HTA11_99999970781_79442 | Human | Colorectum | MSS | 7.10e-06 | 5.32e-01 | 0.294 |
| 6778 | STAT6 | HTA11_99999971662_82457 | Human | Colorectum | MSS | 2.90e-10 | 7.40e-01 | 0.3859 |
| 6778 | STAT6 | A015-C-203 | Human | Colorectum | FAP | 2.50e-17 | -1.04e-01 | -0.1294 |
| 6778 | STAT6 | A002-C-201 | Human | Colorectum | FAP | 2.11e-02 | -4.04e-02 | 0.0324 |
| 6778 | STAT6 | A002-C-203 | Human | Colorectum | FAP | 4.72e-02 | 1.98e-01 | 0.2786 |
| 6778 | STAT6 | A001-C-108 | Human | Colorectum | FAP | 2.81e-05 | -1.12e-01 | -0.0272 |
| Page: 1 2 3 4 5 6 7 8 |
| Tissue | Expression Dynamics | Abbreviation |
| Colorectum (GSE201348) |  | FAP: Familial adenomatous polyposis |
| CRC: Colorectal cancer | ||
| Colorectum (HTA11) |  | AD: Adenomas |
| SER: Sessile serrated lesions | ||
| MSI-H: Microsatellite-high colorectal cancer | ||
| MSS: Microsatellite stable colorectal cancer | ||
| Esophagus | 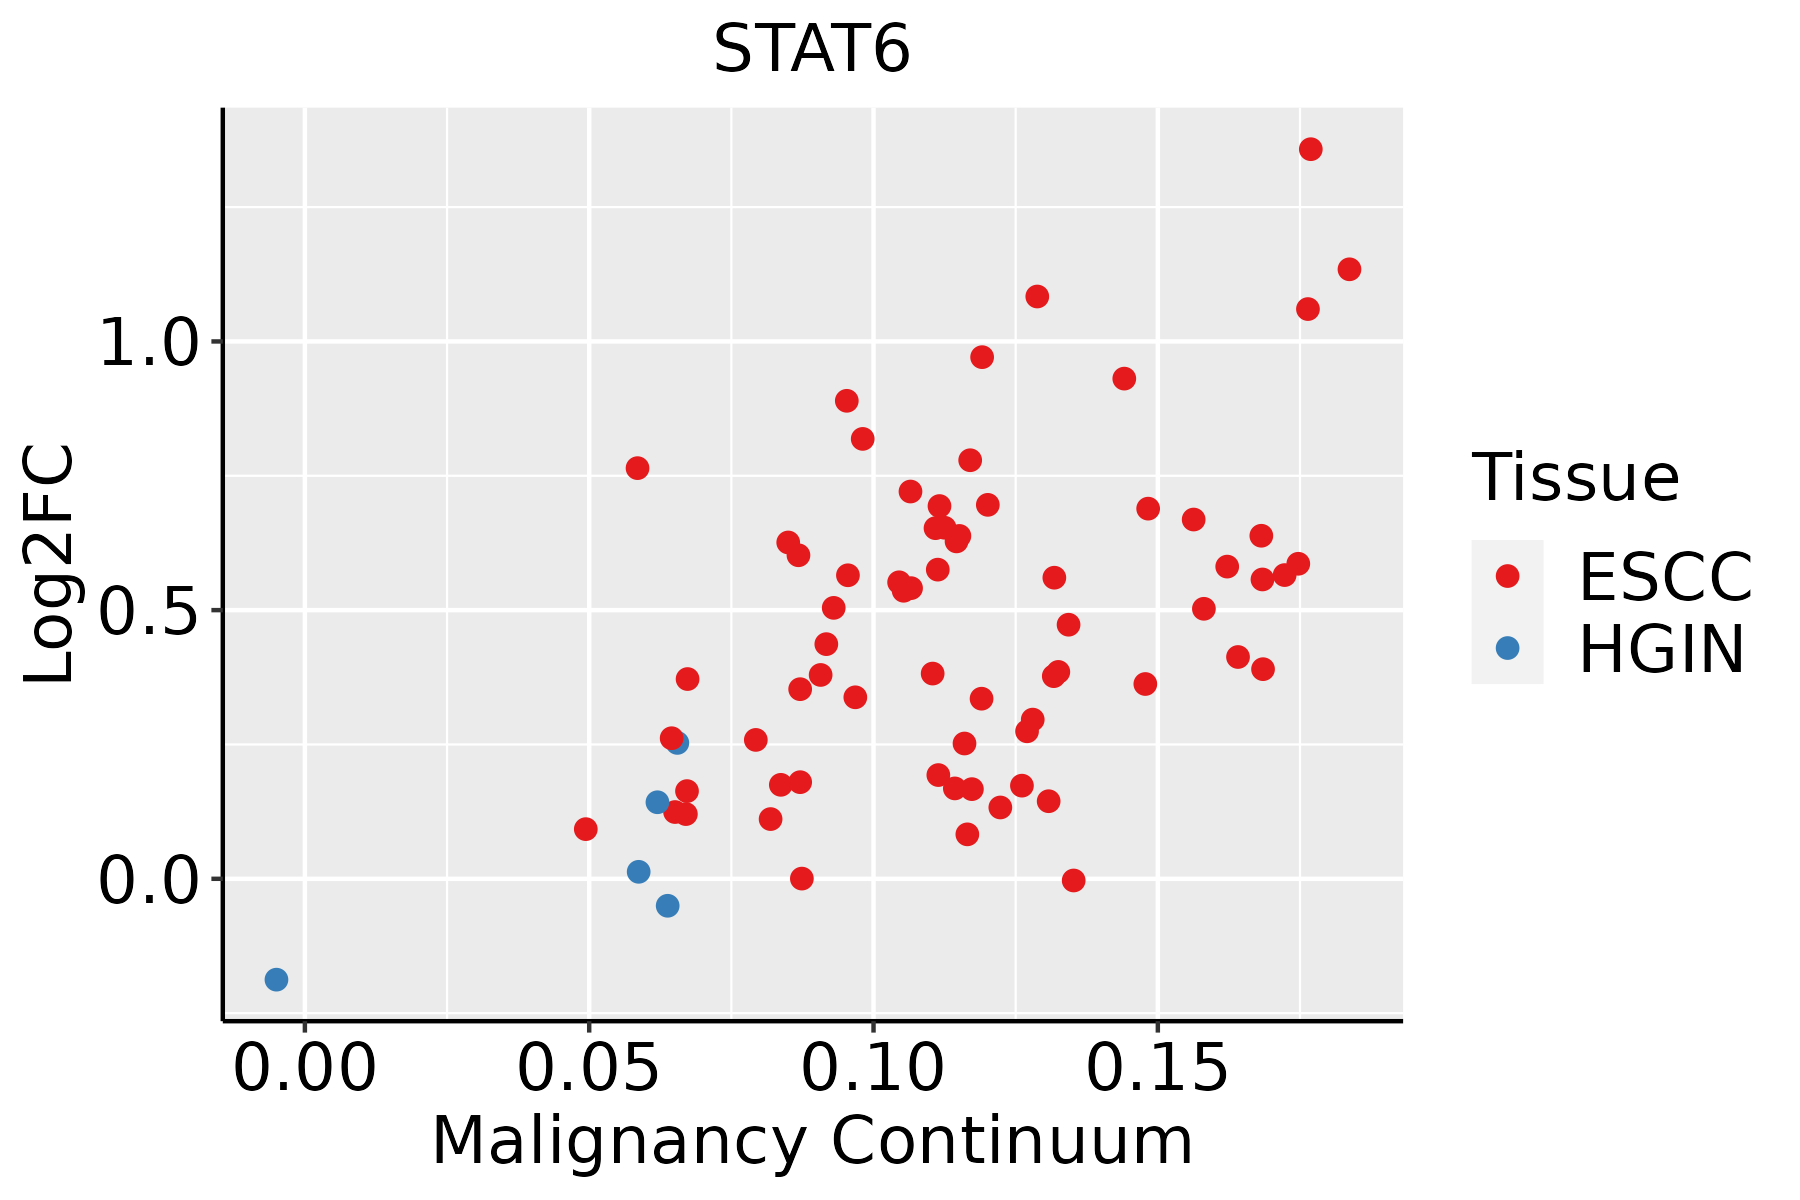 | ESCC: Esophageal squamous cell carcinoma |
| HGIN: High-grade intraepithelial neoplasias | ||
| LGIN: Low-grade intraepithelial neoplasias | ||
| Liver | 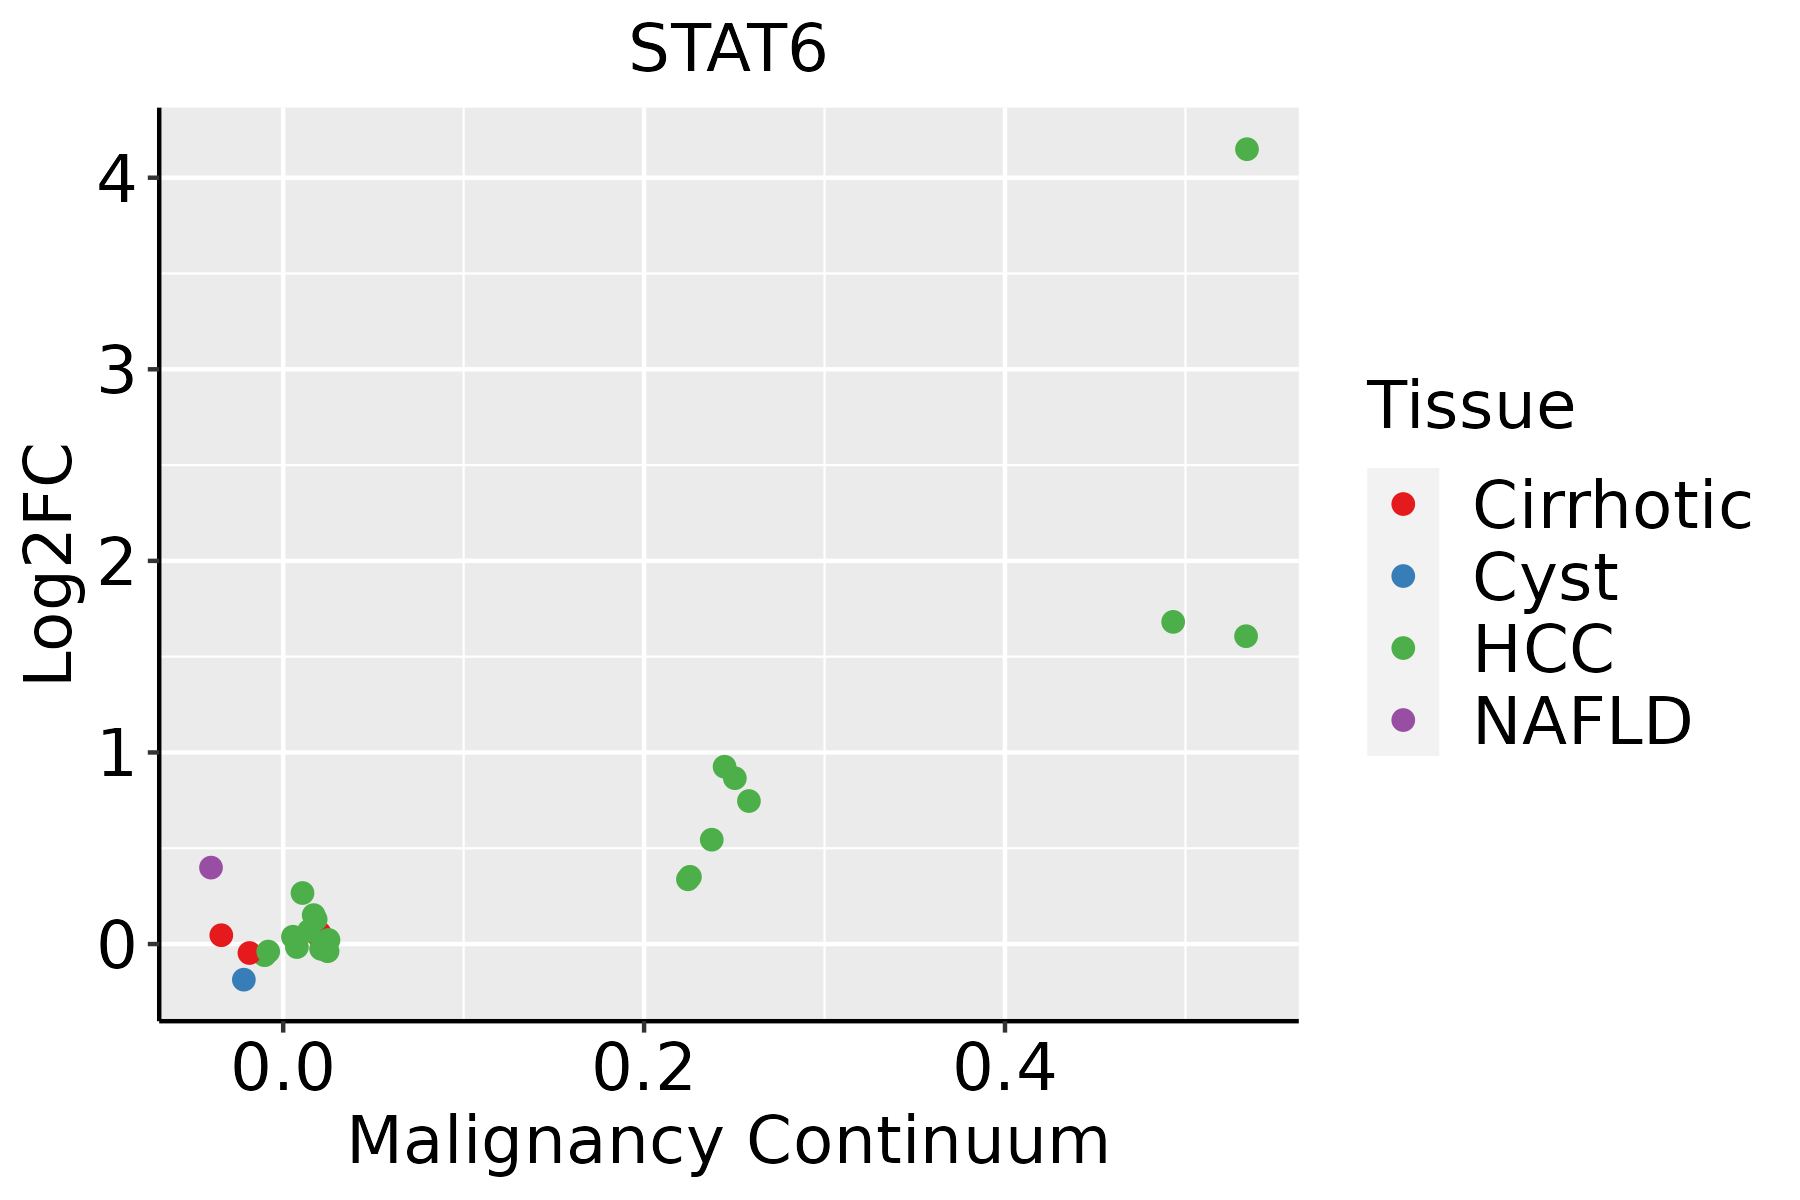 | HCC: Hepatocellular carcinoma |
| NAFLD: Non-alcoholic fatty liver disease | ||
| Oral Cavity | 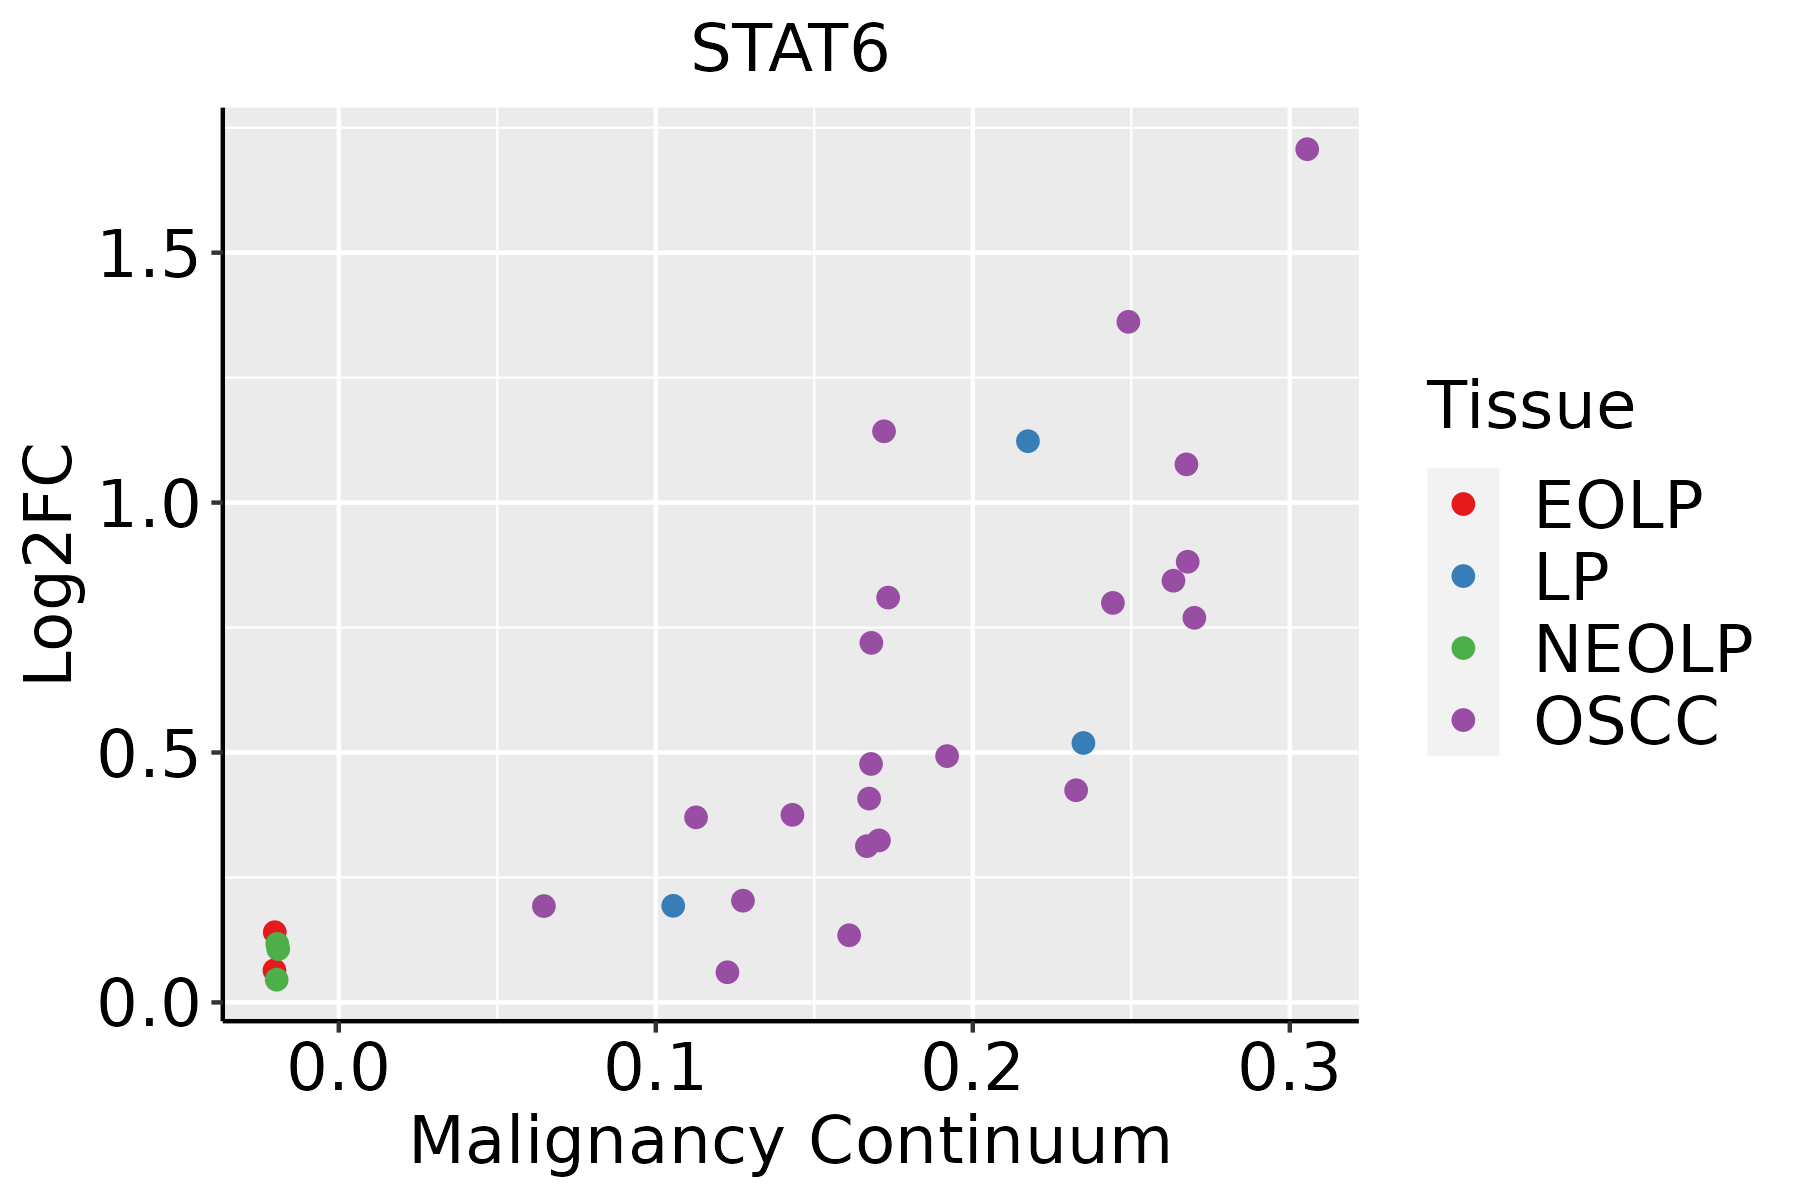 | EOLP: Erosive Oral lichen planus |
| LP: leukoplakia | ||
| NEOLP: Non-erosive oral lichen planus | ||
| OSCC: Oral squamous cell carcinoma | ||
| Prostate | 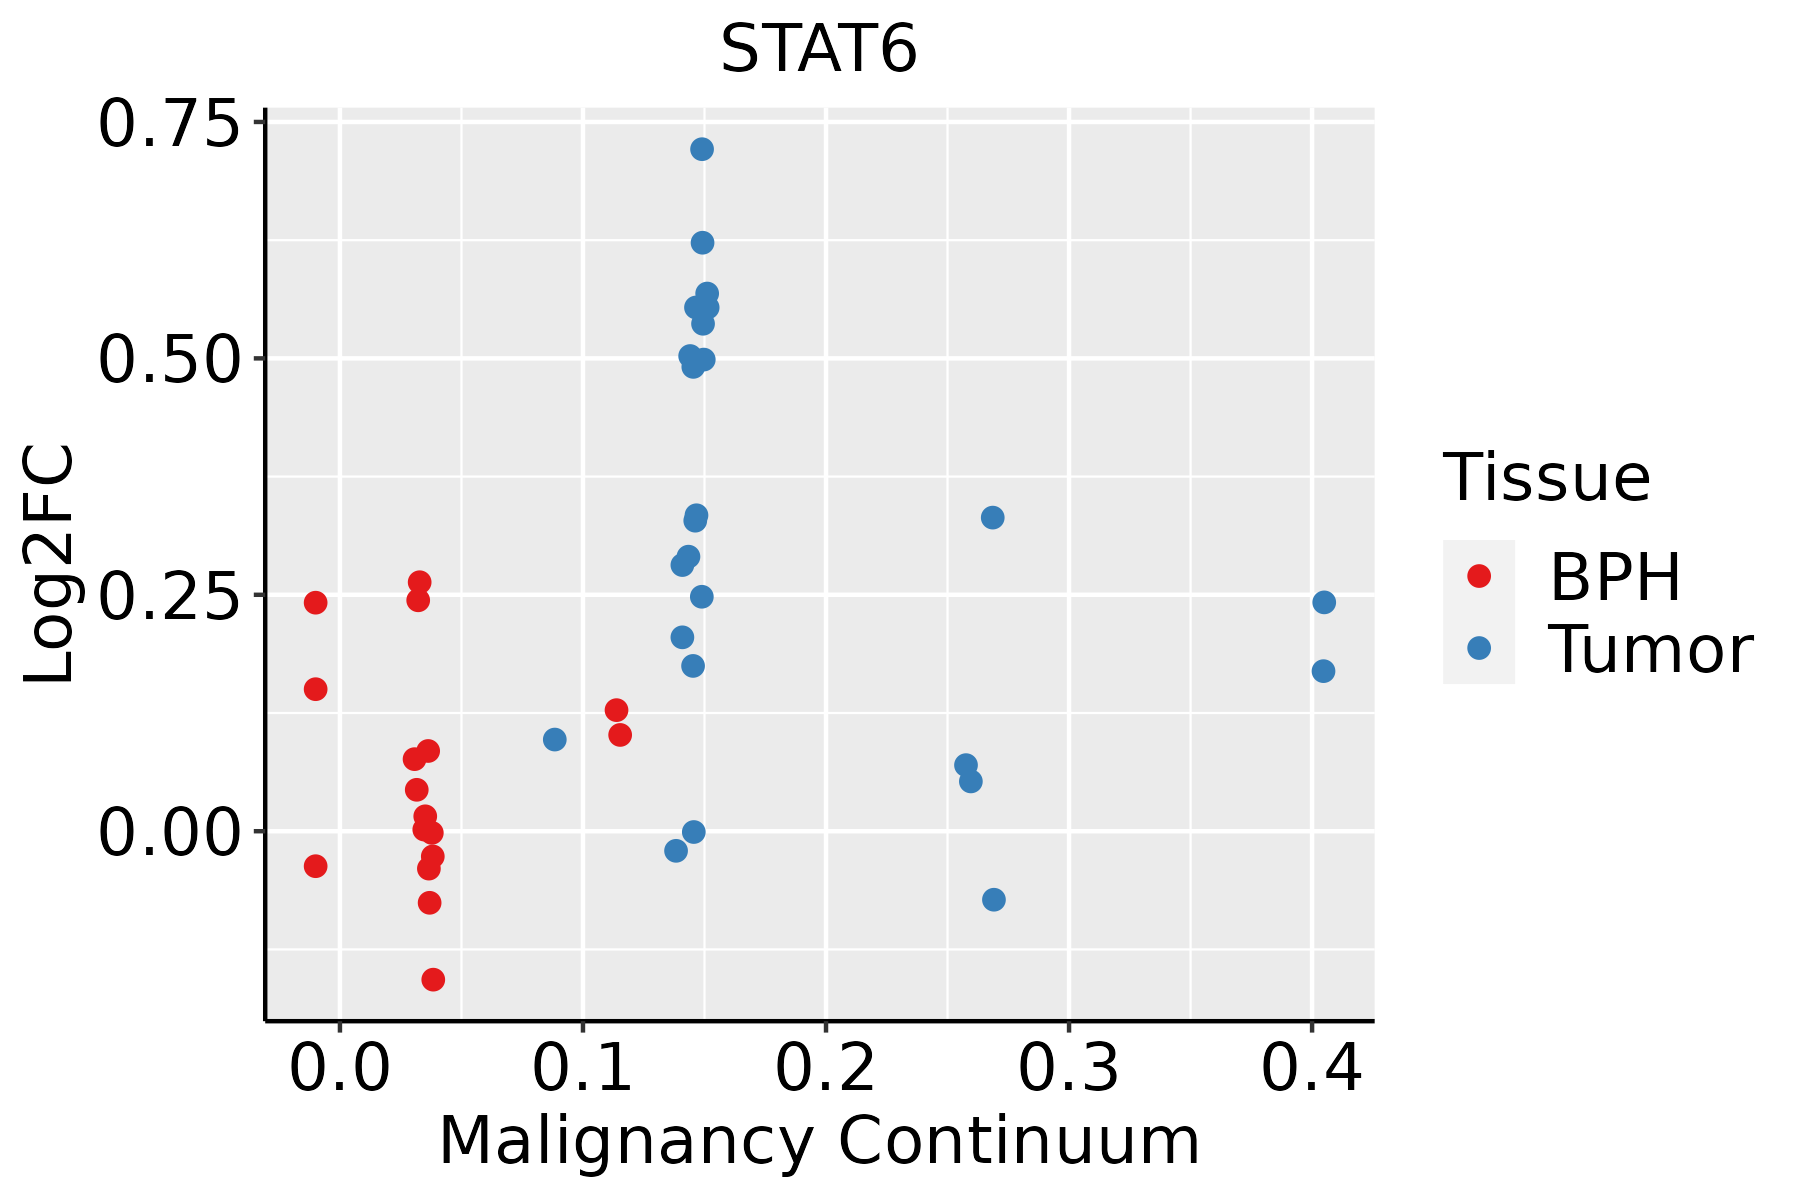 | BPH: Benign Prostatic Hyperplasia |
| Skin | 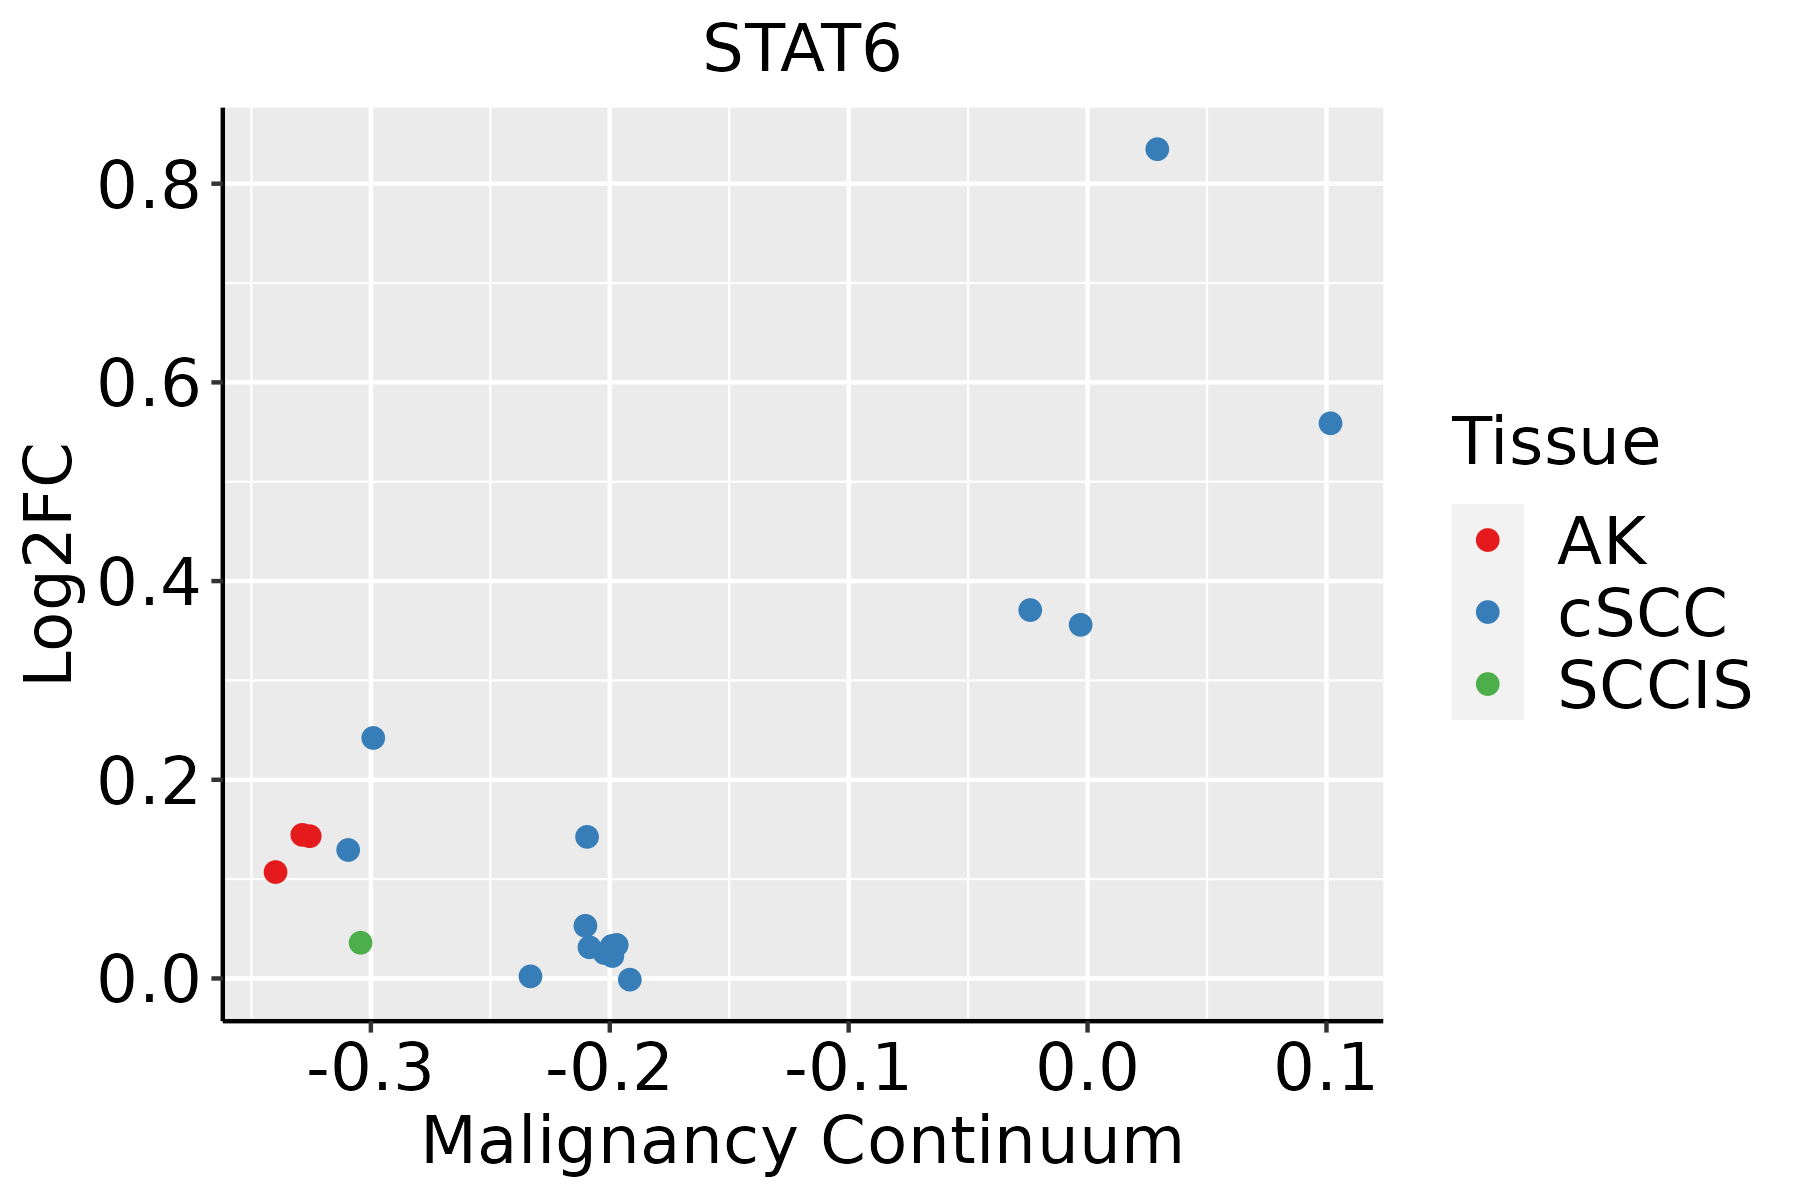 | AK: Actinic keratosis |
| cSCC: Cutaneous squamous cell carcinoma | ||
| SCCIS:squamous cell carcinoma in situ | ||
| Thyroid |  | ATC: Anaplastic thyroid cancer |
| HT: Hashimoto's thyroiditis | ||
| PTC: Papillary thyroid cancer |
| ∗log2FC in expression of this searched gene in stem-like cells from each diseased tissue sample relative to stem-like cells in normal samples in each tissue plotted against the malignancy continuum. Samples are colored based on if they are from different disease stage. |
Top |
Malignant transformation related pathway analysis |
| Find out the enriched GO biological processes and KEGG pathways involved in transition from healthy to precancer to cancer |
| Tissue | Disease Stage | Enriched GO biological Processes |
| Colorectum | AD |  |
| Colorectum | SER |  |
| Colorectum | MSS |  |
| Colorectum | MSI-H |  |
| Colorectum | FAP |  |
| ∗Top 15 enriched GO BP terms are showed in the bar plot of each disease state in each tissue. Each row represents a significant GO biological process which is colored according to the -log10(p.adjust). |
| Page: 1 2 3 4 5 6 7 8 9 |
| GO ID | Tissue | Disease Stage | Description | Gene Ratio | Bg Ratio | pvalue | p.adjust | Count |
| GO:0048732 | Colorectum | AD | gland development | 149/3918 | 436/18723 | 6.07e-11 | 6.33e-09 | 149 |
| GO:0006979 | Colorectum | AD | response to oxidative stress | 145/3918 | 446/18723 | 5.16e-09 | 3.23e-07 | 145 |
| GO:0051052 | Colorectum | AD | regulation of DNA metabolic process | 116/3918 | 359/18723 | 2.47e-07 | 1.00e-05 | 116 |
| GO:0051054 | Colorectum | AD | positive regulation of DNA metabolic process | 73/3918 | 201/18723 | 3.27e-07 | 1.29e-05 | 73 |
| GO:0062197 | Colorectum | AD | cellular response to chemical stress | 109/3918 | 337/18723 | 5.33e-07 | 1.95e-05 | 109 |
| GO:0000302 | Colorectum | AD | response to reactive oxygen species | 78/3918 | 222/18723 | 6.17e-07 | 2.21e-05 | 78 |
| GO:1901653 | Colorectum | AD | cellular response to peptide | 114/3918 | 359/18723 | 8.32e-07 | 2.88e-05 | 114 |
| GO:0030879 | Colorectum | AD | mammary gland development | 53/3918 | 137/18723 | 1.46e-06 | 4.58e-05 | 53 |
| GO:0071375 | Colorectum | AD | cellular response to peptide hormone stimulus | 95/3918 | 290/18723 | 1.50e-06 | 4.66e-05 | 95 |
| GO:0034599 | Colorectum | AD | cellular response to oxidative stress | 94/3918 | 288/18723 | 2.03e-06 | 6.02e-05 | 94 |
| GO:0043434 | Colorectum | AD | response to peptide hormone | 126/3918 | 414/18723 | 2.70e-06 | 7.86e-05 | 126 |
| GO:0042542 | Colorectum | AD | response to hydrogen peroxide | 52/3918 | 146/18723 | 2.83e-05 | 5.30e-04 | 52 |
| GO:0061180 | Colorectum | AD | mammary gland epithelium development | 28/3918 | 67/18723 | 8.74e-05 | 1.35e-03 | 28 |
| GO:0022612 | Colorectum | AD | gland morphogenesis | 42/3918 | 118/18723 | 1.62e-04 | 2.23e-03 | 42 |
| GO:0034614 | Colorectum | AD | cellular response to reactive oxygen species | 50/3918 | 155/18723 | 6.25e-04 | 6.49e-03 | 50 |
| GO:0050673 | Colorectum | AD | epithelial cell proliferation | 119/3918 | 437/18723 | 8.75e-04 | 8.51e-03 | 119 |
| GO:0060443 | Colorectum | AD | mammary gland morphogenesis | 18/3918 | 43/18723 | 1.51e-03 | 1.27e-02 | 18 |
| GO:0033598 | Colorectum | AD | mammary gland epithelial cell proliferation | 12/3918 | 26/18723 | 3.47e-03 | 2.51e-02 | 12 |
| GO:0120162 | Colorectum | AD | positive regulation of cold-induced thermogenesis | 32/3918 | 97/18723 | 3.74e-03 | 2.63e-02 | 32 |
| GO:0106106 | Colorectum | AD | cold-induced thermogenesis | 43/3918 | 144/18723 | 7.05e-03 | 4.31e-02 | 43 |
| Page: 1 2 3 4 5 6 7 8 9 10 11 12 13 14 15 16 17 18 19 20 21 |
| Pathway ID | Tissue | Disease Stage | Description | Gene Ratio | Bg Ratio | pvalue | p.adjust | qvalue | Count |
| hsa04217 | Colorectum | SER | Necroptosis | 47/1580 | 159/8465 | 5.21e-04 | 4.44e-03 | 3.22e-03 | 47 |
| hsa042171 | Colorectum | SER | Necroptosis | 47/1580 | 159/8465 | 5.21e-04 | 4.44e-03 | 3.22e-03 | 47 |
| hsa05161 | Colorectum | MSS | Hepatitis B | 48/1875 | 162/8465 | 1.53e-02 | 4.93e-02 | 3.02e-02 | 48 |
| hsa051611 | Colorectum | MSS | Hepatitis B | 48/1875 | 162/8465 | 1.53e-02 | 4.93e-02 | 3.02e-02 | 48 |
| hsa051619 | Esophagus | ESCC | Hepatitis B | 108/4205 | 162/8465 | 7.68e-06 | 4.15e-05 | 2.12e-05 | 108 |
| hsa046599 | Esophagus | ESCC | Th17 cell differentiation | 68/4205 | 108/8465 | 3.53e-03 | 9.30e-03 | 4.76e-03 | 68 |
| hsa046585 | Esophagus | ESCC | Th1 and Th2 cell differentiation | 58/4205 | 92/8465 | 6.49e-03 | 1.60e-02 | 8.19e-03 | 58 |
| hsa0516114 | Esophagus | ESCC | Hepatitis B | 108/4205 | 162/8465 | 7.68e-06 | 4.15e-05 | 2.12e-05 | 108 |
| hsa0465914 | Esophagus | ESCC | Th17 cell differentiation | 68/4205 | 108/8465 | 3.53e-03 | 9.30e-03 | 4.76e-03 | 68 |
| hsa0465812 | Esophagus | ESCC | Th1 and Th2 cell differentiation | 58/4205 | 92/8465 | 6.49e-03 | 1.60e-02 | 8.19e-03 | 58 |
| hsa051612 | Liver | HCC | Hepatitis B | 91/4020 | 162/8465 | 1.56e-02 | 3.76e-02 | 2.09e-02 | 91 |
| hsa0516111 | Liver | HCC | Hepatitis B | 91/4020 | 162/8465 | 1.56e-02 | 3.76e-02 | 2.09e-02 | 91 |
| hsa051618 | Oral cavity | OSCC | Hepatitis B | 103/3704 | 162/8465 | 2.34e-07 | 1.51e-06 | 7.69e-07 | 103 |
| hsa046598 | Oral cavity | OSCC | Th17 cell differentiation | 65/3704 | 108/8465 | 4.02e-04 | 1.25e-03 | 6.35e-04 | 65 |
| hsa046584 | Oral cavity | OSCC | Th1 and Th2 cell differentiation | 53/3704 | 92/8465 | 5.00e-03 | 1.20e-02 | 6.13e-03 | 53 |
| hsa0516113 | Oral cavity | OSCC | Hepatitis B | 103/3704 | 162/8465 | 2.34e-07 | 1.51e-06 | 7.69e-07 | 103 |
| hsa0465913 | Oral cavity | OSCC | Th17 cell differentiation | 65/3704 | 108/8465 | 4.02e-04 | 1.25e-03 | 6.35e-04 | 65 |
| hsa0465811 | Oral cavity | OSCC | Th1 and Th2 cell differentiation | 53/3704 | 92/8465 | 5.00e-03 | 1.20e-02 | 6.13e-03 | 53 |
| hsa0516122 | Oral cavity | LP | Hepatitis B | 65/2418 | 162/8465 | 9.31e-04 | 4.43e-03 | 2.86e-03 | 65 |
| hsa0421714 | Oral cavity | LP | Necroptosis | 59/2418 | 159/8465 | 1.15e-02 | 3.91e-02 | 2.52e-02 | 59 |
| Page: 1 2 3 |
Top |
Cell-cell communication analysis |
| Identification of potential cell-cell interactions between two cell types and their ligand-receptor pairs for different disease states |
| Ligand | Receptor | LRpair | Pathway | Tissue | Disease Stage |
| Page: 1 |
Top |
Single-cell gene regulatory network inference analysis |
| Find out the significant the regulons (TFs) and the target genes of each regulon across cell types for different disease states |
| TF | Cell Type | Tissue | Disease Stage | Target Gene | RSS | Regulon Activity |
| STAT6 | CD8TCM | Colorectum | Healthy | MICALL1,PNPLA6,KIFC3, etc. | 2.74e-02 |  |
| STAT6 | MAIT | Colorectum | MSI-H | MICALL1,PNPLA6,KIFC3, etc. | 3.65e-02 |  |
| STAT6 | CFIB | Colorectum | AD | ESRP1,CES2,LLGL2, etc. | 1.80e-01 |  |
| STAT6 | ICAF | Colorectum | CRC | ESRP1,CES2,LLGL2, etc. | 3.21e-02 |  |
| STAT6 | ADIPO | Colorectum | FAP | ESRP1,CES2,LLGL2, etc. | 1.17e-02 |  |
| STAT6 | MVA | Colorectum | Healthy | ESRP1,CES2,LLGL2, etc. | 8.25e-03 | |
| STAT6 | PCV | Colorectum | Healthy | ESRP1,CES2,LLGL2, etc. | 0.00e+00 | |
| STAT6 | INCAF | Colorectum | SER | ESRP1,CES2,LLGL2, etc. | 1.61e-01 |  |
| STAT6 | SURF | Endometrium | AEH | C3,LAMA5,PGGHG, etc. | 2.65e-01 |  |
| STAT6 | MVA | Lung | Healthy | MT-ND1,MEAK7,IGIP, etc. | 8.70e-02 |  |
| ∗The dot plots of a searched regulon are shown for all cell subpopulations in each disease state of each tissue based on the regulon specific score inferred using pySCENIC and by calculating the average expression. |
| Page: 1 2 |
Top |
Somatic mutation of malignant transformation related genes |
| Annotation of somatic variants for genes involved in malignant transformation |
| Hugo Symbol | Variant Class | Variant Classification | dbSNP RS | HGVSc | HGVSp | HGVSp Short | SWISSPROT | BIOTYPE | SIFT | PolyPhen | Tumor Sample Barcode | Tissue | Histology | Sex | Age | Stage | Therapy Types | Drugs | Outcome |
| STAT6 | SNV | Missense_Mutation | novel | c.2233N>G | p.Leu745Val | p.L745V | P42226 | protein_coding | tolerated_low_confidence(0.13) | benign(0.055) | TCGA-3C-AALK-01 | Breast | breast invasive carcinoma | Female | <65 | I/II | Chemotherapy | docetaxel | SD |
| STAT6 | SNV | Missense_Mutation | novel | c.85N>T | p.Leu29Phe | p.L29F | P42226 | protein_coding | tolerated(0.35) | benign(0.085) | TCGA-A2-A0CK-01 | Breast | breast invasive carcinoma | Female | <65 | III/IV | Chemotherapy | taxotere | CR |
| STAT6 | SNV | Missense_Mutation | novel | c.257N>A | p.Ser86Asn | p.S86N | P42226 | protein_coding | tolerated(0.98) | benign(0.001) | TCGA-AN-A046-01 | Breast | breast invasive carcinoma | Female | >=65 | I/II | Unknown | Unknown | SD |
| STAT6 | SNV | Missense_Mutation | rs778871413 | c.173N>T | p.Ser58Leu | p.S58L | P42226 | protein_coding | deleterious(0.04) | possibly_damaging(0.498) | TCGA-BH-A0B6-01 | Breast | breast invasive carcinoma | Female | <65 | I/II | Unknown | Unknown | SD |
| STAT6 | SNV | Missense_Mutation | c.737N>A | p.Gly246Asp | p.G246D | P42226 | protein_coding | tolerated(0.15) | benign(0.142) | TCGA-BH-A0B8-01 | Breast | breast invasive carcinoma | Female | <65 | I/II | Hormone Therapy | arimidex | SD | |
| STAT6 | SNV | Missense_Mutation | novel | c.1693N>A | p.Asp565Asn | p.D565N | P42226 | protein_coding | deleterious(0) | probably_damaging(0.999) | TCGA-D8-A1XF-01 | Breast | breast invasive carcinoma | Female | <65 | I/II | Chemotherapy | adriamycin+cyclophosphamide | SD |
| STAT6 | SNV | Missense_Mutation | c.1864G>T | p.Asp622Tyr | p.D622Y | P42226 | protein_coding | deleterious(0) | possibly_damaging(0.67) | TCGA-EW-A1P4-01 | Breast | breast invasive carcinoma | Female | <65 | I/II | Chemotherapy | docetaxel | SD | |
| STAT6 | deletion | Frame_Shift_Del | novel | c.398delN | p.Gly133AlafsTer9 | p.G133Afs*9 | P42226 | protein_coding | TCGA-D8-A27V-01 | Breast | breast invasive carcinoma | Female | <65 | I/II | Hormone Therapy | tamoxiphen | SD | ||
| STAT6 | SNV | Missense_Mutation | novel | c.1669N>A | p.Gly557Arg | p.G557R | P42226 | protein_coding | deleterious(0) | probably_damaging(1) | TCGA-2W-A8YY-01 | Cervix | cervical & endocervical cancer | Female | <65 | I/II | Chemotherapy | cisplatin | CR |
| STAT6 | SNV | Missense_Mutation | novel | c.2059N>T | p.Asp687Tyr | p.D687Y | P42226 | protein_coding | deleterious(0.03) | possibly_damaging(0.62) | TCGA-C5-A7XC-01 | Cervix | cervical & endocervical cancer | Female | <65 | I/II | Unknown | Unknown | SD |
| Page: 1 2 3 4 5 6 7 |
Top |
Related drugs of malignant transformation related genes |
| Identification of chemicals and drugs interact with genes involved in malignant transfromation |
| (DGIdb 4.0) |
| Entrez ID | Symbol | Category | Interaction Types | Drug Claim Name | Drug Name | PMIDs |
| 6778 | STAT6 | TRANSCRIPTION FACTOR, KINASE, CLINICALLY ACTIONABLE, DRUGGABLE GENOME | NSC-607097 | CHEMBL1374370 | ||
| 6778 | STAT6 | TRANSCRIPTION FACTOR, KINASE, CLINICALLY ACTIONABLE, DRUGGABLE GENOME | GW7074 | CHEMBL72365 | ||
| 6778 | STAT6 | TRANSCRIPTION FACTOR, KINASE, CLINICALLY ACTIONABLE, DRUGGABLE GENOME | DOXORUBICIN HYDROCHLORIDE | DOXORUBICIN HYDROCHLORIDE | ||
| 6778 | STAT6 | TRANSCRIPTION FACTOR, KINASE, CLINICALLY ACTIONABLE, DRUGGABLE GENOME | EOTAXIN | 12576300 | ||
| 6778 | STAT6 | TRANSCRIPTION FACTOR, KINASE, CLINICALLY ACTIONABLE, DRUGGABLE GENOME | GLUCOCORTICOID | 15544592 | ||
| 6778 | STAT6 | TRANSCRIPTION FACTOR, KINASE, CLINICALLY ACTIONABLE, DRUGGABLE GENOME | ELLIPTECINE | ELLIPTECINE | ||
| 6778 | STAT6 | TRANSCRIPTION FACTOR, KINASE, CLINICALLY ACTIONABLE, DRUGGABLE GENOME | NSC-176327 | CHEMBL363332 | ||
| 6778 | STAT6 | TRANSCRIPTION FACTOR, KINASE, CLINICALLY ACTIONABLE, DRUGGABLE GENOME | NSC-119889 | CHEMBL516616 | ||
| 6778 | STAT6 | TRANSCRIPTION FACTOR, KINASE, CLINICALLY ACTIONABLE, DRUGGABLE GENOME | SU-6656 | CHEMBL605003 | ||
| 6778 | STAT6 | TRANSCRIPTION FACTOR, KINASE, CLINICALLY ACTIONABLE, DRUGGABLE GENOME | SANGUINARIUM | SANGUINARIUM |
| Page: 1 2 |

Copyright 2023-Present -The University of Texas Health Science Center at Houston |