
|
|||||
|
 | |
| |
| |
| |
| |
| |
|
Gene: STAT5A |
Gene summary for STAT5A |
| Gene information | Species | Human | Gene symbol | STAT5A | Gene ID | 6776 |
| Gene name | signal transducer and activator of transcription 5A | |
| Gene Alias | MGF | |
| Cytomap | 17q21.2 | |
| Gene Type | protein-coding | GO ID | GO:0001667 | UniProtAcc | A8K6I5 |
Top |
Malignant transformation analysis |
| Identification of the aberrant gene expression in precancerous and cancerous lesions by comparing the gene expression of stem-like cells in diseased tissues with normal stem cells |
| Entrez ID | Symbol | Replicates | Species | Organ | Tissue | Adj P-value | Log2FC | Malignancy |
| 6776 | STAT5A | LZE24T | Human | Esophagus | ESCC | 5.57e-06 | 1.28e-01 | 0.0596 |
| 6776 | STAT5A | P1T-E | Human | Esophagus | ESCC | 1.88e-02 | 1.93e-01 | 0.0875 |
| 6776 | STAT5A | P2T-E | Human | Esophagus | ESCC | 7.75e-10 | 1.63e-01 | 0.1177 |
| 6776 | STAT5A | P4T-E | Human | Esophagus | ESCC | 6.30e-09 | 9.34e-02 | 0.1323 |
| 6776 | STAT5A | P8T-E | Human | Esophagus | ESCC | 3.08e-03 | 5.88e-02 | 0.0889 |
| 6776 | STAT5A | P9T-E | Human | Esophagus | ESCC | 2.76e-05 | 6.51e-02 | 0.1131 |
| 6776 | STAT5A | P16T-E | Human | Esophagus | ESCC | 5.44e-03 | 5.40e-02 | 0.1153 |
| 6776 | STAT5A | P17T-E | Human | Esophagus | ESCC | 5.78e-04 | 2.55e-01 | 0.1278 |
| 6776 | STAT5A | P20T-E | Human | Esophagus | ESCC | 4.41e-03 | 1.11e-01 | 0.1124 |
| 6776 | STAT5A | P22T-E | Human | Esophagus | ESCC | 9.37e-05 | 6.04e-02 | 0.1236 |
| 6776 | STAT5A | P23T-E | Human | Esophagus | ESCC | 1.40e-14 | 2.61e-01 | 0.108 |
| 6776 | STAT5A | P24T-E | Human | Esophagus | ESCC | 1.22e-09 | 2.16e-01 | 0.1287 |
| 6776 | STAT5A | P36T-E | Human | Esophagus | ESCC | 1.34e-05 | 1.59e-01 | 0.1187 |
| 6776 | STAT5A | P37T-E | Human | Esophagus | ESCC | 3.10e-11 | 1.20e-01 | 0.1371 |
| 6776 | STAT5A | P38T-E | Human | Esophagus | ESCC | 8.70e-07 | 1.76e-01 | 0.127 |
| 6776 | STAT5A | P44T-E | Human | Esophagus | ESCC | 2.16e-04 | 1.09e-01 | 0.1096 |
| 6776 | STAT5A | P47T-E | Human | Esophagus | ESCC | 1.61e-05 | 1.29e-01 | 0.1067 |
| 6776 | STAT5A | P48T-E | Human | Esophagus | ESCC | 3.04e-05 | 6.43e-02 | 0.0959 |
| 6776 | STAT5A | P52T-E | Human | Esophagus | ESCC | 4.27e-08 | 1.70e-01 | 0.1555 |
| 6776 | STAT5A | P54T-E | Human | Esophagus | ESCC | 4.42e-03 | 4.46e-02 | 0.0975 |
| Page: 1 2 |
| Tissue | Expression Dynamics | Abbreviation |
| Esophagus | 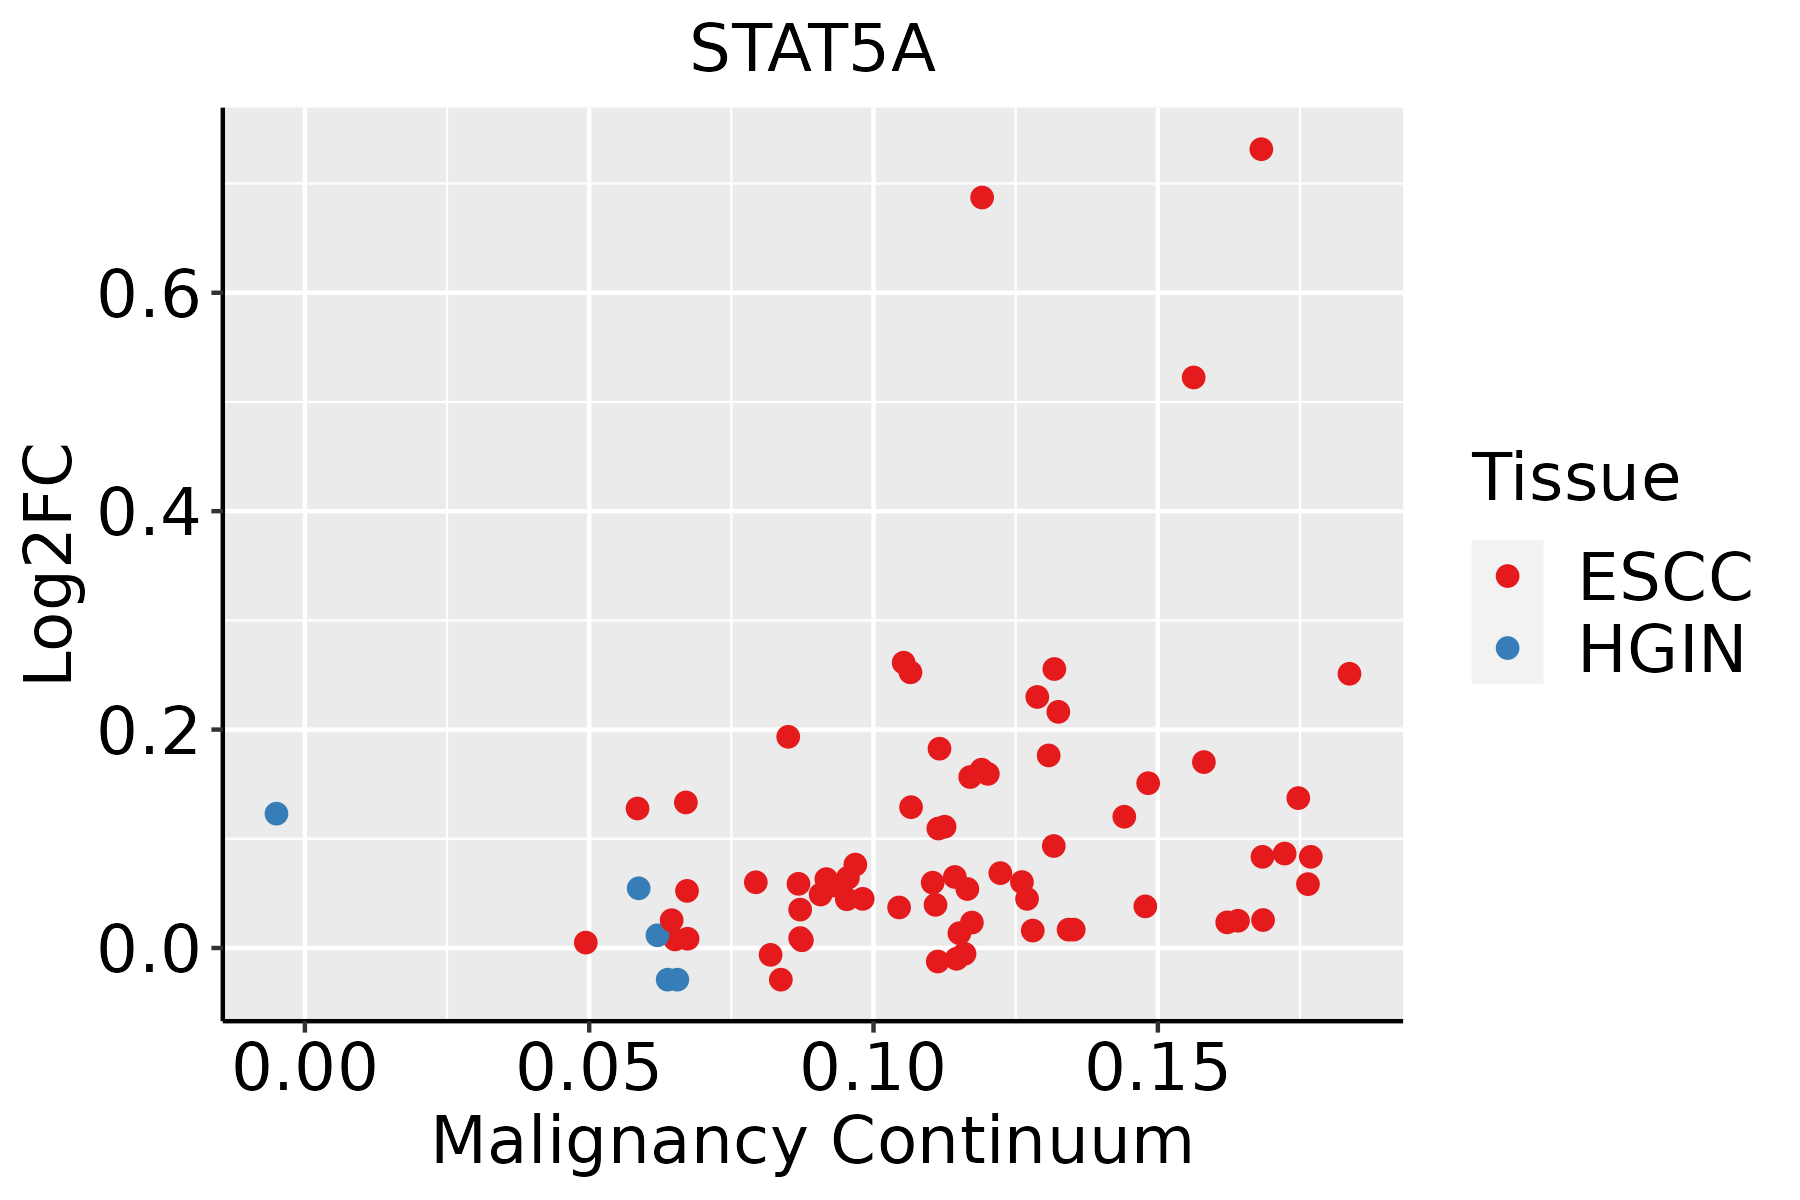 | ESCC: Esophageal squamous cell carcinoma |
| HGIN: High-grade intraepithelial neoplasias | ||
| LGIN: Low-grade intraepithelial neoplasias |
| ∗log2FC in expression of this searched gene in stem-like cells from each diseased tissue sample relative to stem-like cells in normal samples in each tissue plotted against the malignancy continuum. Samples are colored based on if they are from different disease stage. |
Top |
Malignant transformation related pathway analysis |
| Find out the enriched GO biological processes and KEGG pathways involved in transition from healthy to precancer to cancer |
| Tissue | Disease Stage | Enriched GO biological Processes |
| Colorectum | AD |  |
| Colorectum | SER |  |
| Colorectum | MSS |  |
| Colorectum | MSI-H |  |
| Colorectum | FAP |  |
| ∗Top 15 enriched GO BP terms are showed in the bar plot of each disease state in each tissue. Each row represents a significant GO biological process which is colored according to the -log10(p.adjust). |
| Page: 1 2 3 4 5 6 7 8 9 |
| GO ID | Tissue | Disease Stage | Description | Gene Ratio | Bg Ratio | pvalue | p.adjust | Count |
| GO:0048732111 | Esophagus | ESCC | gland development | 269/8552 | 436/18723 | 7.81e-12 | 2.95e-10 | 269 |
| GO:00067906 | Esophagus | ESCC | sulfur compound metabolic process | 201/8552 | 339/18723 | 2.64e-07 | 3.94e-06 | 201 |
| GO:190165319 | Esophagus | ESCC | cellular response to peptide | 208/8552 | 359/18723 | 1.68e-06 | 2.01e-05 | 208 |
| GO:0043434111 | Esophagus | ESCC | response to peptide hormone | 234/8552 | 414/18723 | 4.93e-06 | 5.21e-05 | 234 |
| GO:007137516 | Esophagus | ESCC | cellular response to peptide hormone stimulus | 166/8552 | 290/18723 | 4.48e-05 | 3.55e-04 | 166 |
| GO:003087914 | Esophagus | ESCC | mammary gland development | 85/8552 | 137/18723 | 8.11e-05 | 6.01e-04 | 85 |
| GO:005067318 | Esophagus | ESCC | epithelial cell proliferation | 238/8552 | 437/18723 | 1.19e-04 | 8.20e-04 | 238 |
| GO:00352647 | Esophagus | ESCC | multicellular organism growth | 80/8552 | 132/18723 | 3.84e-04 | 2.22e-03 | 80 |
| GO:005067817 | Esophagus | ESCC | regulation of epithelial cell proliferation | 206/8552 | 381/18723 | 5.51e-04 | 3.02e-03 | 206 |
| GO:000166720 | Esophagus | ESCC | ameboidal-type cell migration | 250/8552 | 475/18723 | 1.22e-03 | 5.97e-03 | 250 |
| GO:001063120 | Esophagus | ESCC | epithelial cell migration | 187/8552 | 357/18723 | 6.05e-03 | 2.23e-02 | 187 |
| GO:009013220 | Esophagus | ESCC | epithelium migration | 188/8552 | 360/18723 | 6.96e-03 | 2.54e-02 | 188 |
| GO:009013020 | Esophagus | ESCC | tissue migration | 190/8552 | 365/18723 | 7.91e-03 | 2.82e-02 | 190 |
| Page: 1 |
| Pathway ID | Tissue | Disease Stage | Description | Gene Ratio | Bg Ratio | pvalue | p.adjust | qvalue | Count |
| hsa05166211 | Esophagus | ESCC | Human T-cell leukemia virus 1 infection | 164/4205 | 222/8465 | 8.13e-14 | 2.09e-12 | 1.07e-12 | 164 |
| hsa0522020 | Esophagus | ESCC | Chronic myeloid leukemia | 61/4205 | 76/8465 | 3.20e-08 | 2.68e-07 | 1.37e-07 | 61 |
| hsa0520325 | Esophagus | ESCC | Viral carcinogenesis | 137/4205 | 204/8465 | 2.47e-07 | 1.88e-06 | 9.62e-07 | 137 |
| hsa0493310 | Esophagus | ESCC | AGE-RAGE signaling pathway in diabetic complications | 72/4205 | 100/8465 | 4.15e-06 | 2.28e-05 | 1.17e-05 | 72 |
| hsa051619 | Esophagus | ESCC | Hepatitis B | 108/4205 | 162/8465 | 7.68e-06 | 4.15e-05 | 2.12e-05 | 108 |
| hsa052215 | Esophagus | ESCC | Acute myeloid leukemia | 49/4205 | 67/8465 | 7.43e-05 | 3.07e-04 | 1.57e-04 | 49 |
| hsa051629 | Esophagus | ESCC | Measles | 90/4205 | 139/8465 | 2.16e-04 | 7.87e-04 | 4.03e-04 | 90 |
| hsa046599 | Esophagus | ESCC | Th17 cell differentiation | 68/4205 | 108/8465 | 3.53e-03 | 9.30e-03 | 4.76e-03 | 68 |
| hsa046585 | Esophagus | ESCC | Th1 and Th2 cell differentiation | 58/4205 | 92/8465 | 6.49e-03 | 1.60e-02 | 8.19e-03 | 58 |
| hsa05166310 | Esophagus | ESCC | Human T-cell leukemia virus 1 infection | 164/4205 | 222/8465 | 8.13e-14 | 2.09e-12 | 1.07e-12 | 164 |
| hsa05220110 | Esophagus | ESCC | Chronic myeloid leukemia | 61/4205 | 76/8465 | 3.20e-08 | 2.68e-07 | 1.37e-07 | 61 |
| hsa0520335 | Esophagus | ESCC | Viral carcinogenesis | 137/4205 | 204/8465 | 2.47e-07 | 1.88e-06 | 9.62e-07 | 137 |
| hsa0493317 | Esophagus | ESCC | AGE-RAGE signaling pathway in diabetic complications | 72/4205 | 100/8465 | 4.15e-06 | 2.28e-05 | 1.17e-05 | 72 |
| hsa0516114 | Esophagus | ESCC | Hepatitis B | 108/4205 | 162/8465 | 7.68e-06 | 4.15e-05 | 2.12e-05 | 108 |
| hsa0522113 | Esophagus | ESCC | Acute myeloid leukemia | 49/4205 | 67/8465 | 7.43e-05 | 3.07e-04 | 1.57e-04 | 49 |
| hsa0516213 | Esophagus | ESCC | Measles | 90/4205 | 139/8465 | 2.16e-04 | 7.87e-04 | 4.03e-04 | 90 |
| hsa0465914 | Esophagus | ESCC | Th17 cell differentiation | 68/4205 | 108/8465 | 3.53e-03 | 9.30e-03 | 4.76e-03 | 68 |
| hsa0465812 | Esophagus | ESCC | Th1 and Th2 cell differentiation | 58/4205 | 92/8465 | 6.49e-03 | 1.60e-02 | 8.19e-03 | 58 |
| Page: 1 |
Top |
Cell-cell communication analysis |
| Identification of potential cell-cell interactions between two cell types and their ligand-receptor pairs for different disease states |
| Ligand | Receptor | LRpair | Pathway | Tissue | Disease Stage |
| Page: 1 |
Top |
Single-cell gene regulatory network inference analysis |
| Find out the significant the regulons (TFs) and the target genes of each regulon across cell types for different disease states |
| TF | Cell Type | Tissue | Disease Stage | Target Gene | RSS | Regulon Activity |
| STAT5A | ADIPO | Colorectum | ADJ | BCAR3,C1QTNF1,IQSEC1, etc. | 6.47e-02 |  |
| STAT5A | ADIPO | Colorectum | CRC | BCAR3,C1QTNF1,IQSEC1, etc. | 2.38e-01 |  |
| STAT5A | CD8TEXINT | Lung | MIAC | STAT5B,TBC1D10A,VAMP1, etc. | 1.08e-01 |  |
| STAT5A | MSC.ADIPO | Lung | AAH | PGAM5,TMEM255A,CPB2-AS1, etc. | 5.30e-01 |  |
| STAT5A | MSC.MVA | Lung | AAH | PGAM5,TMEM255A,CPB2-AS1, etc. | 1.72e-01 | |
| STAT5A | ADIPO | Lung | AAH | PGAM5,TMEM255A,CPB2-AS1, etc. | 6.39e-02 | |
| STAT5A | MSC.MVA | Lung | ADJ | PGAM5,TMEM255A,CPB2-AS1, etc. | 2.45e-01 |  |
| STAT5A | ADIPO | Lung | ADJ | PGAM5,TMEM255A,CPB2-AS1, etc. | 6.97e-02 | |
| STAT5A | FIB | Lung | ADJ | PGAM5,TMEM255A,CPB2-AS1, etc. | 1.81e-03 | |
| STAT5A | ICAF | Lung | ADJ | PGAM5,TMEM255A,CPB2-AS1, etc. | 1.41e-04 | |
| ∗The dot plots of a searched regulon are shown for all cell subpopulations in each disease state of each tissue based on the regulon specific score inferred using pySCENIC and by calculating the average expression. |
| Page: 1 2 3 |
Top |
Somatic mutation of malignant transformation related genes |
| Annotation of somatic variants for genes involved in malignant transformation |
| Hugo Symbol | Variant Class | Variant Classification | dbSNP RS | HGVSc | HGVSp | HGVSp Short | SWISSPROT | BIOTYPE | SIFT | PolyPhen | Tumor Sample Barcode | Tissue | Histology | Sex | Age | Stage | Therapy Types | Drugs | Outcome |
| STAT5A | SNV | Missense_Mutation | novel | c.351N>C | p.Gln117His | p.Q117H | P42229 | protein_coding | deleterious(0.05) | possibly_damaging(0.705) | TCGA-5L-AAT1-01 | Breast | breast invasive carcinoma | Female | <65 | III/IV | Hormone Therapy | letrozol | SD |
| STAT5A | SNV | Missense_Mutation | c.1495N>G | p.Pro499Ala | p.P499A | P42229 | protein_coding | deleterious(0.04) | probably_damaging(0.986) | TCGA-A8-A09A-01 | Breast | breast invasive carcinoma | Female | <65 | I/II | Hormone Therapy | tamoxiphen | SD | |
| STAT5A | SNV | Missense_Mutation | novel | c.1110N>T | p.Lys370Asn | p.K370N | P42229 | protein_coding | deleterious(0.01) | benign(0.378) | TCGA-AC-A3W6-01 | Breast | breast invasive carcinoma | Female | >=65 | III/IV | Unknown | Unknown | SD |
| STAT5A | SNV | Missense_Mutation | c.1513N>T | p.Pro505Ser | p.P505S | P42229 | protein_coding | tolerated(0.36) | benign(0.015) | TCGA-AN-A0AK-01 | Breast | breast invasive carcinoma | Female | >=65 | I/II | Unknown | Unknown | SD | |
| STAT5A | SNV | Missense_Mutation | c.1657N>A | p.Val553Met | p.V553M | P42229 | protein_coding | tolerated(0.13) | possibly_damaging(0.461) | TCGA-D8-A1XQ-01 | Breast | breast invasive carcinoma | Female | >=65 | I/II | Unknown | Unknown | SD | |
| STAT5A | SNV | Missense_Mutation | c.1946G>A | p.Arg649Gln | p.R649Q | P42229 | protein_coding | deleterious(0.01) | benign(0.113) | TCGA-E2-A14R-01 | Breast | breast invasive carcinoma | Female | <65 | I/II | Chemotherapy | doxorubicin | PD | |
| STAT5A | SNV | Missense_Mutation | c.534G>C | p.Glu178Asp | p.E178D | P42229 | protein_coding | tolerated(0.15) | benign(0.027) | TCGA-EW-A1J5-01 | Breast | breast invasive carcinoma | Female | <65 | I/II | Chemotherapy | adriamycin | SD | |
| STAT5A | SNV | Missense_Mutation | novel | c.1743N>C | p.Leu581Phe | p.L581F | P42229 | protein_coding | tolerated(0.16) | possibly_damaging(0.649) | TCGA-EW-A6SD-01 | Breast | breast invasive carcinoma | Female | <65 | I/II | Chemotherapy | tch | SD |
| STAT5A | deletion | Frame_Shift_Del | novel | c.171delC | p.Thr58ProfsTer26 | p.T58Pfs*26 | P42229 | protein_coding | TCGA-EW-A2FV-01 | Breast | breast invasive carcinoma | Female | <65 | III/IV | Chemotherapy | docetaxel | SD | ||
| STAT5A | SNV | Missense_Mutation | novel | c.911N>T | p.Pro304Leu | p.P304L | P42229 | protein_coding | deleterious(0.01) | benign(0.096) | TCGA-EA-A3HS-01 | Cervix | cervical & endocervical cancer | Female | <65 | I/II | Unknown | Unknown | SD |
| Page: 1 2 3 4 5 6 |
Top |
Related drugs of malignant transformation related genes |
| Identification of chemicals and drugs interact with genes involved in malignant transfromation |
| (DGIdb 4.0) |
| Entrez ID | Symbol | Category | Interaction Types | Drug Claim Name | Drug Name | PMIDs |
| 6776 | STAT5A | KINASE, TRANSCRIPTION FACTOR, CLINICALLY ACTIONABLE, DRUGGABLE GENOME | TOFACITINIB | TOFACITINIB | 14593182,19053756 | |
| 6776 | STAT5A | KINASE, TRANSCRIPTION FACTOR, CLINICALLY ACTIONABLE, DRUGGABLE GENOME | AZD-1480 | AZD-1480 | 21138246 |
| Page: 1 |

Copyright 2023-Present -The University of Texas Health Science Center at Houston |