
|
|||||
|
 | |
| |
| |
| |
| |
| |
|
Gene: STARD7 |
Gene summary for STARD7 |
| Gene information | Species | Human | Gene symbol | STARD7 | Gene ID | 56910 |
| Gene name | StAR related lipid transfer domain containing 7 | |
| Gene Alias | FAME2 | |
| Cytomap | 2q11.2 | |
| Gene Type | protein-coding | GO ID | GO:0005575 | UniProtAcc | Q9NQZ5 |
Top |
Malignant transformation analysis |
| Identification of the aberrant gene expression in precancerous and cancerous lesions by comparing the gene expression of stem-like cells in diseased tissues with normal stem cells |
| Entrez ID | Symbol | Replicates | Species | Organ | Tissue | Adj P-value | Log2FC | Malignancy |
| 56910 | STARD7 | HTA11_1938_2000001011 | Human | Colorectum | AD | 2.69e-10 | 6.69e-01 | -0.0811 |
| 56910 | STARD7 | HTA11_78_2000001011 | Human | Colorectum | AD | 1.04e-03 | 4.84e-01 | -0.1088 |
| 56910 | STARD7 | HTA11_347_2000001011 | Human | Colorectum | AD | 1.96e-11 | 6.25e-01 | -0.1954 |
| 56910 | STARD7 | HTA11_411_2000001011 | Human | Colorectum | SER | 5.54e-03 | 8.85e-01 | -0.2602 |
| 56910 | STARD7 | HTA11_1391_2000001011 | Human | Colorectum | AD | 7.75e-10 | 7.08e-01 | -0.059 |
| 56910 | STARD7 | HTA11_6801_2000001011 | Human | Colorectum | SER | 4.69e-04 | 8.27e-01 | 0.0171 |
| 56910 | STARD7 | HTA11_7696_3000711011 | Human | Colorectum | AD | 2.36e-02 | 2.76e-01 | 0.0674 |
| 56910 | STARD7 | HTA11_99999970781_79442 | Human | Colorectum | MSS | 1.40e-14 | 7.31e-01 | 0.294 |
| 56910 | STARD7 | HTA11_99999965062_69753 | Human | Colorectum | MSI-H | 1.52e-05 | 1.15e+00 | 0.3487 |
| 56910 | STARD7 | HTA11_99999965104_69814 | Human | Colorectum | MSS | 4.27e-03 | 5.57e-01 | 0.281 |
| 56910 | STARD7 | HTA11_99999971662_82457 | Human | Colorectum | MSS | 6.75e-11 | 6.64e-01 | 0.3859 |
| 56910 | STARD7 | F007 | Human | Colorectum | FAP | 1.72e-02 | -2.42e-01 | 0.1176 |
| 56910 | STARD7 | A015-C-203 | Human | Colorectum | FAP | 3.28e-07 | -1.86e-01 | -0.1294 |
| 56910 | STARD7 | A002-C-201 | Human | Colorectum | FAP | 2.68e-07 | -2.26e-01 | 0.0324 |
| 56910 | STARD7 | A001-C-108 | Human | Colorectum | FAP | 5.98e-06 | -1.60e-01 | -0.0272 |
| 56910 | STARD7 | A002-C-205 | Human | Colorectum | FAP | 1.14e-07 | -1.19e-01 | -0.1236 |
| 56910 | STARD7 | A015-C-006 | Human | Colorectum | FAP | 8.36e-04 | -1.18e-01 | -0.0994 |
| 56910 | STARD7 | A002-C-114 | Human | Colorectum | FAP | 5.33e-05 | -6.57e-02 | -0.1561 |
| 56910 | STARD7 | A015-C-104 | Human | Colorectum | FAP | 8.20e-08 | -1.31e-01 | -0.1899 |
| 56910 | STARD7 | A002-C-016 | Human | Colorectum | FAP | 1.33e-06 | -1.72e-01 | 0.0521 |
| Page: 1 2 3 4 5 6 7 8 9 |
| Tissue | Expression Dynamics | Abbreviation |
| Colorectum (GSE201348) |  | FAP: Familial adenomatous polyposis |
| CRC: Colorectal cancer | ||
| Colorectum (HTA11) |  | AD: Adenomas |
| SER: Sessile serrated lesions | ||
| MSI-H: Microsatellite-high colorectal cancer | ||
| MSS: Microsatellite stable colorectal cancer | ||
| Esophagus | 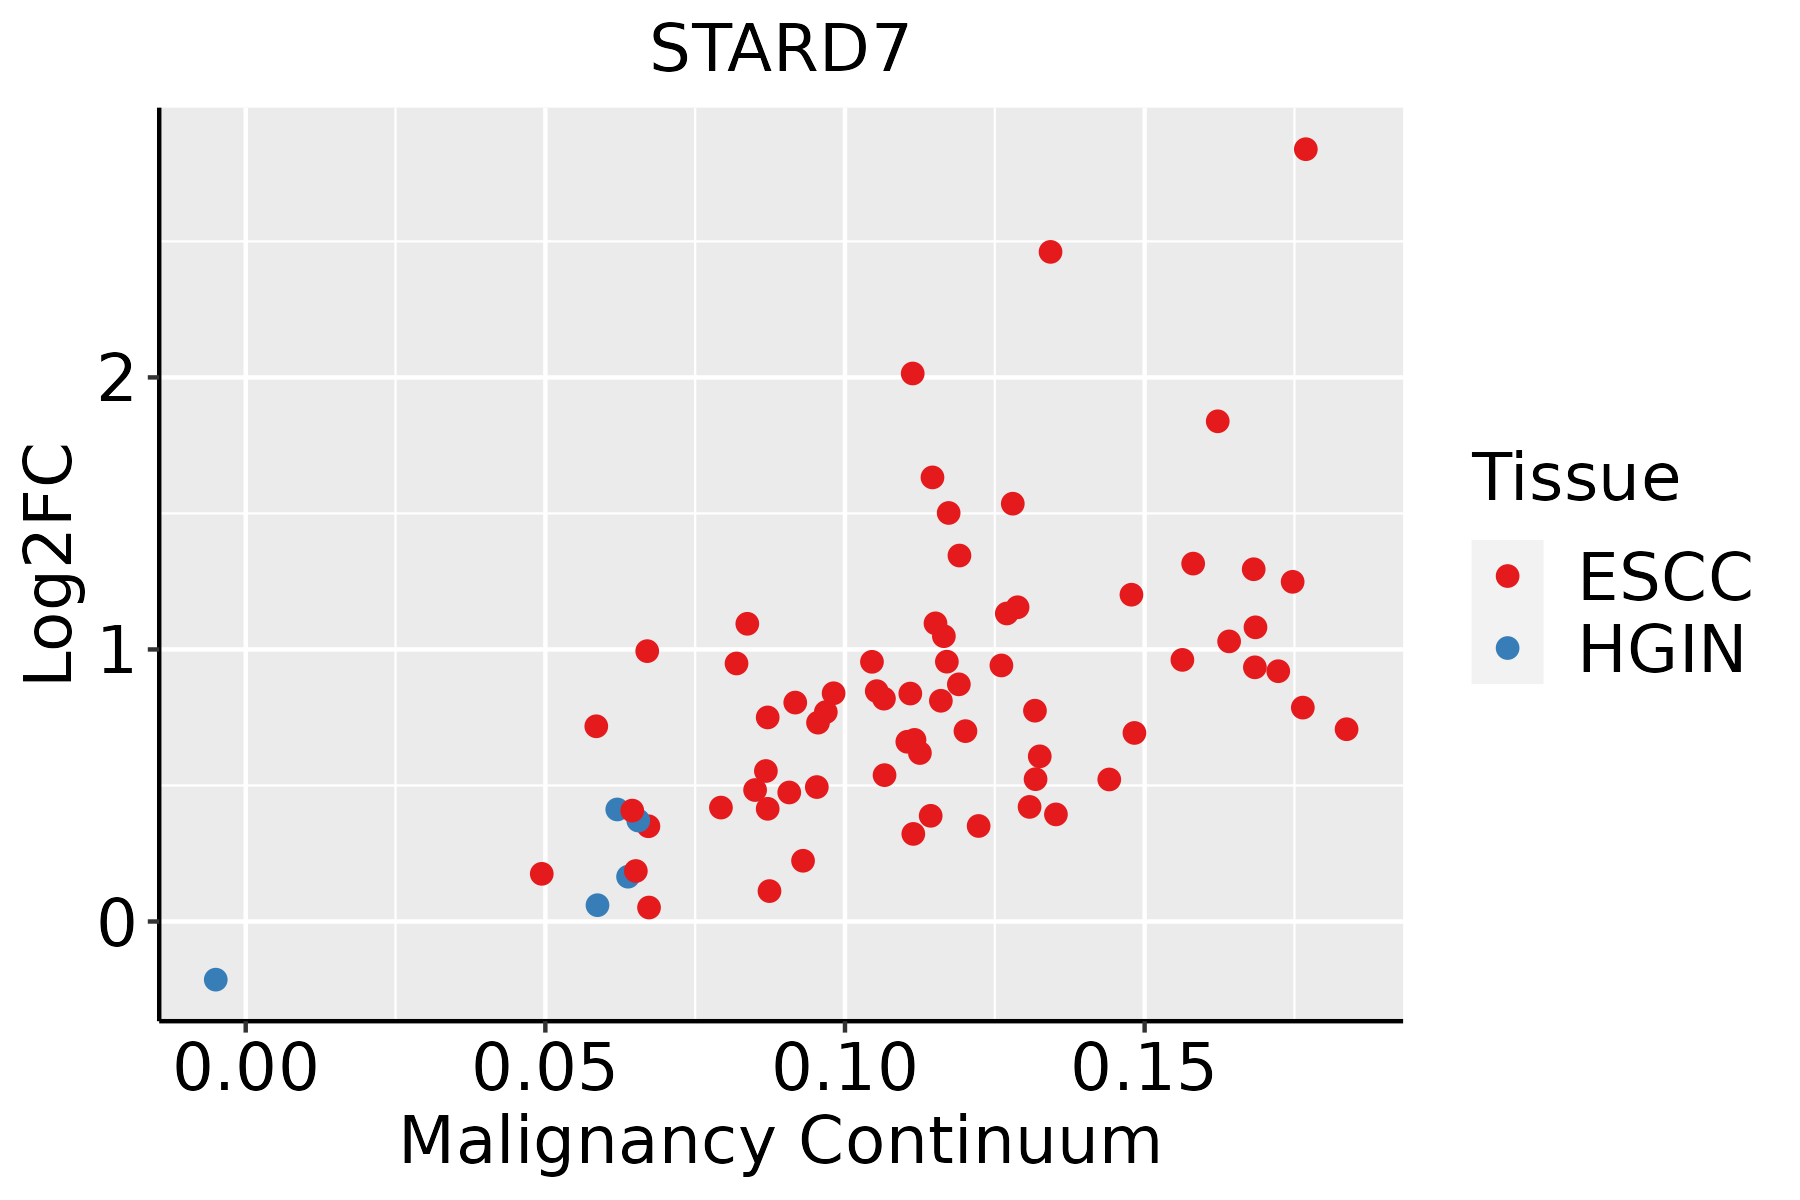 | ESCC: Esophageal squamous cell carcinoma |
| HGIN: High-grade intraepithelial neoplasias | ||
| LGIN: Low-grade intraepithelial neoplasias | ||
| Liver |  | HCC: Hepatocellular carcinoma |
| NAFLD: Non-alcoholic fatty liver disease | ||
| Oral Cavity | 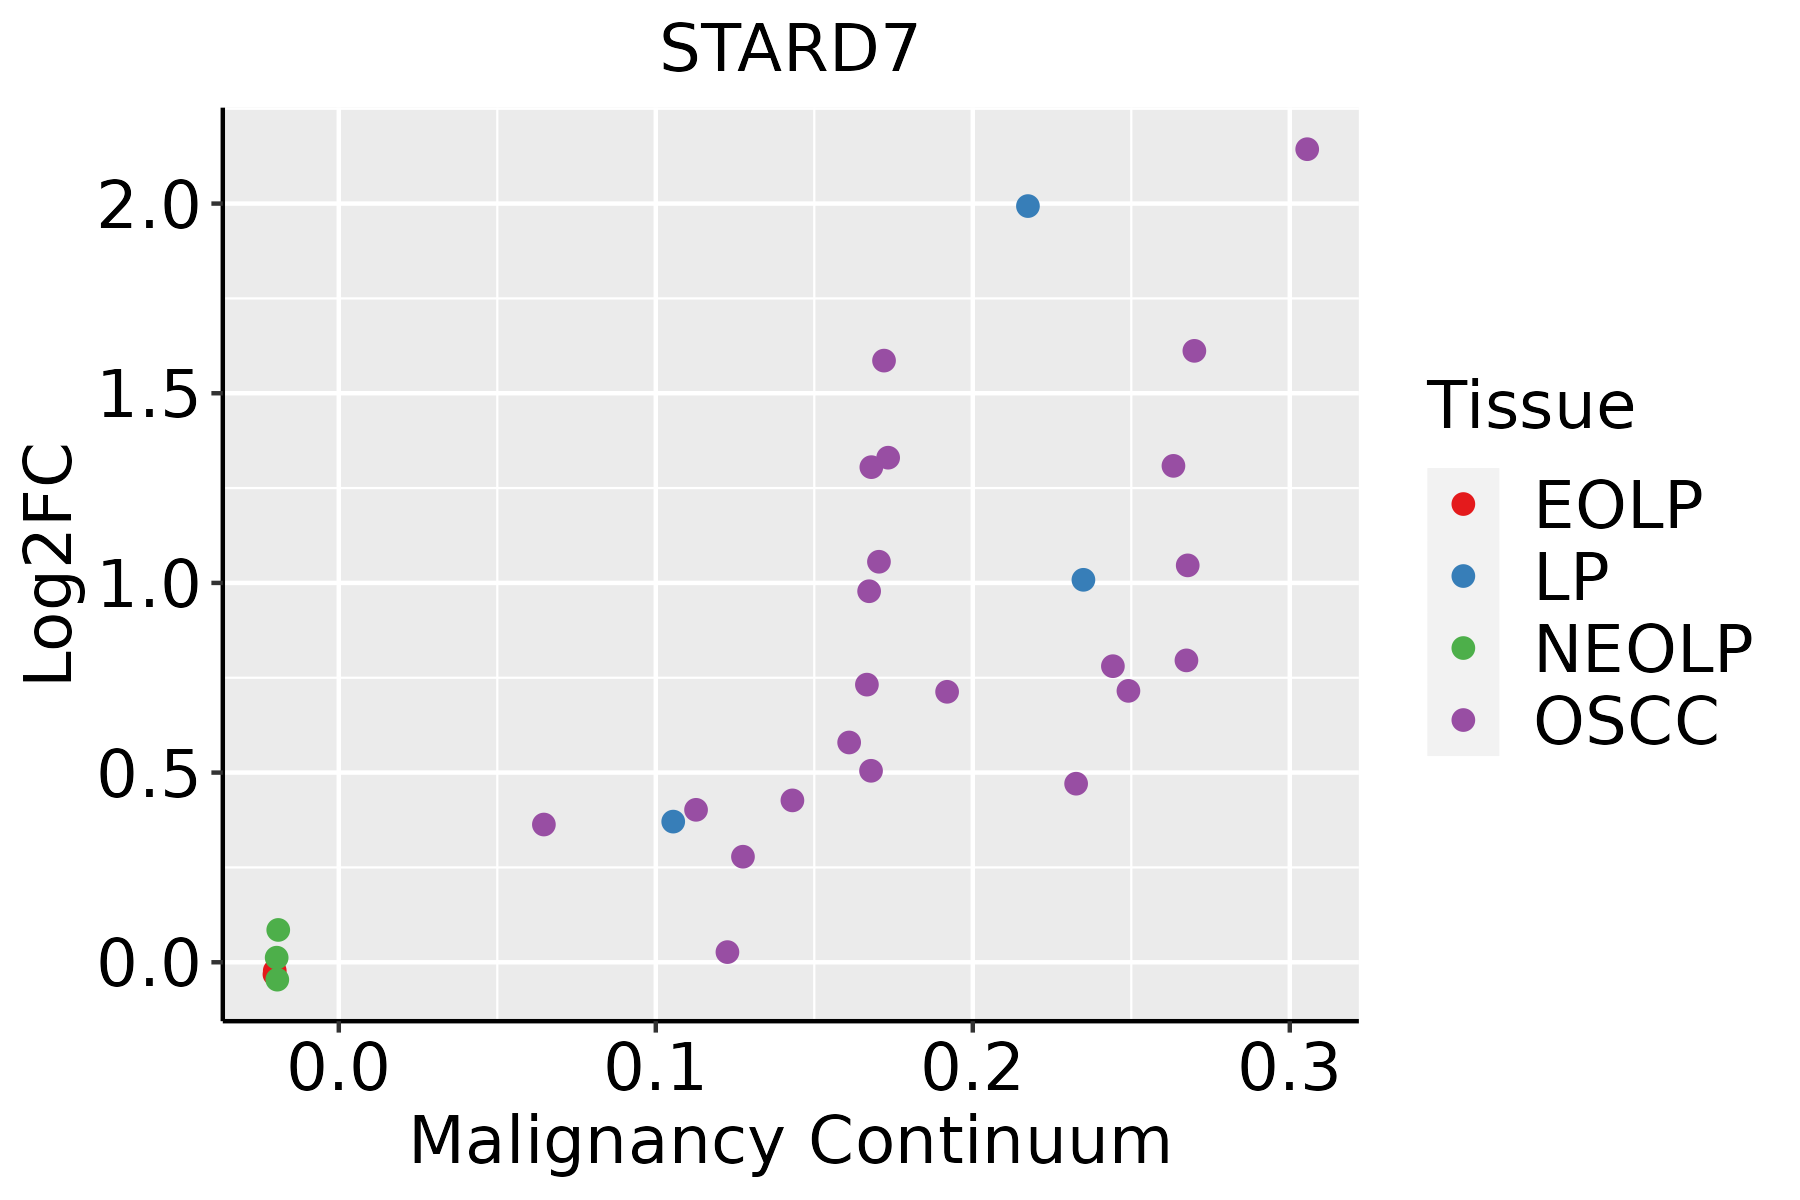 | EOLP: Erosive Oral lichen planus |
| LP: leukoplakia | ||
| NEOLP: Non-erosive oral lichen planus | ||
| OSCC: Oral squamous cell carcinoma | ||
| Prostate |  | BPH: Benign Prostatic Hyperplasia |
| Skin | 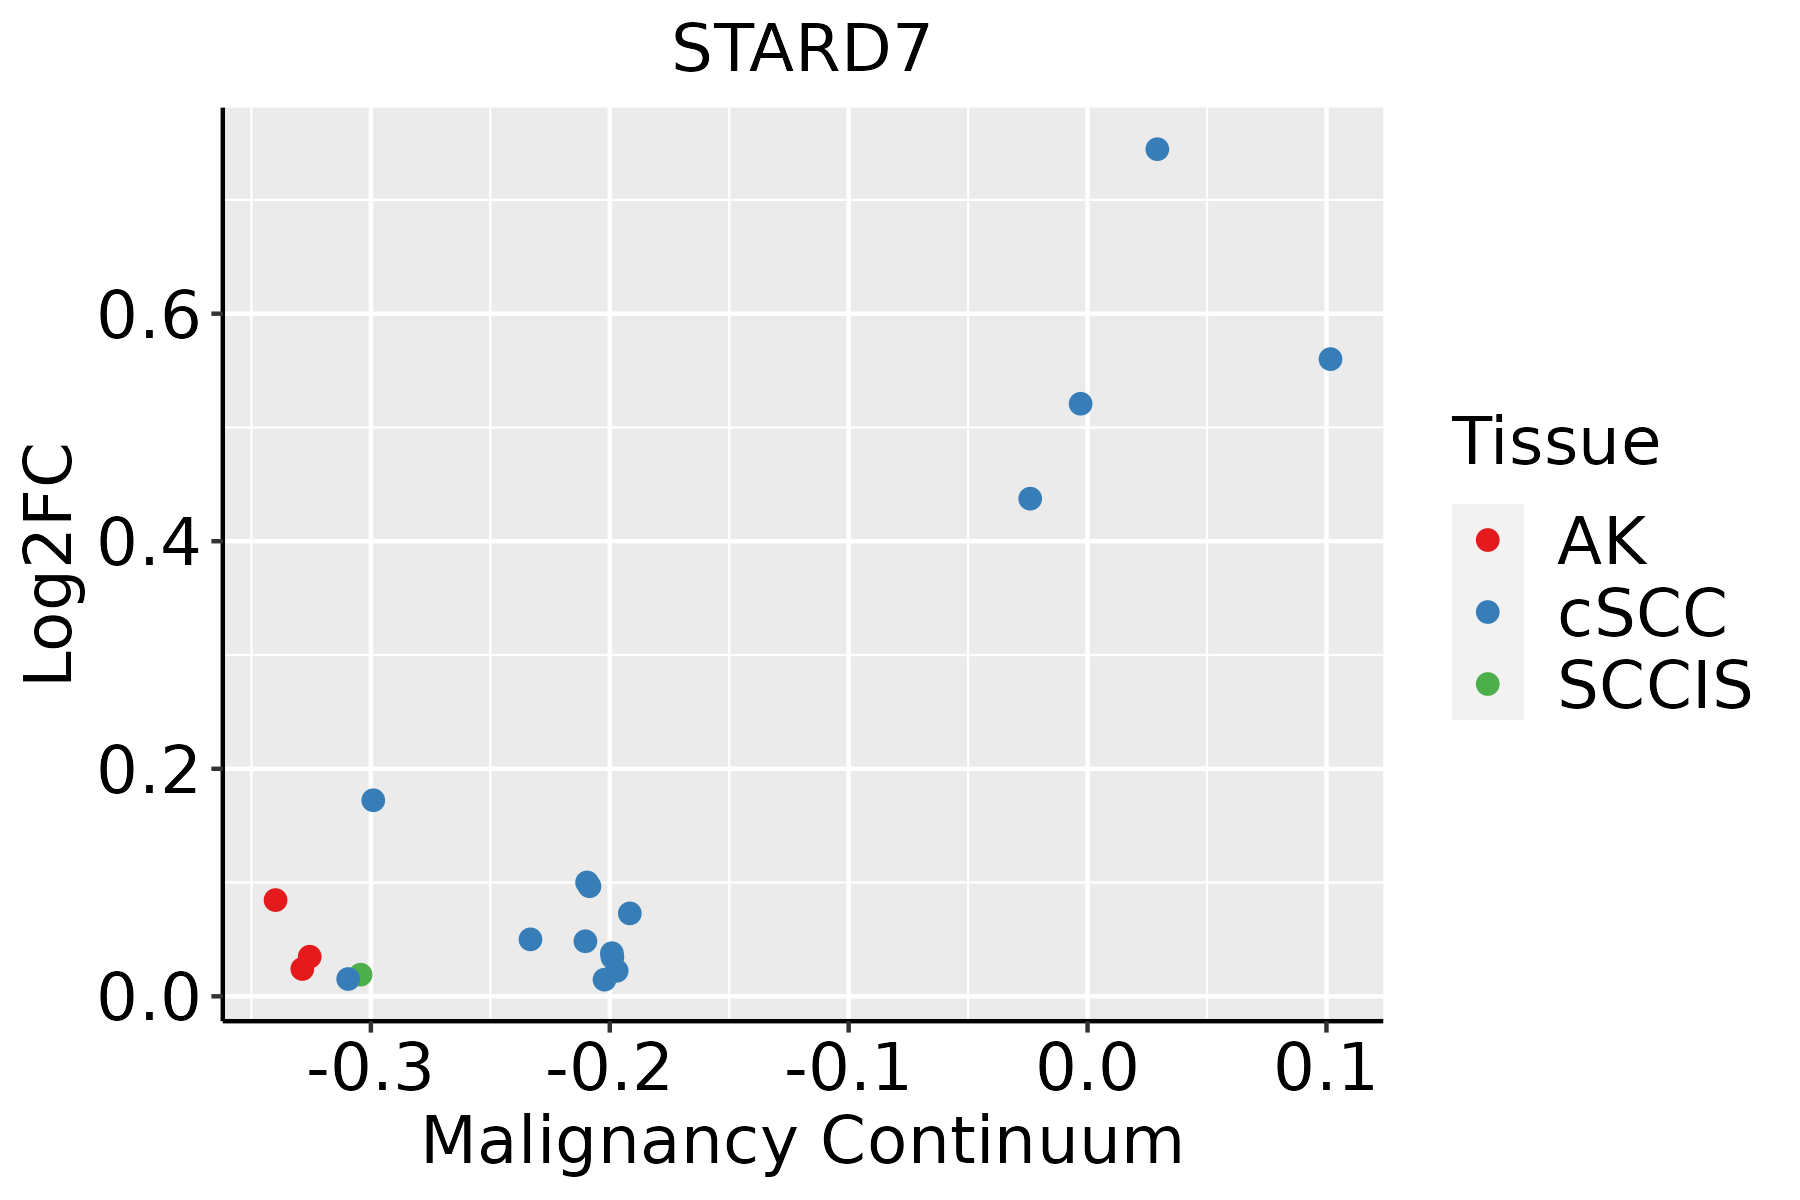 | AK: Actinic keratosis |
| cSCC: Cutaneous squamous cell carcinoma | ||
| SCCIS:squamous cell carcinoma in situ | ||
| Thyroid | 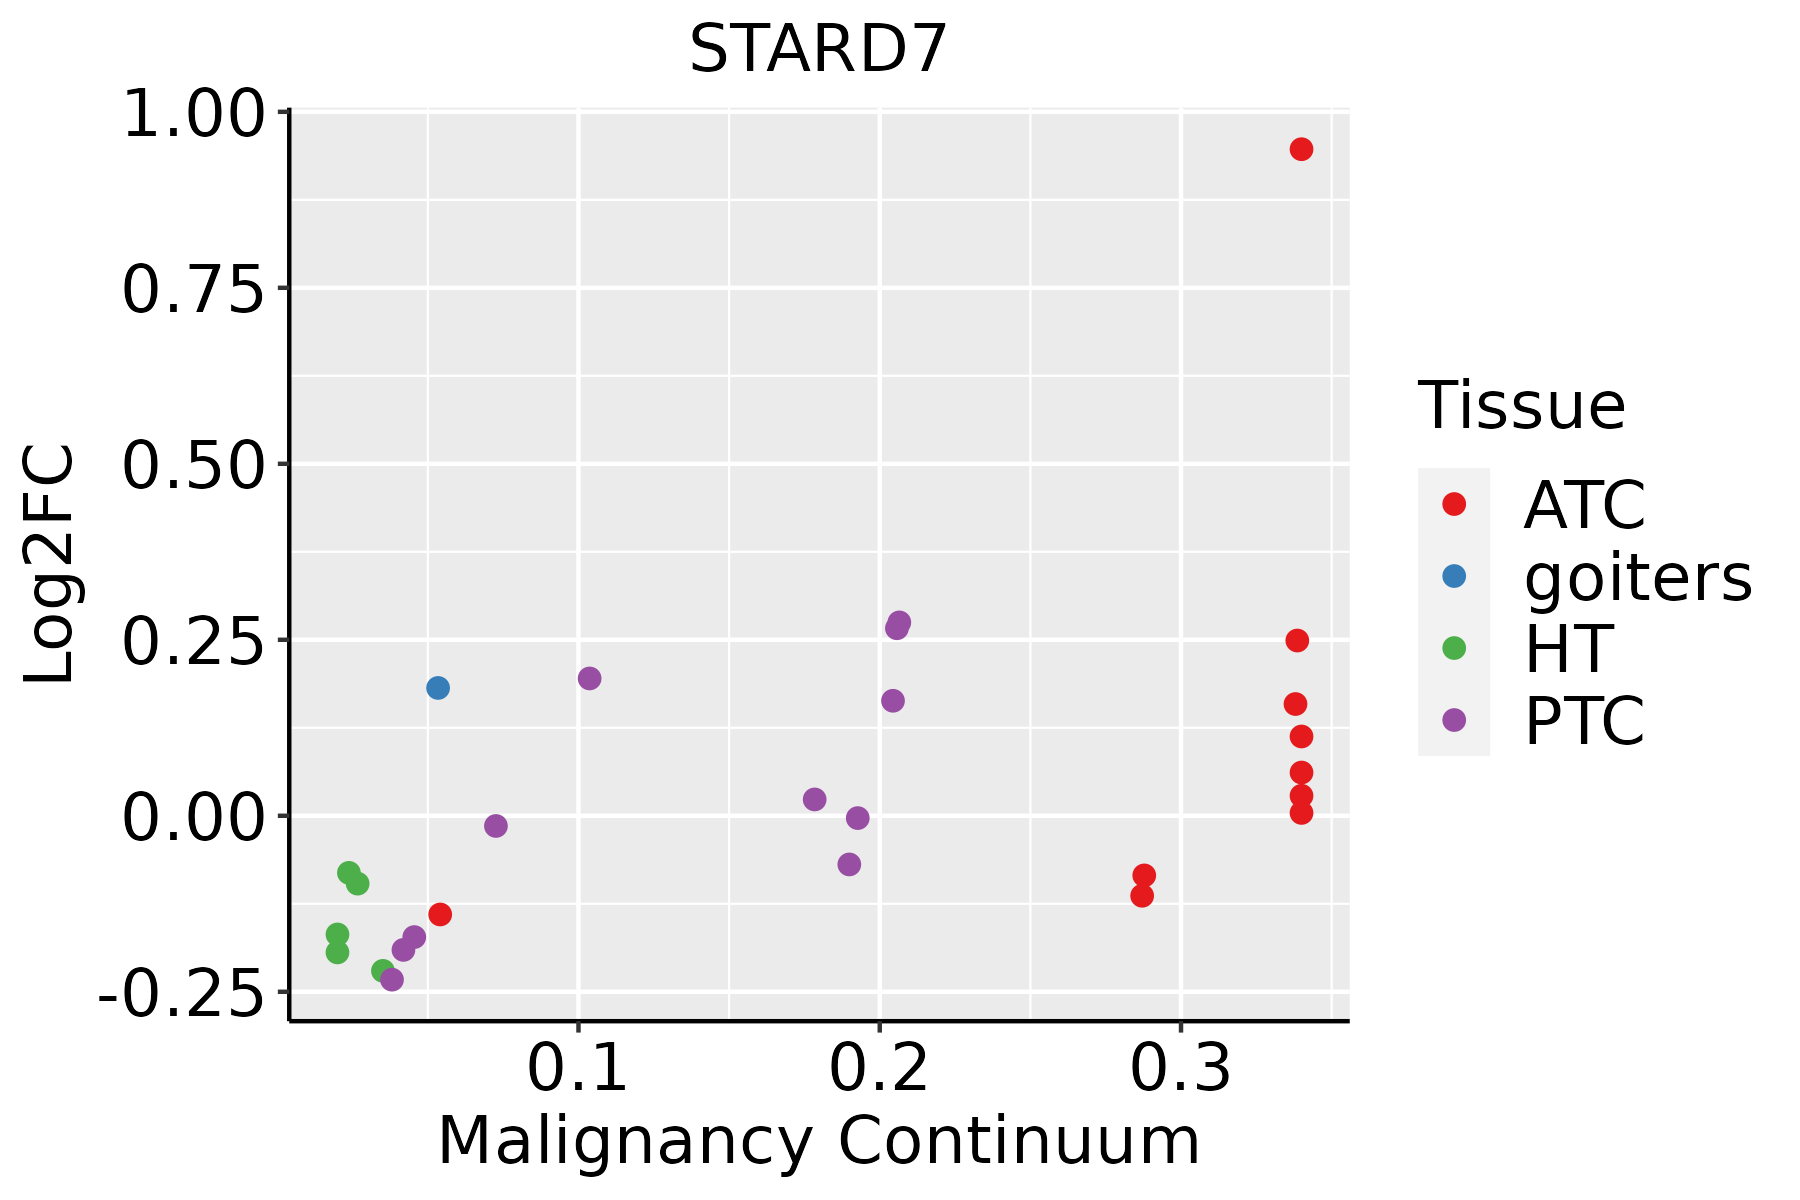 | ATC: Anaplastic thyroid cancer |
| HT: Hashimoto's thyroiditis | ||
| PTC: Papillary thyroid cancer |
| ∗log2FC in expression of this searched gene in stem-like cells from each diseased tissue sample relative to stem-like cells in normal samples in each tissue plotted against the malignancy continuum. Samples are colored based on if they are from different disease stage. |
Top |
Malignant transformation related pathway analysis |
| Find out the enriched GO biological processes and KEGG pathways involved in transition from healthy to precancer to cancer |
| Tissue | Disease Stage | Enriched GO biological Processes |
| Colorectum | AD |  |
| Colorectum | SER |  |
| Colorectum | MSS |  |
| Colorectum | MSI-H |  |
| Colorectum | FAP |  |
| ∗Top 15 enriched GO BP terms are showed in the bar plot of each disease state in each tissue. Each row represents a significant GO biological process which is colored according to the -log10(p.adjust). |
| Page: 1 2 3 4 5 6 7 8 9 |
| GO ID | Tissue | Disease Stage | Description | Gene Ratio | Bg Ratio | pvalue | p.adjust | Count |
| Page: 1 |
| Pathway ID | Tissue | Disease Stage | Description | Gene Ratio | Bg Ratio | pvalue | p.adjust | qvalue | Count |
| Page: 1 |
Top |
Cell-cell communication analysis |
| Identification of potential cell-cell interactions between two cell types and their ligand-receptor pairs for different disease states |
| Ligand | Receptor | LRpair | Pathway | Tissue | Disease Stage |
| Page: 1 |
Top |
Single-cell gene regulatory network inference analysis |
| Find out the significant the regulons (TFs) and the target genes of each regulon across cell types for different disease states |
| TF | Cell Type | Tissue | Disease Stage | Target Gene | RSS | Regulon Activity |
| ∗The dot plots of a searched regulon are shown for all cell subpopulations in each disease state of each tissue based on the regulon specific score inferred using pySCENIC and by calculating the average expression. |
| Page: 1 |
Top |
Somatic mutation of malignant transformation related genes |
| Annotation of somatic variants for genes involved in malignant transformation |
| Hugo Symbol | Variant Class | Variant Classification | dbSNP RS | HGVSc | HGVSp | HGVSp Short | SWISSPROT | BIOTYPE | SIFT | PolyPhen | Tumor Sample Barcode | Tissue | Histology | Sex | Age | Stage | Therapy Types | Drugs | Outcome |
| STARD7 | SNV | Missense_Mutation | novel | c.694C>T | p.Arg232Trp | p.R232W | Q9NQZ5 | protein_coding | deleterious(0.03) | probably_damaging(1) | TCGA-3C-AALI-01 | Breast | breast invasive carcinoma | Female | <65 | I/II | Unspecific | Poly E | Complete Response |
| STARD7 | SNV | Missense_Mutation | rs149097861 | c.466N>T | p.Pro156Ser | p.P156S | Q9NQZ5 | protein_coding | deleterious(0.02) | benign(0.111) | TCGA-A2-A0CQ-01 | Breast | breast invasive carcinoma | Female | <65 | I/II | Chemotherapy | adriamycin | SD |
| STARD7 | SNV | Missense_Mutation | c.484N>A | p.Leu162Ile | p.L162I | Q9NQZ5 | protein_coding | deleterious(0.01) | possibly_damaging(0.456) | TCGA-AO-A128-01 | Breast | breast invasive carcinoma | Female | <65 | I/II | Chemotherapy | doxorubicin | SD | |
| STARD7 | SNV | Missense_Mutation | c.354G>C | p.Gln118His | p.Q118H | Q9NQZ5 | protein_coding | tolerated(0.08) | benign(0.001) | TCGA-AR-A1AT-01 | Breast | breast invasive carcinoma | Female | <65 | I/II | Hormone Therapy | anastrozole | SD | |
| STARD7 | SNV | Missense_Mutation | rs773518469 | c.958N>G | p.Met320Val | p.M320V | Q9NQZ5 | protein_coding | tolerated(0.28) | benign(0.013) | TCGA-D8-A1XK-01 | Breast | breast invasive carcinoma | Female | <65 | I/II | Chemotherapy | doxorubicine+cyclophosphamide | SD |
| STARD7 | insertion | Frame_Shift_Ins | novel | c.323_324insAC | p.Met108IlefsTer38 | p.M108Ifs*38 | Q9NQZ5 | protein_coding | TCGA-AR-A0TU-01 | Breast | breast invasive carcinoma | Female | <65 | I/II | Unspecific | Doxorubicin | SD | ||
| STARD7 | insertion | Nonsense_Mutation | novel | c.322_323insAACAATAAACAAAAAAC | p.Met108LysfsTer3 | p.M108Kfs*3 | Q9NQZ5 | protein_coding | TCGA-AR-A0TU-01 | Breast | breast invasive carcinoma | Female | <65 | I/II | Unspecific | Doxorubicin | SD | ||
| STARD7 | SNV | Missense_Mutation | rs747311185 | c.697C>T | p.Arg233Trp | p.R233W | Q9NQZ5 | protein_coding | deleterious(0) | probably_damaging(0.999) | TCGA-2W-A8YY-01 | Cervix | cervical & endocervical cancer | Female | <65 | I/II | Chemotherapy | cisplatin | CR |
| STARD7 | SNV | Missense_Mutation | c.1097N>T | p.Arg366Leu | p.R366L | Q9NQZ5 | protein_coding | deleterious_low_confidence(0.03) | benign(0.045) | TCGA-EA-A3QD-01 | Cervix | cervical & endocervical cancer | Female | <65 | III/IV | Chemotherapy | cisplatin | CR | |
| STARD7 | SNV | Missense_Mutation | novel | c.1102G>C | p.Glu368Gln | p.E368Q | Q9NQZ5 | protein_coding | deleterious_low_confidence(0.02) | probably_damaging(0.979) | TCGA-HM-A4S6-01 | Cervix | cervical & endocervical cancer | Female | <65 | III/IV | Chemotherapy | cisplatin | CR |
| Page: 1 2 3 4 5 |
Top |
Related drugs of malignant transformation related genes |
| Identification of chemicals and drugs interact with genes involved in malignant transfromation |
| (DGIdb 4.0) |
| Entrez ID | Symbol | Category | Interaction Types | Drug Claim Name | Drug Name | PMIDs |
| Page: 1 |

Copyright 2023-Present -The University of Texas Health Science Center at Houston |