
|
|||||
|
 | |
| |
| |
| |
| |
| |
|
Gene: STARD5 |
Gene summary for STARD5 |
| Gene information | Species | Human | Gene symbol | STARD5 | Gene ID | 80765 |
| Gene name | StAR related lipid transfer domain containing 5 | |
| Gene Alias | STARD5 | |
| Cytomap | 15q25.1 | |
| Gene Type | protein-coding | GO ID | GO:0006810 | UniProtAcc | Q9NSY2 |
Top |
Malignant transformation analysis |
| Identification of the aberrant gene expression in precancerous and cancerous lesions by comparing the gene expression of stem-like cells in diseased tissues with normal stem cells |
| Entrez ID | Symbol | Replicates | Species | Organ | Tissue | Adj P-value | Log2FC | Malignancy |
| 80765 | STARD5 | LZE4T | Human | Esophagus | ESCC | 2.04e-04 | 1.50e-01 | 0.0811 |
| 80765 | STARD5 | LZE7T | Human | Esophagus | ESCC | 2.06e-05 | 3.82e-01 | 0.0667 |
| 80765 | STARD5 | LZE8T | Human | Esophagus | ESCC | 9.72e-05 | 2.94e-01 | 0.067 |
| 80765 | STARD5 | P1T-E | Human | Esophagus | ESCC | 6.83e-12 | 5.95e-01 | 0.0875 |
| 80765 | STARD5 | P2T-E | Human | Esophagus | ESCC | 1.57e-18 | 2.81e-01 | 0.1177 |
| 80765 | STARD5 | P4T-E | Human | Esophagus | ESCC | 6.73e-04 | 1.64e-01 | 0.1323 |
| 80765 | STARD5 | P5T-E | Human | Esophagus | ESCC | 5.10e-05 | 7.40e-02 | 0.1327 |
| 80765 | STARD5 | P8T-E | Human | Esophagus | ESCC | 2.35e-05 | 1.07e-01 | 0.0889 |
| 80765 | STARD5 | P9T-E | Human | Esophagus | ESCC | 1.21e-14 | 4.19e-01 | 0.1131 |
| 80765 | STARD5 | P10T-E | Human | Esophagus | ESCC | 3.55e-02 | 7.48e-02 | 0.116 |
| 80765 | STARD5 | P11T-E | Human | Esophagus | ESCC | 8.95e-07 | 3.95e-01 | 0.1426 |
| 80765 | STARD5 | P12T-E | Human | Esophagus | ESCC | 9.40e-05 | 5.51e-02 | 0.1122 |
| 80765 | STARD5 | P15T-E | Human | Esophagus | ESCC | 6.24e-04 | 1.76e-01 | 0.1149 |
| 80765 | STARD5 | P20T-E | Human | Esophagus | ESCC | 1.30e-04 | 1.20e-01 | 0.1124 |
| 80765 | STARD5 | P21T-E | Human | Esophagus | ESCC | 2.14e-12 | 3.34e-01 | 0.1617 |
| 80765 | STARD5 | P22T-E | Human | Esophagus | ESCC | 1.41e-07 | 1.45e-01 | 0.1236 |
| 80765 | STARD5 | P23T-E | Human | Esophagus | ESCC | 9.86e-06 | 2.91e-01 | 0.108 |
| 80765 | STARD5 | P26T-E | Human | Esophagus | ESCC | 9.23e-16 | 3.43e-01 | 0.1276 |
| 80765 | STARD5 | P27T-E | Human | Esophagus | ESCC | 1.41e-14 | 2.23e-01 | 0.1055 |
| 80765 | STARD5 | P28T-E | Human | Esophagus | ESCC | 1.86e-20 | 3.75e-01 | 0.1149 |
| Page: 1 2 3 4 |
| Tissue | Expression Dynamics | Abbreviation |
| Esophagus | 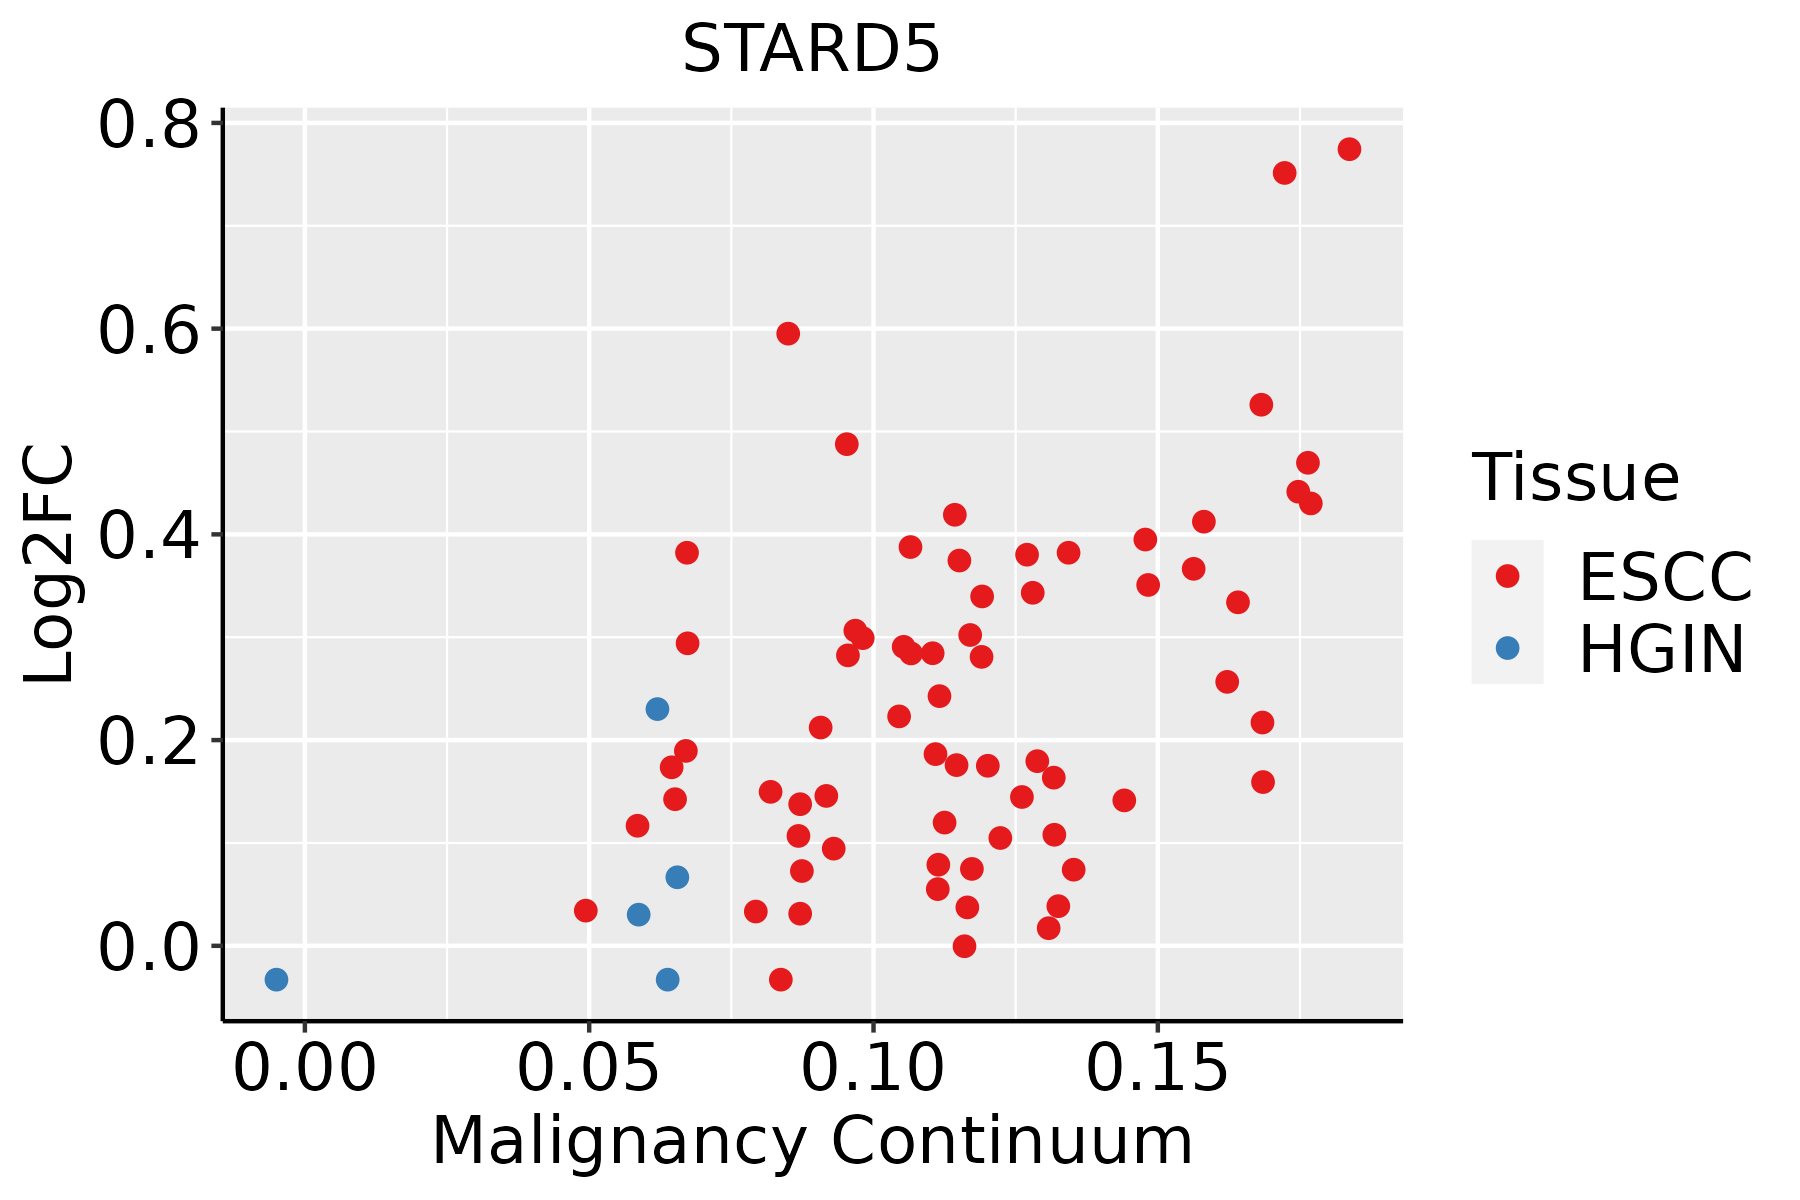 | ESCC: Esophageal squamous cell carcinoma |
| HGIN: High-grade intraepithelial neoplasias | ||
| LGIN: Low-grade intraepithelial neoplasias | ||
| Oral Cavity | 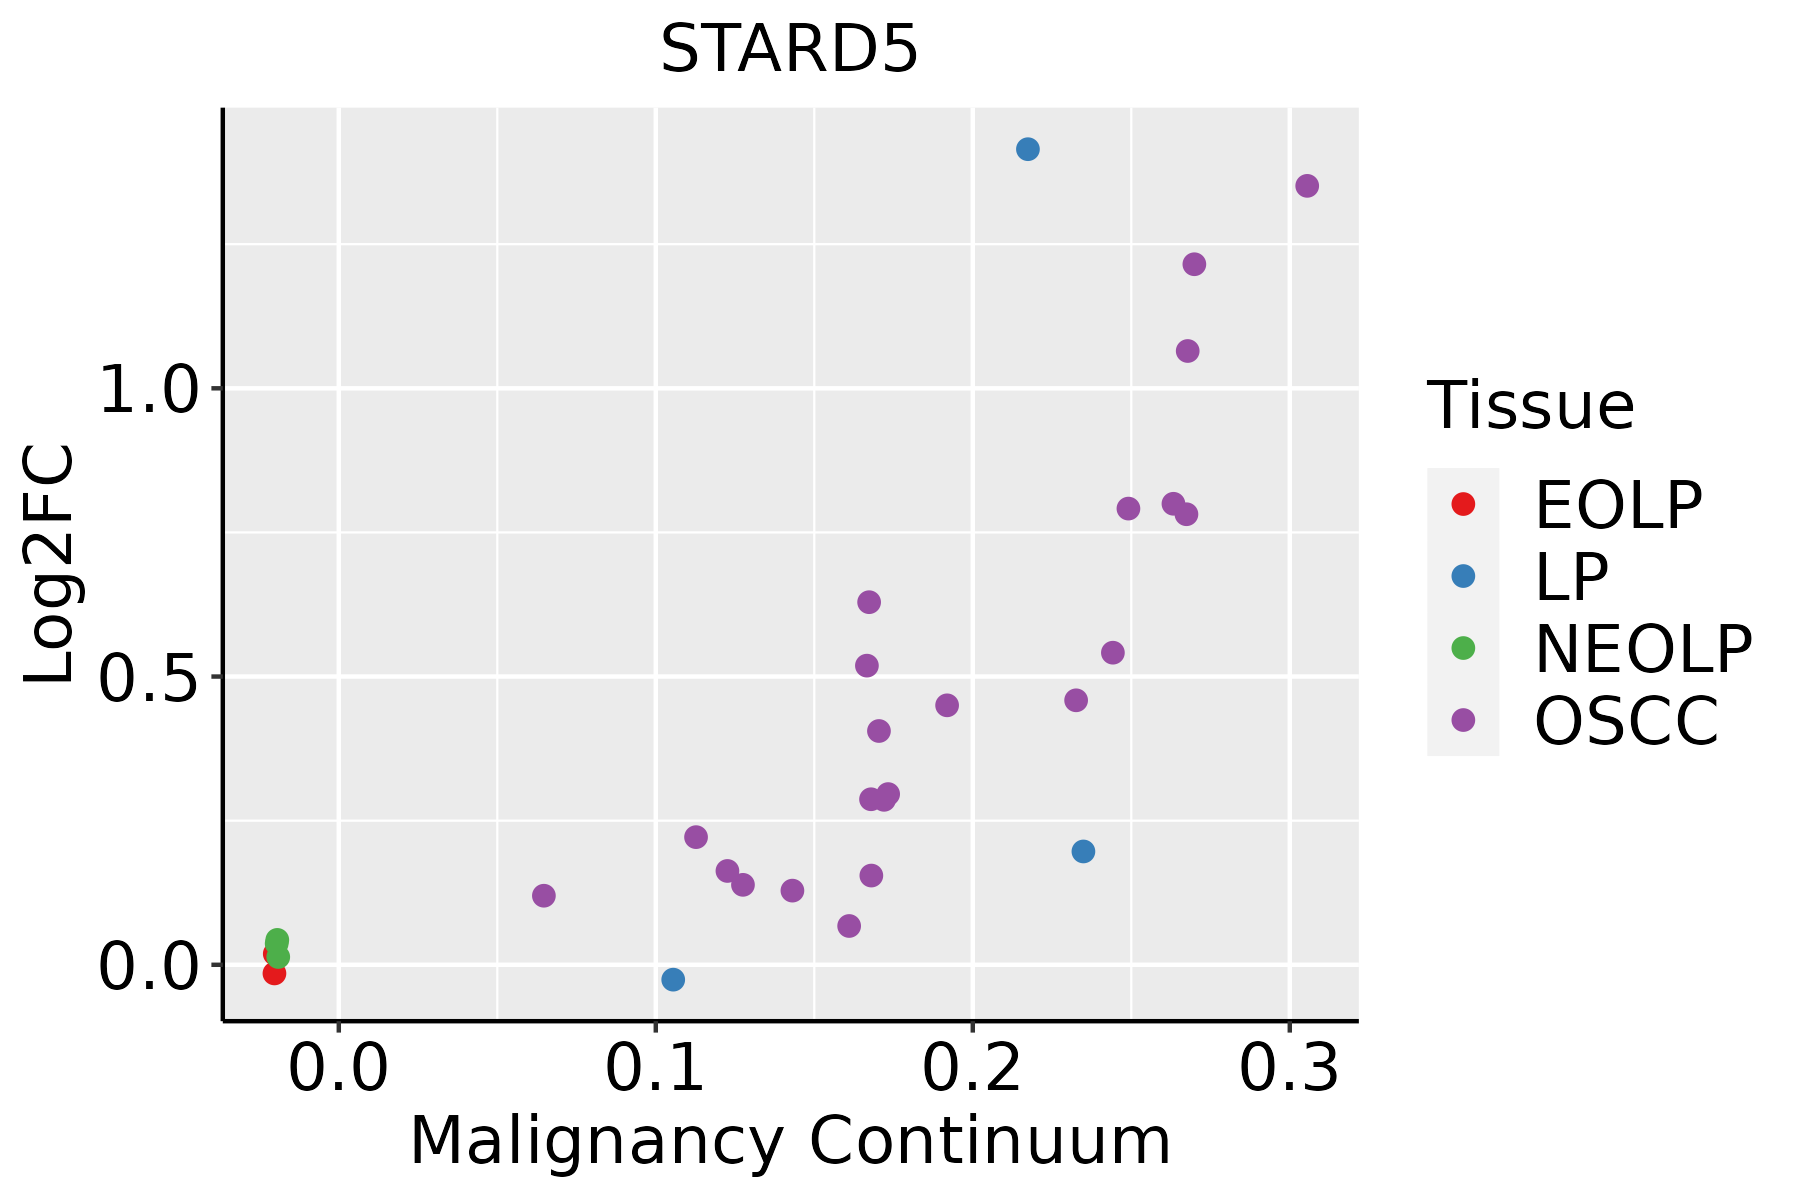 | EOLP: Erosive Oral lichen planus |
| LP: leukoplakia | ||
| NEOLP: Non-erosive oral lichen planus | ||
| OSCC: Oral squamous cell carcinoma | ||
| Skin | 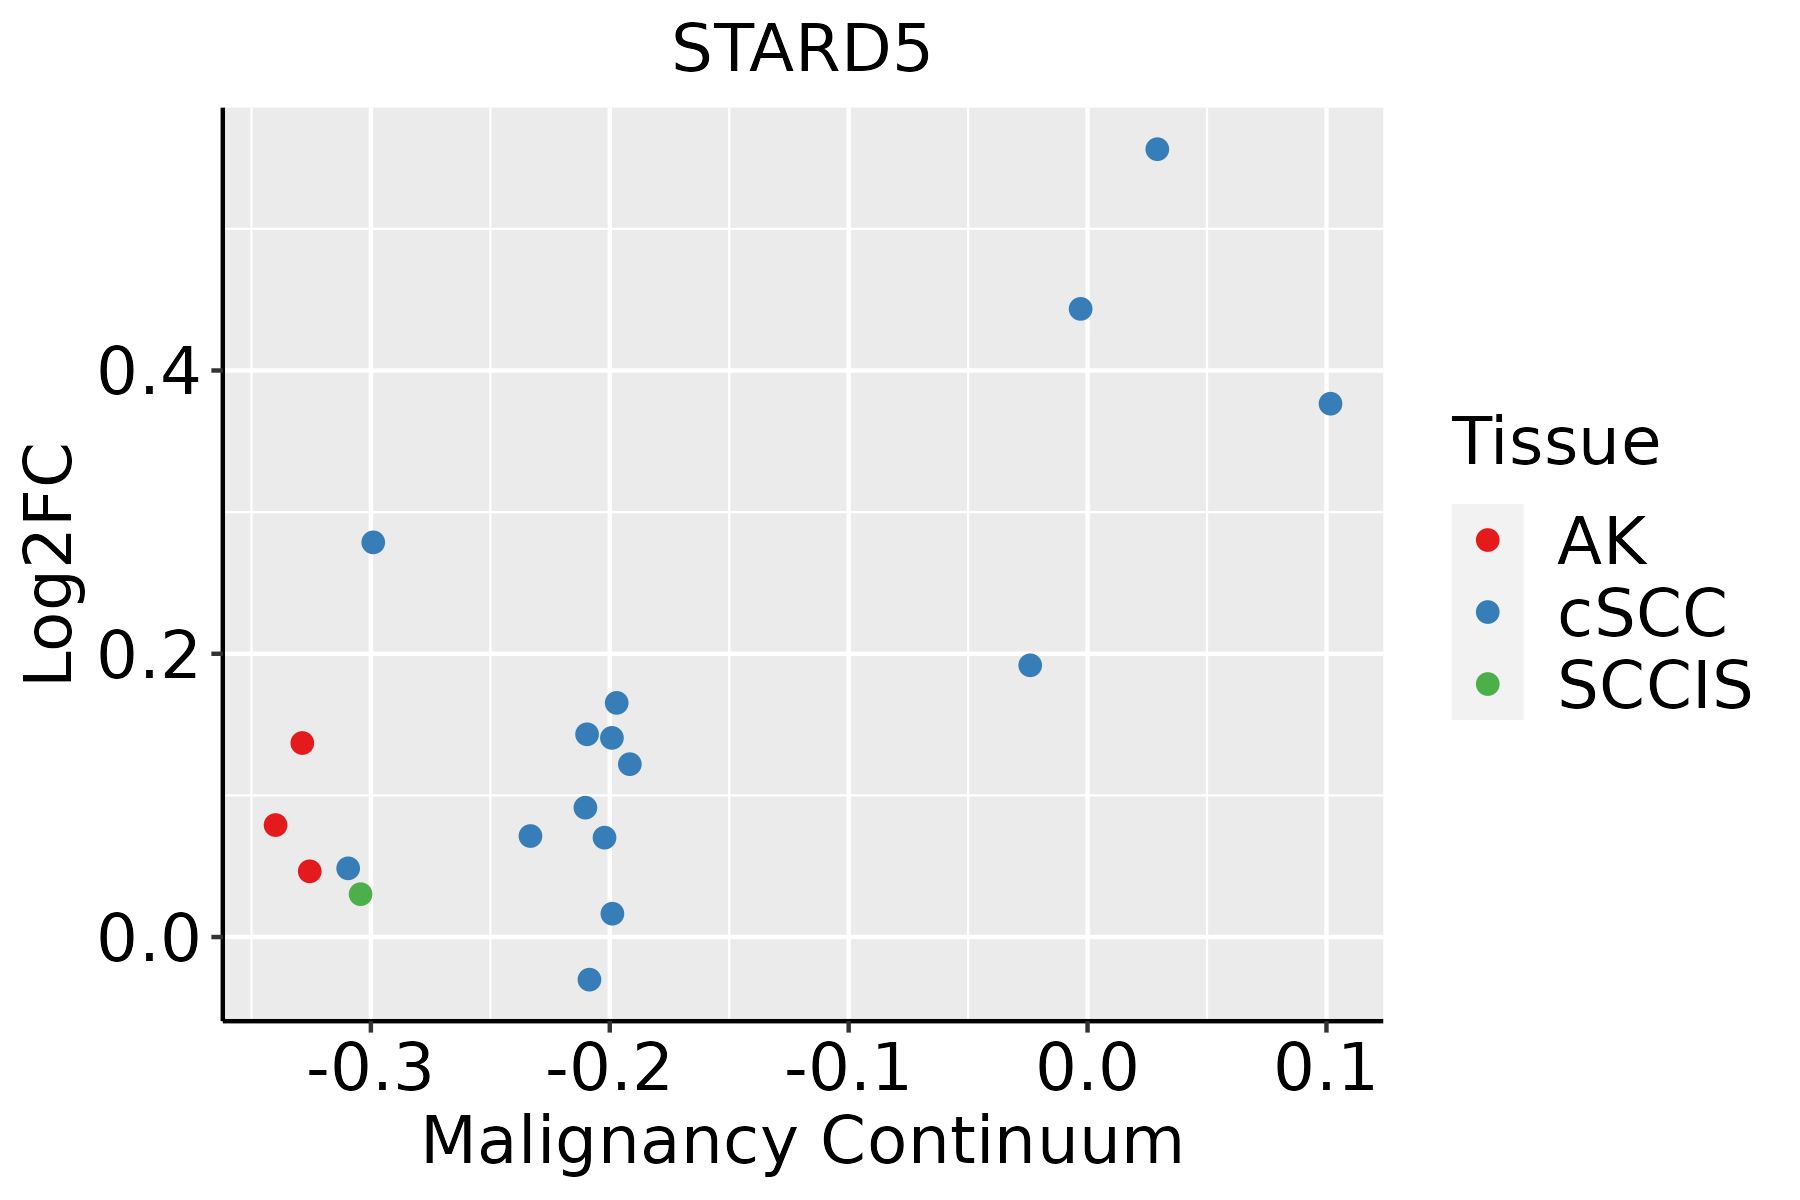 | AK: Actinic keratosis |
| cSCC: Cutaneous squamous cell carcinoma | ||
| SCCIS:squamous cell carcinoma in situ |
| ∗log2FC in expression of this searched gene in stem-like cells from each diseased tissue sample relative to stem-like cells in normal samples in each tissue plotted against the malignancy continuum. Samples are colored based on if they are from different disease stage. |
Top |
Malignant transformation related pathway analysis |
| Find out the enriched GO biological processes and KEGG pathways involved in transition from healthy to precancer to cancer |
| Tissue | Disease Stage | Enriched GO biological Processes |
| Colorectum | AD |  |
| Colorectum | SER |  |
| Colorectum | MSS |  |
| Colorectum | MSI-H |  |
| Colorectum | FAP |  |
| ∗Top 15 enriched GO BP terms are showed in the bar plot of each disease state in each tissue. Each row represents a significant GO biological process which is colored according to the -log10(p.adjust). |
| Page: 1 2 3 4 5 6 7 8 9 |
| GO ID | Tissue | Disease Stage | Description | Gene Ratio | Bg Ratio | pvalue | p.adjust | Count |
| GO:01200094 | Skin | AK | intermembrane lipid transfer | 11/1910 | 48/18723 | 7.81e-03 | 3.96e-02 | 11 |
| Page: 1 |
| Pathway ID | Tissue | Disease Stage | Description | Gene Ratio | Bg Ratio | pvalue | p.adjust | qvalue | Count |
| Page: 1 |
Top |
Cell-cell communication analysis |
| Identification of potential cell-cell interactions between two cell types and their ligand-receptor pairs for different disease states |
| Ligand | Receptor | LRpair | Pathway | Tissue | Disease Stage |
| Page: 1 |
Top |
Single-cell gene regulatory network inference analysis |
| Find out the significant the regulons (TFs) and the target genes of each regulon across cell types for different disease states |
| TF | Cell Type | Tissue | Disease Stage | Target Gene | RSS | Regulon Activity |
| ∗The dot plots of a searched regulon are shown for all cell subpopulations in each disease state of each tissue based on the regulon specific score inferred using pySCENIC and by calculating the average expression. |
| Page: 1 |
Top |
Somatic mutation of malignant transformation related genes |
| Annotation of somatic variants for genes involved in malignant transformation |
| Hugo Symbol | Variant Class | Variant Classification | dbSNP RS | HGVSc | HGVSp | HGVSp Short | SWISSPROT | BIOTYPE | SIFT | PolyPhen | Tumor Sample Barcode | Tissue | Histology | Sex | Age | Stage | Therapy Types | Drugs | Outcome |
| STARD5 | SNV | Missense_Mutation | c.376N>C | p.Glu126Gln | p.E126Q | Q9NSY2 | protein_coding | deleterious(0.02) | possibly_damaging(0.579) | TCGA-AR-A2LE-01 | Breast | breast invasive carcinoma | Female | >=65 | I/II | Hormone Therapy | tamoxiphen | PD | |
| STARD5 | insertion | Nonsense_Mutation | novel | c.110_111insTTTTAGATGTGTCTAAATAATATATAAATTTTTACTTAAAAT | p.Ser37_Val38insPheArgCysValTerIleIleTyrLysPheLeuLeuLysIle | p.S37_V38insFRCV*IIYKFLLKI | Q9NSY2 | protein_coding | TCGA-BH-A0HY-01 | Breast | breast invasive carcinoma | Female | <65 | I/II | Hormone Therapy | taxotere | CR | ||
| STARD5 | SNV | Missense_Mutation | novel | c.525N>G | p.Phe175Leu | p.F175L | Q9NSY2 | protein_coding | tolerated(0.08) | probably_damaging(0.942) | TCGA-JW-A5VL-01 | Cervix | cervical & endocervical cancer | Female | <65 | I/II | Unknown | Unknown | SD |
| STARD5 | SNV | Missense_Mutation | rs772957871 | c.376N>A | p.Glu126Lys | p.E126K | Q9NSY2 | protein_coding | deleterious(0.02) | benign(0.07) | TCGA-JW-A5VL-01 | Cervix | cervical & endocervical cancer | Female | <65 | I/II | Unknown | Unknown | SD |
| STARD5 | SNV | Missense_Mutation | c.349G>A | p.Val117Met | p.V117M | Q9NSY2 | protein_coding | deleterious(0) | probably_damaging(0.993) | TCGA-AA-3812-01 | Colorectum | colon adenocarcinoma | Female | >=65 | I/II | Unknown | Unknown | PD | |
| STARD5 | SNV | Missense_Mutation | c.186N>T | p.Glu62Asp | p.E62D | Q9NSY2 | protein_coding | tolerated(0.2) | benign(0.003) | TCGA-AZ-6601-01 | Colorectum | colon adenocarcinoma | Male | >=65 | I/II | Unknown | Unknown | PD | |
| STARD5 | SNV | Missense_Mutation | novel | c.335N>A | p.Ser112Tyr | p.S112Y | Q9NSY2 | protein_coding | deleterious(0) | probably_damaging(0.987) | TCGA-BK-A6W3-01 | Endometrium | uterine corpus endometrioid carcinoma | Female | <65 | I/II | Unknown | Unknown | SD |
| STARD5 | SNV | Missense_Mutation | novel | c.125N>T | p.Pro42Leu | p.P42L | Q9NSY2 | protein_coding | deleterious(0.01) | probably_damaging(0.979) | TCGA-E6-A1LX-01 | Endometrium | uterine corpus endometrioid carcinoma | Female | <65 | I/II | Unknown | Unknown | SD |
| STARD5 | SNV | Missense_Mutation | c.143N>T | p.Gly48Val | p.G48V | Q9NSY2 | protein_coding | deleterious(0) | probably_damaging(1) | TCGA-DD-A1EE-01 | Liver | liver hepatocellular carcinoma | Male | >=65 | III/IV | Unknown | Unknown | PD | |
| STARD5 | SNV | Missense_Mutation | c.143N>T | p.Gly48Val | p.G48V | Q9NSY2 | protein_coding | deleterious(0) | probably_damaging(1) | TCGA-G3-A25U-01 | Liver | liver hepatocellular carcinoma | Female | <65 | I/II | Unknown | Unknown | SD |
| Page: 1 2 |
Top |
Related drugs of malignant transformation related genes |
| Identification of chemicals and drugs interact with genes involved in malignant transfromation |
| (DGIdb 4.0) |
| Entrez ID | Symbol | Category | Interaction Types | Drug Claim Name | Drug Name | PMIDs |
| Page: 1 |

Copyright 2023-Present -The University of Texas Health Science Center at Houston |