
|
|||||
|
 | |
| |
| |
| |
| |
| |
|
Gene: STARD4 |
Gene summary for STARD4 |
| Gene information | Species | Human | Gene symbol | STARD4 | Gene ID | 134429 |
| Gene name | StAR related lipid transfer domain containing 4 | |
| Gene Alias | STARD4 | |
| Cytomap | 5q22.1 | |
| Gene Type | protein-coding | GO ID | GO:0006082 | UniProtAcc | Q96DR4 |
Top |
Malignant transformation analysis |
| Identification of the aberrant gene expression in precancerous and cancerous lesions by comparing the gene expression of stem-like cells in diseased tissues with normal stem cells |
| Entrez ID | Symbol | Replicates | Species | Organ | Tissue | Adj P-value | Log2FC | Malignancy |
| 134429 | STARD4 | LZE4T | Human | Esophagus | ESCC | 1.70e-03 | 1.65e-01 | 0.0811 |
| 134429 | STARD4 | LZE24T | Human | Esophagus | ESCC | 8.18e-15 | 4.08e-01 | 0.0596 |
| 134429 | STARD4 | LZE6T | Human | Esophagus | ESCC | 2.96e-03 | 1.65e-01 | 0.0845 |
| 134429 | STARD4 | P2T-E | Human | Esophagus | ESCC | 1.88e-04 | 1.38e-01 | 0.1177 |
| 134429 | STARD4 | P4T-E | Human | Esophagus | ESCC | 1.06e-14 | 3.08e-01 | 0.1323 |
| 134429 | STARD4 | P5T-E | Human | Esophagus | ESCC | 2.02e-06 | 1.64e-01 | 0.1327 |
| 134429 | STARD4 | P9T-E | Human | Esophagus | ESCC | 4.01e-04 | 1.14e-01 | 0.1131 |
| 134429 | STARD4 | P10T-E | Human | Esophagus | ESCC | 6.56e-15 | 2.75e-01 | 0.116 |
| 134429 | STARD4 | P12T-E | Human | Esophagus | ESCC | 8.40e-04 | 1.07e-01 | 0.1122 |
| 134429 | STARD4 | P15T-E | Human | Esophagus | ESCC | 1.32e-06 | 1.79e-01 | 0.1149 |
| 134429 | STARD4 | P17T-E | Human | Esophagus | ESCC | 1.49e-02 | 1.67e-01 | 0.1278 |
| 134429 | STARD4 | P21T-E | Human | Esophagus | ESCC | 4.44e-08 | 1.58e-01 | 0.1617 |
| 134429 | STARD4 | P22T-E | Human | Esophagus | ESCC | 9.56e-08 | 1.58e-01 | 0.1236 |
| 134429 | STARD4 | P23T-E | Human | Esophagus | ESCC | 2.13e-09 | 2.42e-01 | 0.108 |
| 134429 | STARD4 | P24T-E | Human | Esophagus | ESCC | 1.66e-02 | 8.47e-02 | 0.1287 |
| 134429 | STARD4 | P26T-E | Human | Esophagus | ESCC | 4.41e-07 | 1.79e-01 | 0.1276 |
| 134429 | STARD4 | P27T-E | Human | Esophagus | ESCC | 9.44e-07 | 1.38e-01 | 0.1055 |
| 134429 | STARD4 | P30T-E | Human | Esophagus | ESCC | 9.20e-05 | 2.35e-01 | 0.137 |
| 134429 | STARD4 | P32T-E | Human | Esophagus | ESCC | 4.44e-08 | 1.77e-01 | 0.1666 |
| 134429 | STARD4 | P36T-E | Human | Esophagus | ESCC | 2.82e-02 | 1.21e-01 | 0.1187 |
| Page: 1 2 3 |
| Tissue | Expression Dynamics | Abbreviation |
| Esophagus | 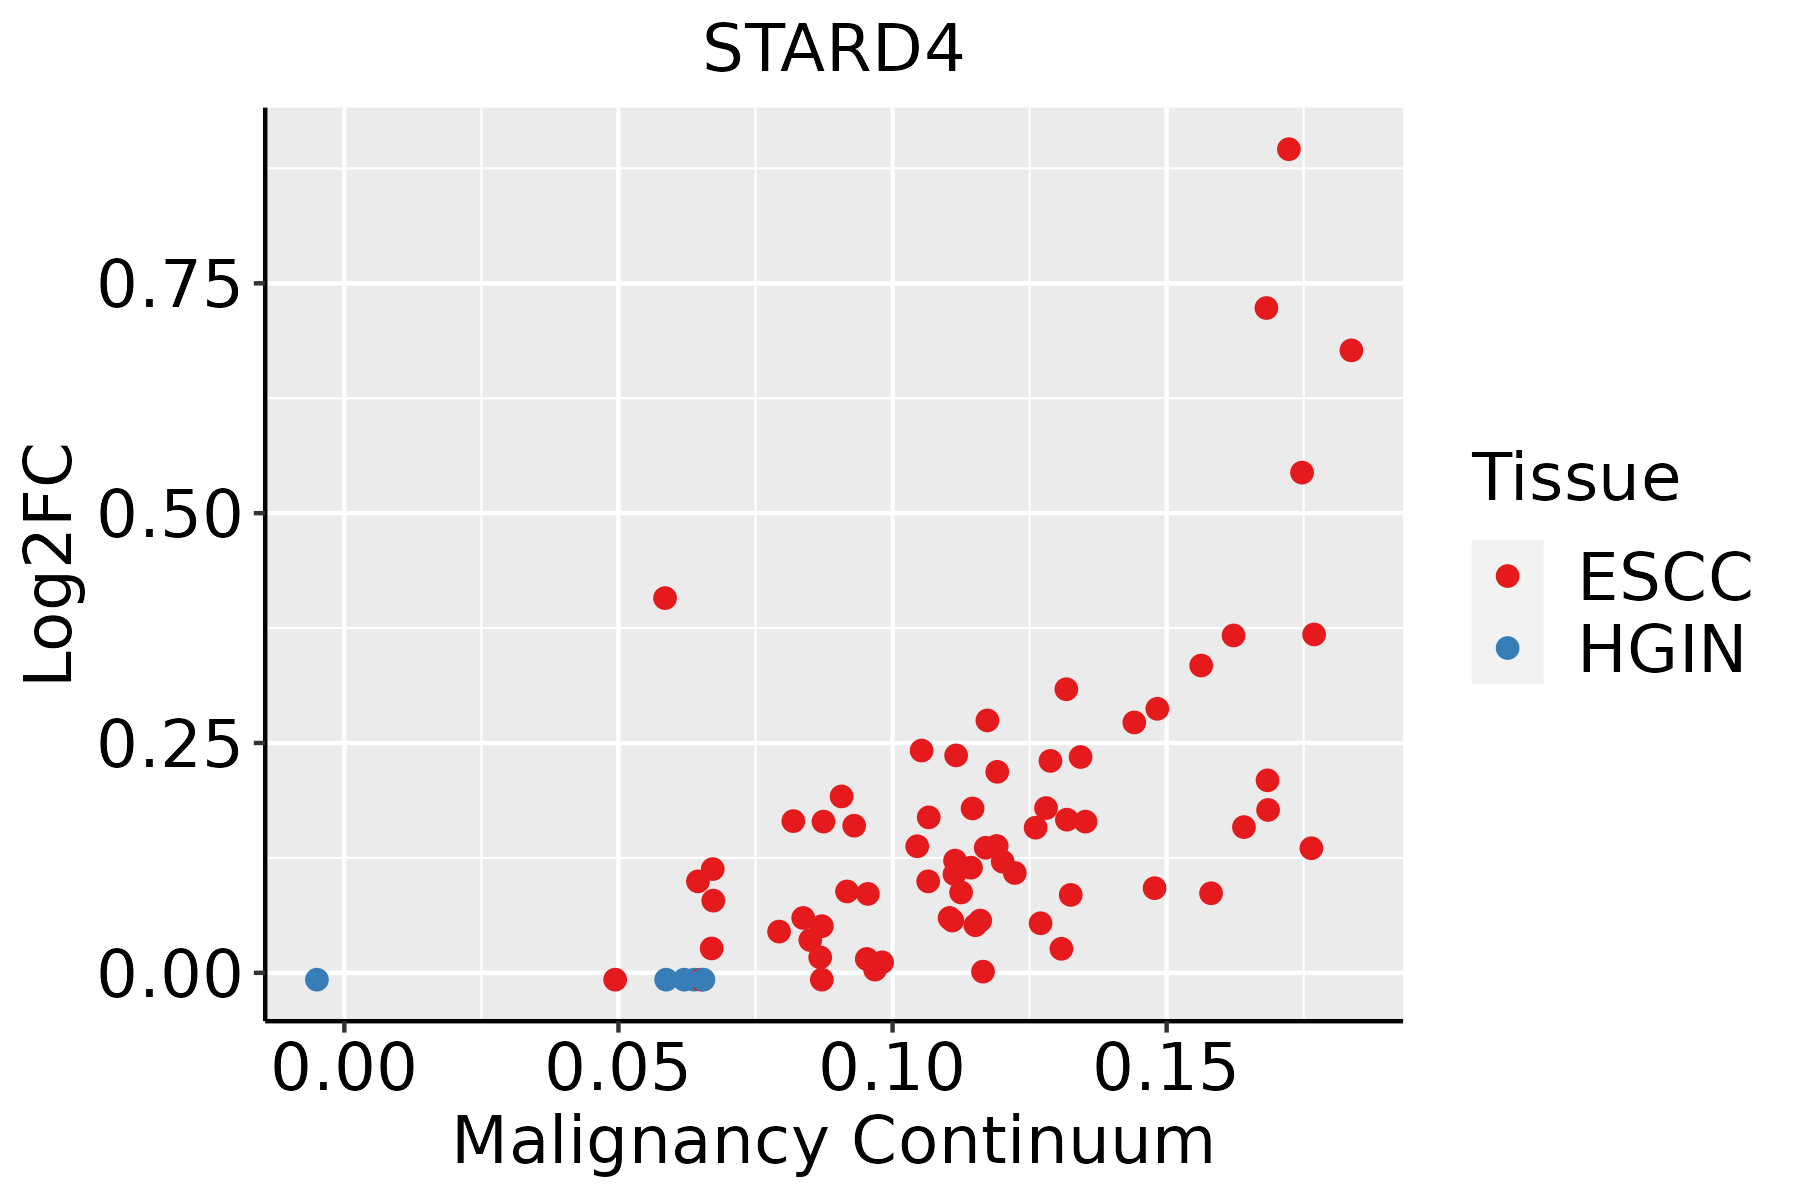 | ESCC: Esophageal squamous cell carcinoma |
| HGIN: High-grade intraepithelial neoplasias | ||
| LGIN: Low-grade intraepithelial neoplasias | ||
| Liver | 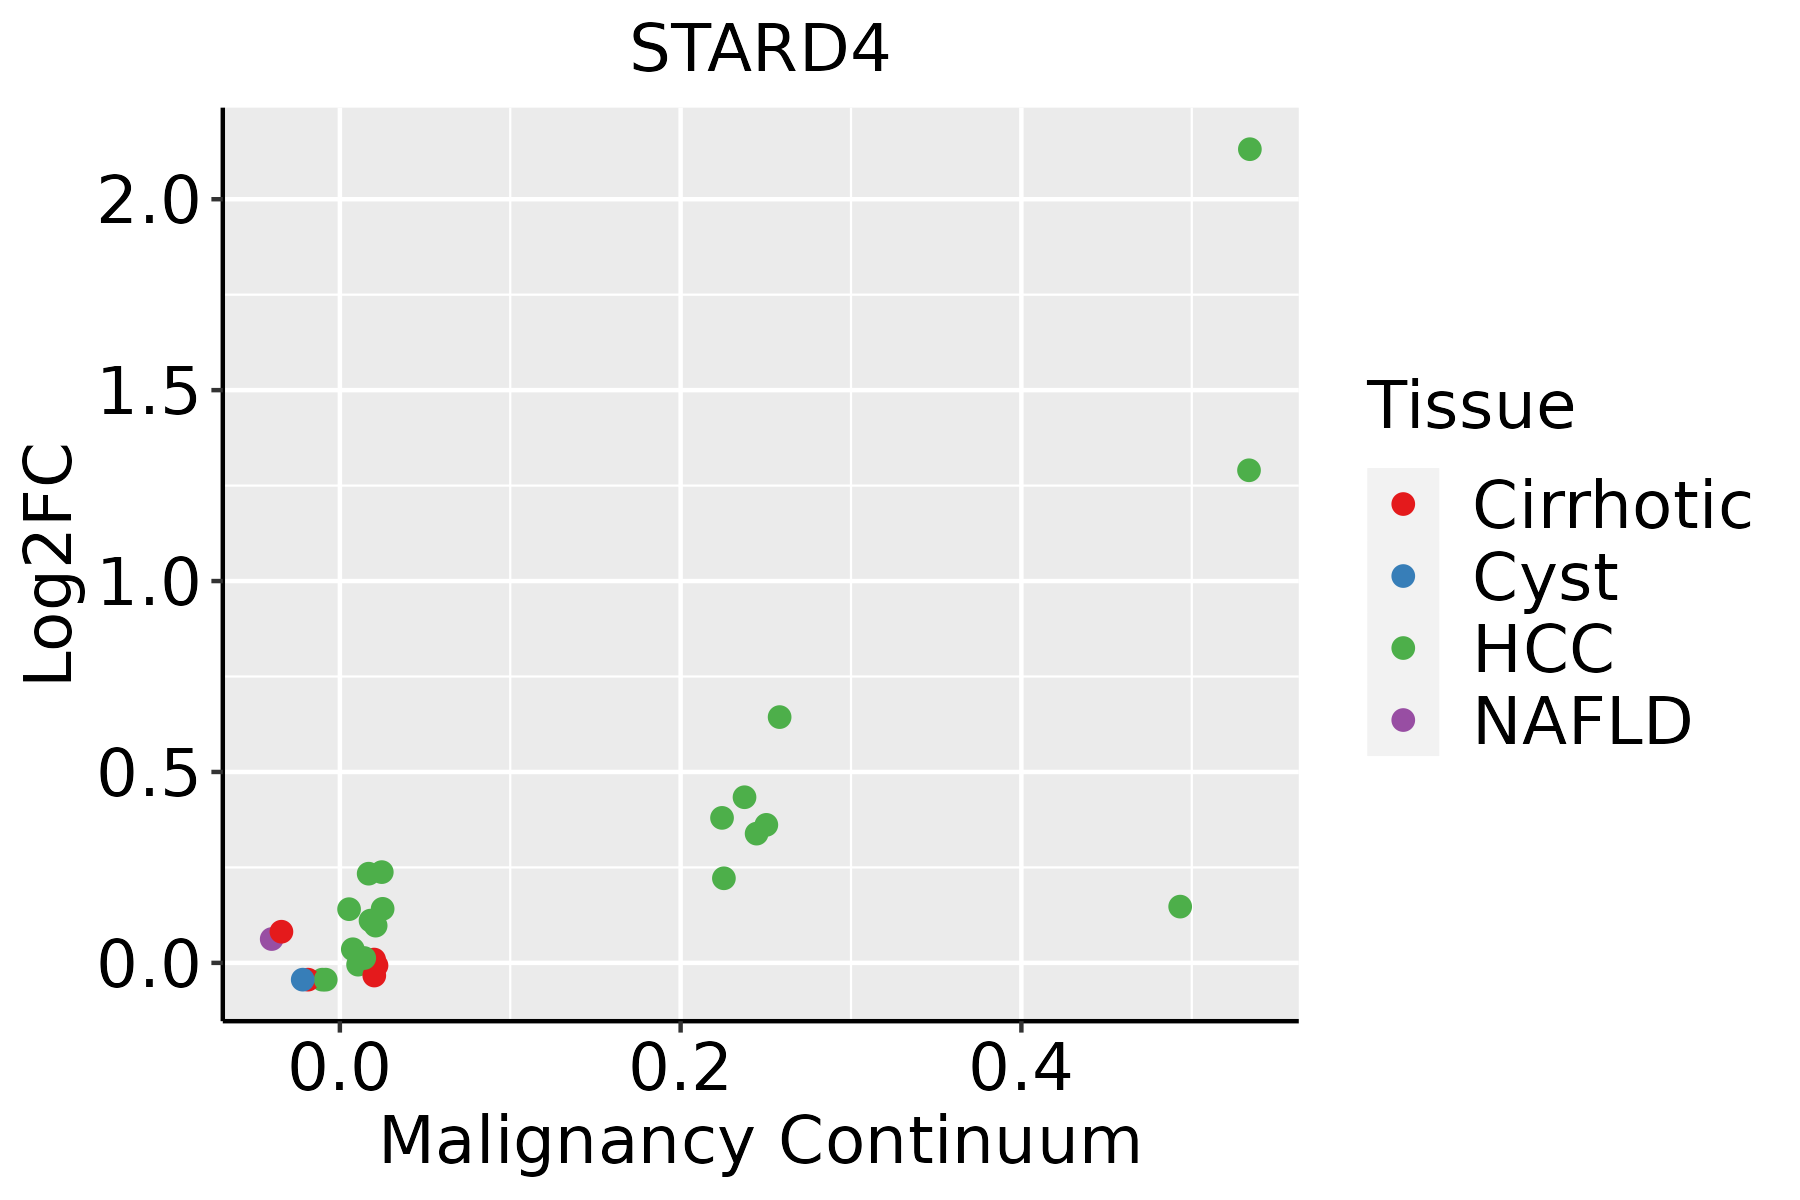 | HCC: Hepatocellular carcinoma |
| NAFLD: Non-alcoholic fatty liver disease | ||
| Oral Cavity | 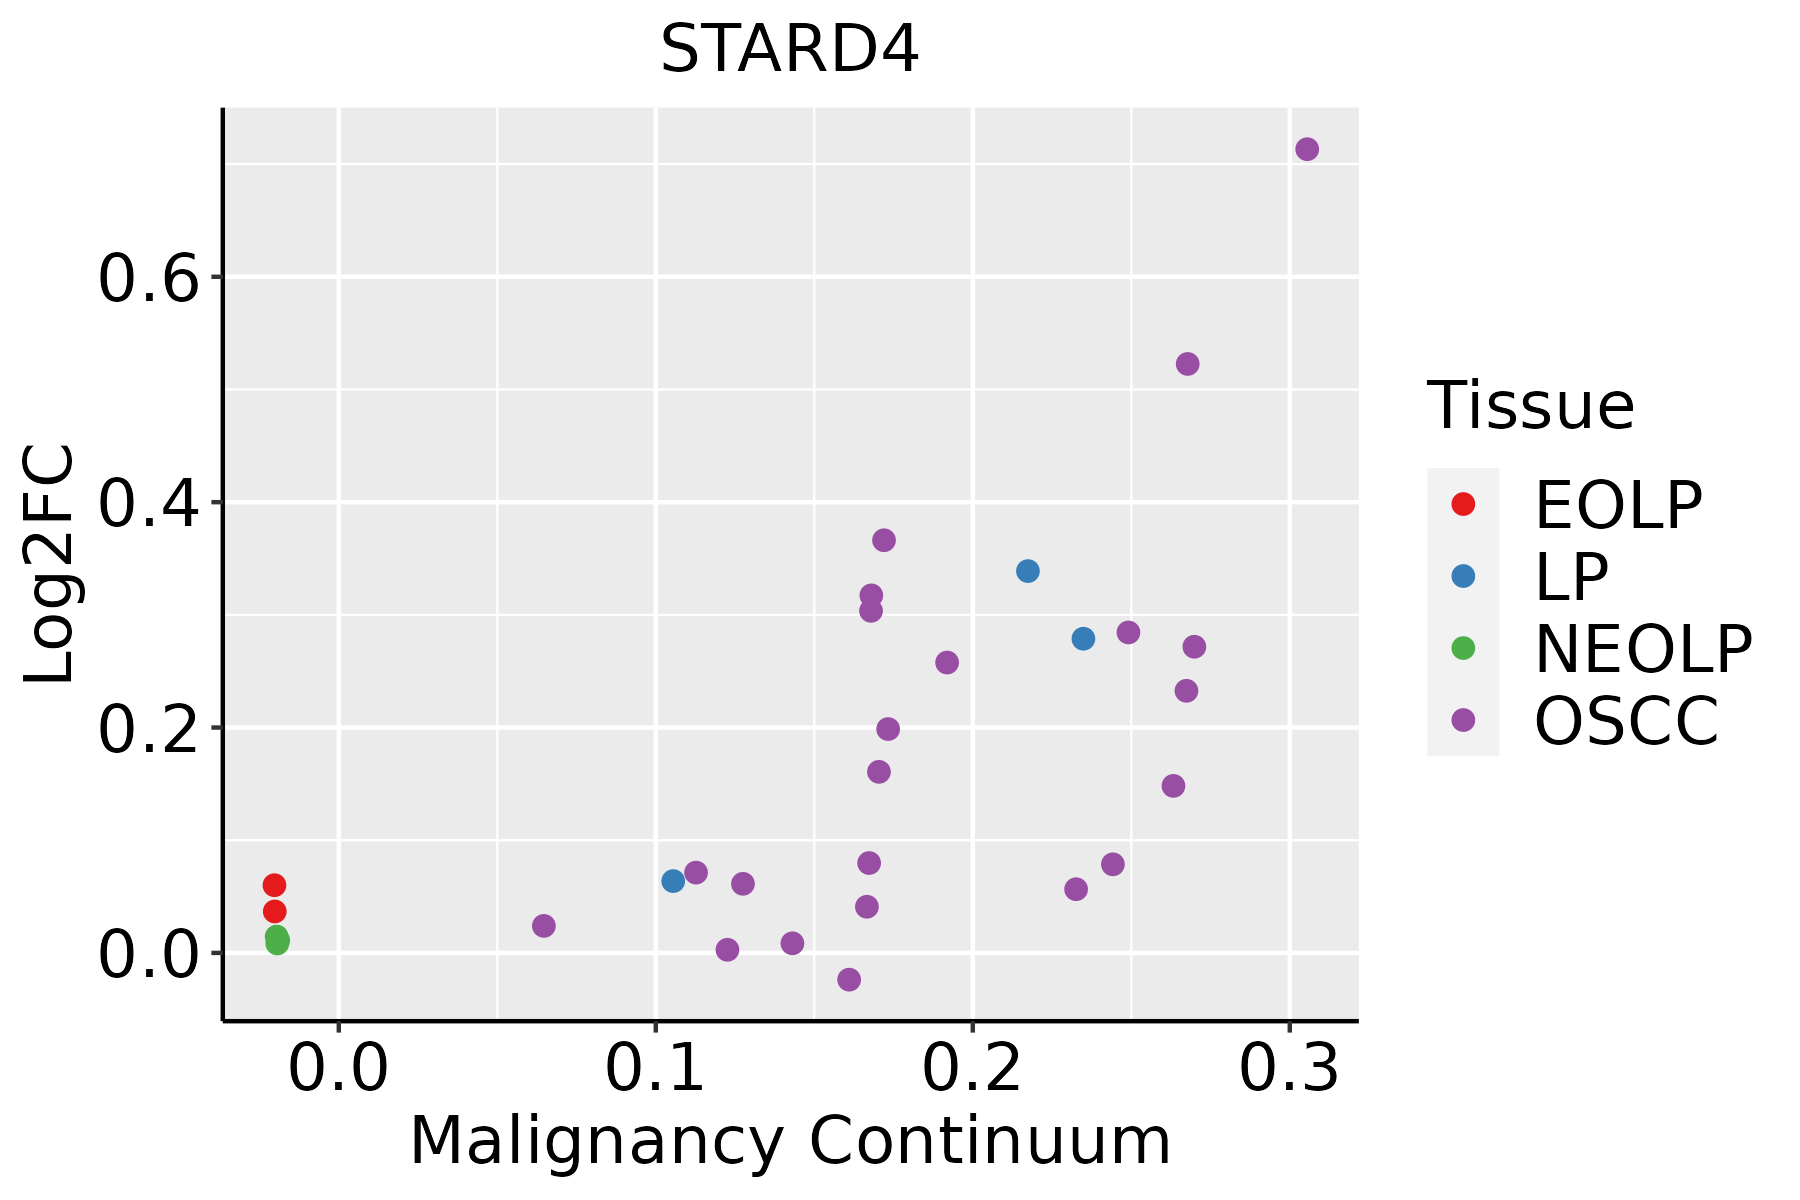 | EOLP: Erosive Oral lichen planus |
| LP: leukoplakia | ||
| NEOLP: Non-erosive oral lichen planus | ||
| OSCC: Oral squamous cell carcinoma | ||
| Thyroid |  | ATC: Anaplastic thyroid cancer |
| HT: Hashimoto's thyroiditis | ||
| PTC: Papillary thyroid cancer |
| ∗log2FC in expression of this searched gene in stem-like cells from each diseased tissue sample relative to stem-like cells in normal samples in each tissue plotted against the malignancy continuum. Samples are colored based on if they are from different disease stage. |
Top |
Malignant transformation related pathway analysis |
| Find out the enriched GO biological processes and KEGG pathways involved in transition from healthy to precancer to cancer |
| Tissue | Disease Stage | Enriched GO biological Processes |
| Colorectum | AD |  |
| Colorectum | SER |  |
| Colorectum | MSS |  |
| Colorectum | MSI-H |  |
| Colorectum | FAP |  |
| ∗Top 15 enriched GO BP terms are showed in the bar plot of each disease state in each tissue. Each row represents a significant GO biological process which is colored according to the -log10(p.adjust). |
| Page: 1 2 3 4 5 6 7 8 9 |
| GO ID | Tissue | Disease Stage | Description | Gene Ratio | Bg Ratio | pvalue | p.adjust | Count |
| GO:0051235110 | Esophagus | ESCC | maintenance of location | 200/8552 | 327/18723 | 1.01e-08 | 2.02e-07 | 200 |
| GO:00199155 | Esophagus | ESCC | lipid storage | 58/8552 | 87/18723 | 6.15e-05 | 4.72e-04 | 58 |
| GO:00463948 | Esophagus | ESCC | carboxylic acid biosynthetic process | 175/8552 | 314/18723 | 1.98e-04 | 1.26e-03 | 175 |
| GO:00160538 | Esophagus | ESCC | organic acid biosynthetic process | 175/8552 | 316/18723 | 3.04e-04 | 1.82e-03 | 175 |
| GO:00620129 | Esophagus | ESCC | regulation of small molecule metabolic process | 184/8552 | 334/18723 | 3.11e-04 | 1.85e-03 | 184 |
| GO:00421805 | Esophagus | ESCC | cellular ketone metabolic process | 120/8552 | 211/18723 | 6.70e-04 | 3.55e-03 | 120 |
| GO:00066946 | Esophagus | ESCC | steroid biosynthetic process | 98/8552 | 173/18723 | 2.34e-03 | 1.03e-02 | 98 |
| GO:00302586 | Esophagus | ESCC | lipid modification | 116/8552 | 212/18723 | 4.90e-03 | 1.89e-02 | 116 |
| GO:19016174 | Esophagus | ESCC | organic hydroxy compound biosynthetic process | 128/8552 | 237/18723 | 5.86e-03 | 2.16e-02 | 128 |
| GO:00323661 | Esophagus | ESCC | intracellular sterol transport | 20/8552 | 29/18723 | 9.66e-03 | 3.34e-02 | 20 |
| GO:00323671 | Esophagus | ESCC | intracellular cholesterol transport | 20/8552 | 29/18723 | 9.66e-03 | 3.34e-02 | 20 |
| GO:00192168 | Esophagus | ESCC | regulation of lipid metabolic process | 172/8552 | 331/18723 | 1.20e-02 | 4.02e-02 | 172 |
| GO:001605321 | Liver | HCC | organic acid biosynthetic process | 200/7958 | 316/18723 | 5.24e-14 | 3.22e-12 | 200 |
| GO:004639421 | Liver | HCC | carboxylic acid biosynthetic process | 198/7958 | 314/18723 | 1.19e-13 | 6.78e-12 | 198 |
| GO:00082022 | Liver | HCC | steroid metabolic process | 188/7958 | 319/18723 | 1.96e-09 | 5.63e-08 | 188 |
| GO:006201222 | Liver | HCC | regulation of small molecule metabolic process | 190/7958 | 334/18723 | 6.77e-08 | 1.40e-06 | 190 |
| GO:007233021 | Liver | HCC | monocarboxylic acid biosynthetic process | 129/7958 | 214/18723 | 1.08e-07 | 2.09e-06 | 129 |
| GO:005123521 | Liver | HCC | maintenance of location | 185/7958 | 327/18723 | 1.70e-07 | 3.12e-06 | 185 |
| GO:00066942 | Liver | HCC | steroid biosynthetic process | 104/7958 | 173/18723 | 2.13e-06 | 2.91e-05 | 104 |
| GO:004218021 | Liver | HCC | cellular ketone metabolic process | 123/7958 | 211/18723 | 2.52e-06 | 3.37e-05 | 123 |
| Page: 1 2 3 |
| Pathway ID | Tissue | Disease Stage | Description | Gene Ratio | Bg Ratio | pvalue | p.adjust | qvalue | Count |
| Page: 1 |
Top |
Cell-cell communication analysis |
| Identification of potential cell-cell interactions between two cell types and their ligand-receptor pairs for different disease states |
| Ligand | Receptor | LRpair | Pathway | Tissue | Disease Stage |
| Page: 1 |
Top |
Single-cell gene regulatory network inference analysis |
| Find out the significant the regulons (TFs) and the target genes of each regulon across cell types for different disease states |
| TF | Cell Type | Tissue | Disease Stage | Target Gene | RSS | Regulon Activity |
| ∗The dot plots of a searched regulon are shown for all cell subpopulations in each disease state of each tissue based on the regulon specific score inferred using pySCENIC and by calculating the average expression. |
| Page: 1 |
Top |
Somatic mutation of malignant transformation related genes |
| Annotation of somatic variants for genes involved in malignant transformation |
| Hugo Symbol | Variant Class | Variant Classification | dbSNP RS | HGVSc | HGVSp | HGVSp Short | SWISSPROT | BIOTYPE | SIFT | PolyPhen | Tumor Sample Barcode | Tissue | Histology | Sex | Age | Stage | Therapy Types | Drugs | Outcome |
| STARD4 | SNV | Missense_Mutation | c.547N>G | p.Gln183Glu | p.Q183E | Q96DR4 | protein_coding | deleterious(0) | possibly_damaging(0.616) | TCGA-A2-A0SW-01 | Breast | breast invasive carcinoma | Female | >=65 | III/IV | Hormone Therapy | arimidex | PD | |
| STARD4 | SNV | Missense_Mutation | c.416N>C | p.Asp139Ala | p.D139A | Q96DR4 | protein_coding | tolerated(0.43) | benign(0.014) | TCGA-AO-A03T-01 | Breast | breast invasive carcinoma | Female | <65 | I/II | Chemotherapy | cyclophosphamide | SD | |
| STARD4 | SNV | Missense_Mutation | c.517N>G | p.Ile173Val | p.I173V | Q96DR4 | protein_coding | tolerated(0.14) | benign(0.013) | TCGA-BH-A0BJ-01 | Breast | breast invasive carcinoma | Female | <65 | I/II | Chemotherapy | doxorubicin | SD | |
| STARD4 | SNV | Missense_Mutation | c.415N>C | p.Asp139His | p.D139H | Q96DR4 | protein_coding | tolerated(0.27) | benign(0.283) | TCGA-DR-A0ZM-01 | Cervix | cervical & endocervical cancer | Female | <65 | III/IV | Unspecific | Cisplatin | SD | |
| STARD4 | SNV | Missense_Mutation | c.392C>A | p.Ser131Tyr | p.S131Y | Q96DR4 | protein_coding | deleterious(0) | probably_damaging(0.965) | TCGA-CK-4951-01 | Colorectum | colon adenocarcinoma | Female | >=65 | I/II | Unknown | Unknown | PD | |
| STARD4 | SNV | Missense_Mutation | novel | c.163G>T | p.Ala55Ser | p.A55S | Q96DR4 | protein_coding | tolerated(0.08) | possibly_damaging(0.544) | TCGA-AG-A002-01 | Colorectum | rectum adenocarcinoma | Male | <65 | I/II | Unknown | Unknown | SD |
| STARD4 | SNV | Missense_Mutation | rs143239767 | c.227N>A | p.Arg76His | p.R76H | Q96DR4 | protein_coding | deleterious(0.01) | possibly_damaging(0.501) | TCGA-A5-A0G2-01 | Endometrium | uterine corpus endometrioid carcinoma | Female | <65 | III/IV | Unknown | Unknown | SD |
| STARD4 | SNV | Missense_Mutation | rs369793461 | c.605N>A | p.Arg202Gln | p.R202Q | Q96DR4 | protein_coding | tolerated(1) | benign(0.007) | TCGA-A5-A2K5-01 | Endometrium | uterine corpus endometrioid carcinoma | Female | >=65 | I/II | Unknown | Unknown | SD |
| STARD4 | SNV | Missense_Mutation | rs566737403 | c.554N>T | p.Ala185Val | p.A185V | Q96DR4 | protein_coding | tolerated(1) | benign(0.18) | TCGA-AJ-A2QO-01 | Endometrium | uterine corpus endometrioid carcinoma | Female | >=65 | I/II | Unknown | Unknown | SD |
| STARD4 | SNV | Missense_Mutation | rs752789420 | c.226N>T | p.Arg76Cys | p.R76C | Q96DR4 | protein_coding | deleterious(0.02) | probably_damaging(0.999) | TCGA-AJ-A5DW-01 | Endometrium | uterine corpus endometrioid carcinoma | Female | <65 | I/II | Unknown | Unknown | SD |
| Page: 1 2 3 4 |
Top |
Related drugs of malignant transformation related genes |
| Identification of chemicals and drugs interact with genes involved in malignant transfromation |
| (DGIdb 4.0) |
| Entrez ID | Symbol | Category | Interaction Types | Drug Claim Name | Drug Name | PMIDs |
| Page: 1 |

Copyright 2023-Present -The University of Texas Health Science Center at Houston |