
|
|||||
|
 | |
| |
| |
| |
| |
| |
|
Gene: STARD3NL |
Gene summary for STARD3NL |
| Gene information | Species | Human | Gene symbol | STARD3NL | Gene ID | 83930 |
| Gene name | STARD3 N-terminal like | |
| Gene Alias | MENTHO | |
| Cytomap | 7p14.1 | |
| Gene Type | protein-coding | GO ID | GO:0006810 | UniProtAcc | A0A024RA89 |
Top |
Malignant transformation analysis |
| Identification of the aberrant gene expression in precancerous and cancerous lesions by comparing the gene expression of stem-like cells in diseased tissues with normal stem cells |
| Entrez ID | Symbol | Replicates | Species | Organ | Tissue | Adj P-value | Log2FC | Malignancy |
| 83930 | STARD3NL | LZE2D | Human | Esophagus | HGIN | 6.06e-03 | 2.97e-01 | 0.0642 |
| 83930 | STARD3NL | LZE4T | Human | Esophagus | ESCC | 2.95e-08 | 2.54e-01 | 0.0811 |
| 83930 | STARD3NL | LZE5T | Human | Esophagus | ESCC | 8.68e-03 | 3.59e-01 | 0.0514 |
| 83930 | STARD3NL | LZE7T | Human | Esophagus | ESCC | 2.11e-04 | 4.54e-01 | 0.0667 |
| 83930 | STARD3NL | LZE8T | Human | Esophagus | ESCC | 3.18e-02 | 1.73e-01 | 0.067 |
| 83930 | STARD3NL | LZE22T | Human | Esophagus | ESCC | 1.03e-05 | 3.84e-01 | 0.068 |
| 83930 | STARD3NL | LZE24T | Human | Esophagus | ESCC | 1.42e-05 | 2.52e-02 | 0.0596 |
| 83930 | STARD3NL | LZE6T | Human | Esophagus | ESCC | 1.52e-03 | 3.96e-01 | 0.0845 |
| 83930 | STARD3NL | P2T-E | Human | Esophagus | ESCC | 2.06e-47 | 7.49e-01 | 0.1177 |
| 83930 | STARD3NL | P4T-E | Human | Esophagus | ESCC | 1.33e-07 | 2.23e-01 | 0.1323 |
| 83930 | STARD3NL | P5T-E | Human | Esophagus | ESCC | 1.38e-15 | 1.68e-01 | 0.1327 |
| 83930 | STARD3NL | P8T-E | Human | Esophagus | ESCC | 1.91e-32 | 6.21e-01 | 0.0889 |
| 83930 | STARD3NL | P9T-E | Human | Esophagus | ESCC | 4.95e-05 | 2.09e-01 | 0.1131 |
| 83930 | STARD3NL | P10T-E | Human | Esophagus | ESCC | 6.07e-41 | 5.63e-01 | 0.116 |
| 83930 | STARD3NL | P11T-E | Human | Esophagus | ESCC | 5.44e-18 | 9.10e-01 | 0.1426 |
| 83930 | STARD3NL | P12T-E | Human | Esophagus | ESCC | 3.73e-05 | 9.10e-03 | 0.1122 |
| 83930 | STARD3NL | P15T-E | Human | Esophagus | ESCC | 3.55e-25 | 5.48e-01 | 0.1149 |
| 83930 | STARD3NL | P16T-E | Human | Esophagus | ESCC | 7.25e-34 | 4.96e-01 | 0.1153 |
| 83930 | STARD3NL | P17T-E | Human | Esophagus | ESCC | 4.76e-05 | 2.77e-01 | 0.1278 |
| 83930 | STARD3NL | P19T-E | Human | Esophagus | ESCC | 1.51e-13 | 1.03e+00 | 0.1662 |
| Page: 1 2 3 4 5 |
| Tissue | Expression Dynamics | Abbreviation |
| Esophagus | 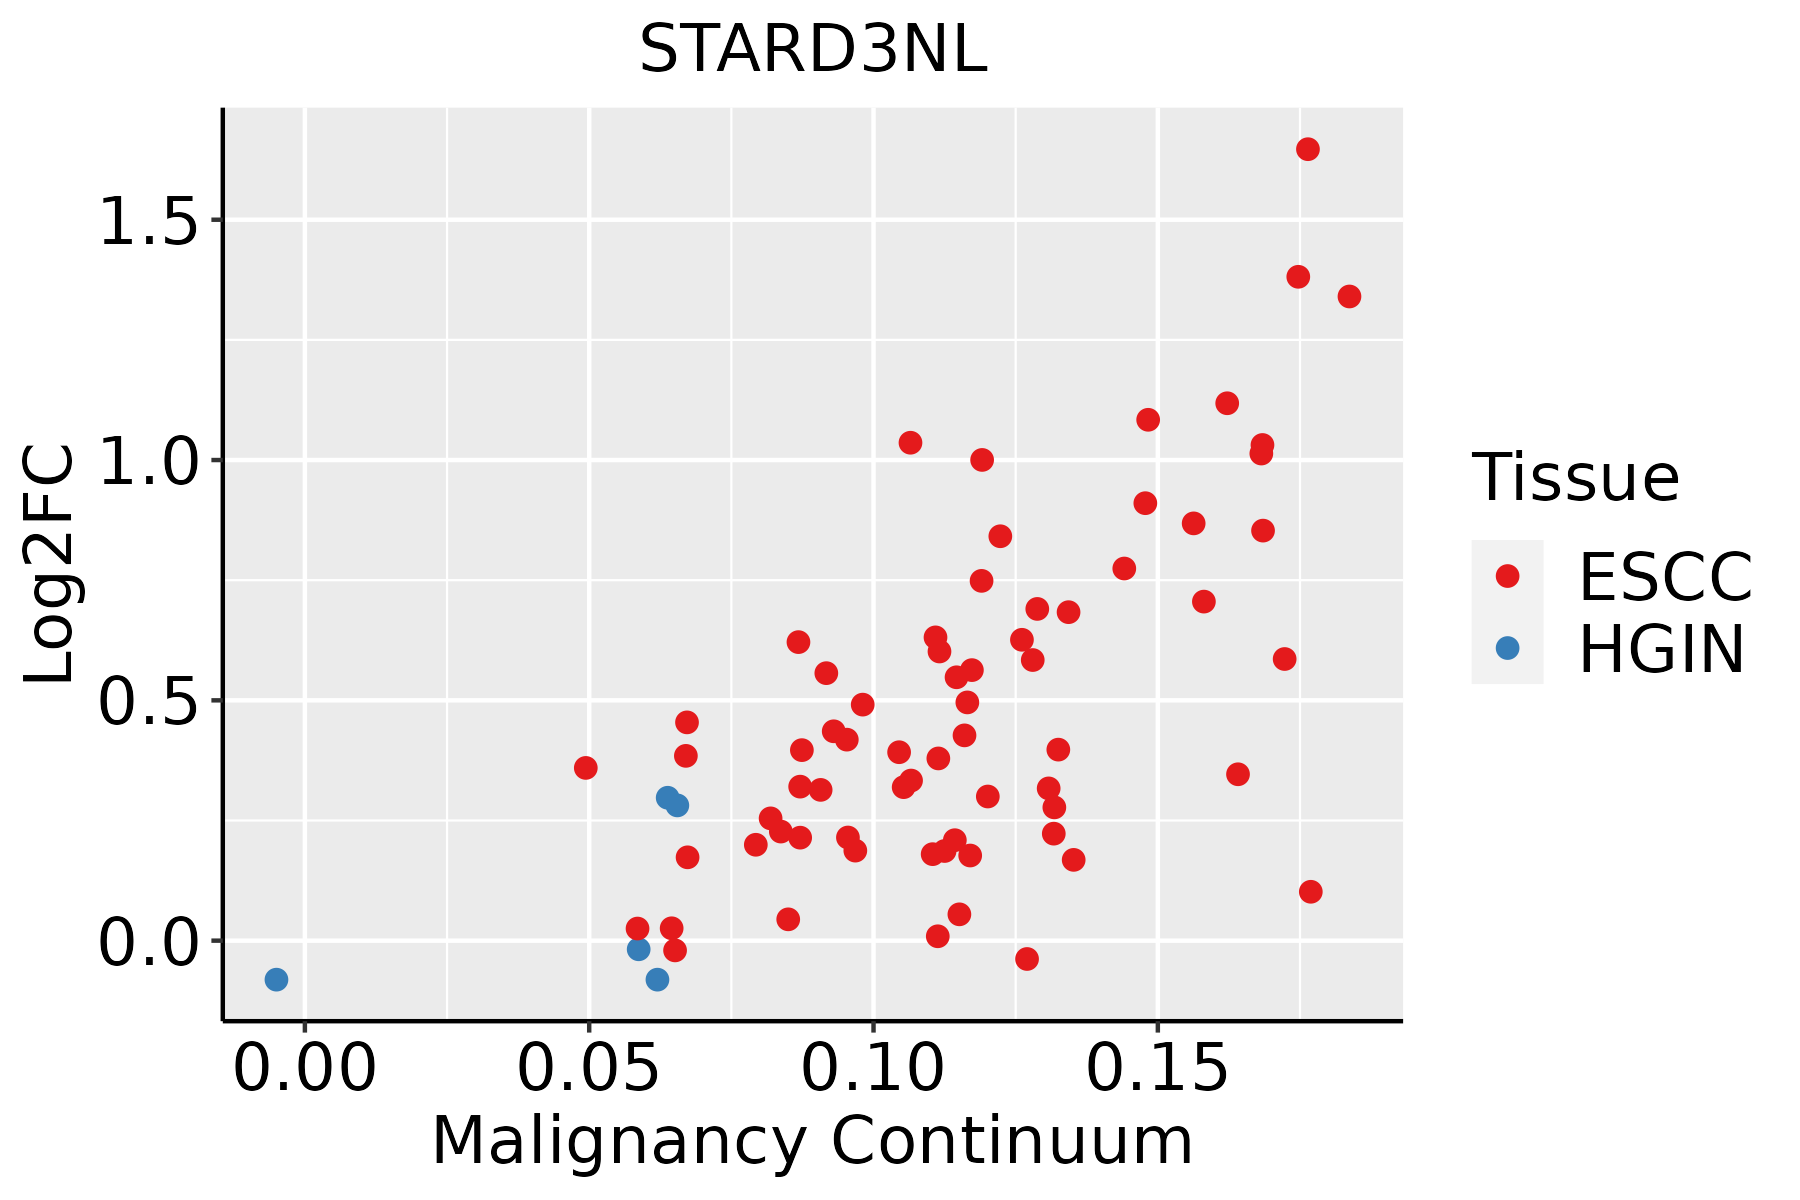 | ESCC: Esophageal squamous cell carcinoma |
| HGIN: High-grade intraepithelial neoplasias | ||
| LGIN: Low-grade intraepithelial neoplasias | ||
| Liver |  | HCC: Hepatocellular carcinoma |
| NAFLD: Non-alcoholic fatty liver disease | ||
| Oral Cavity | 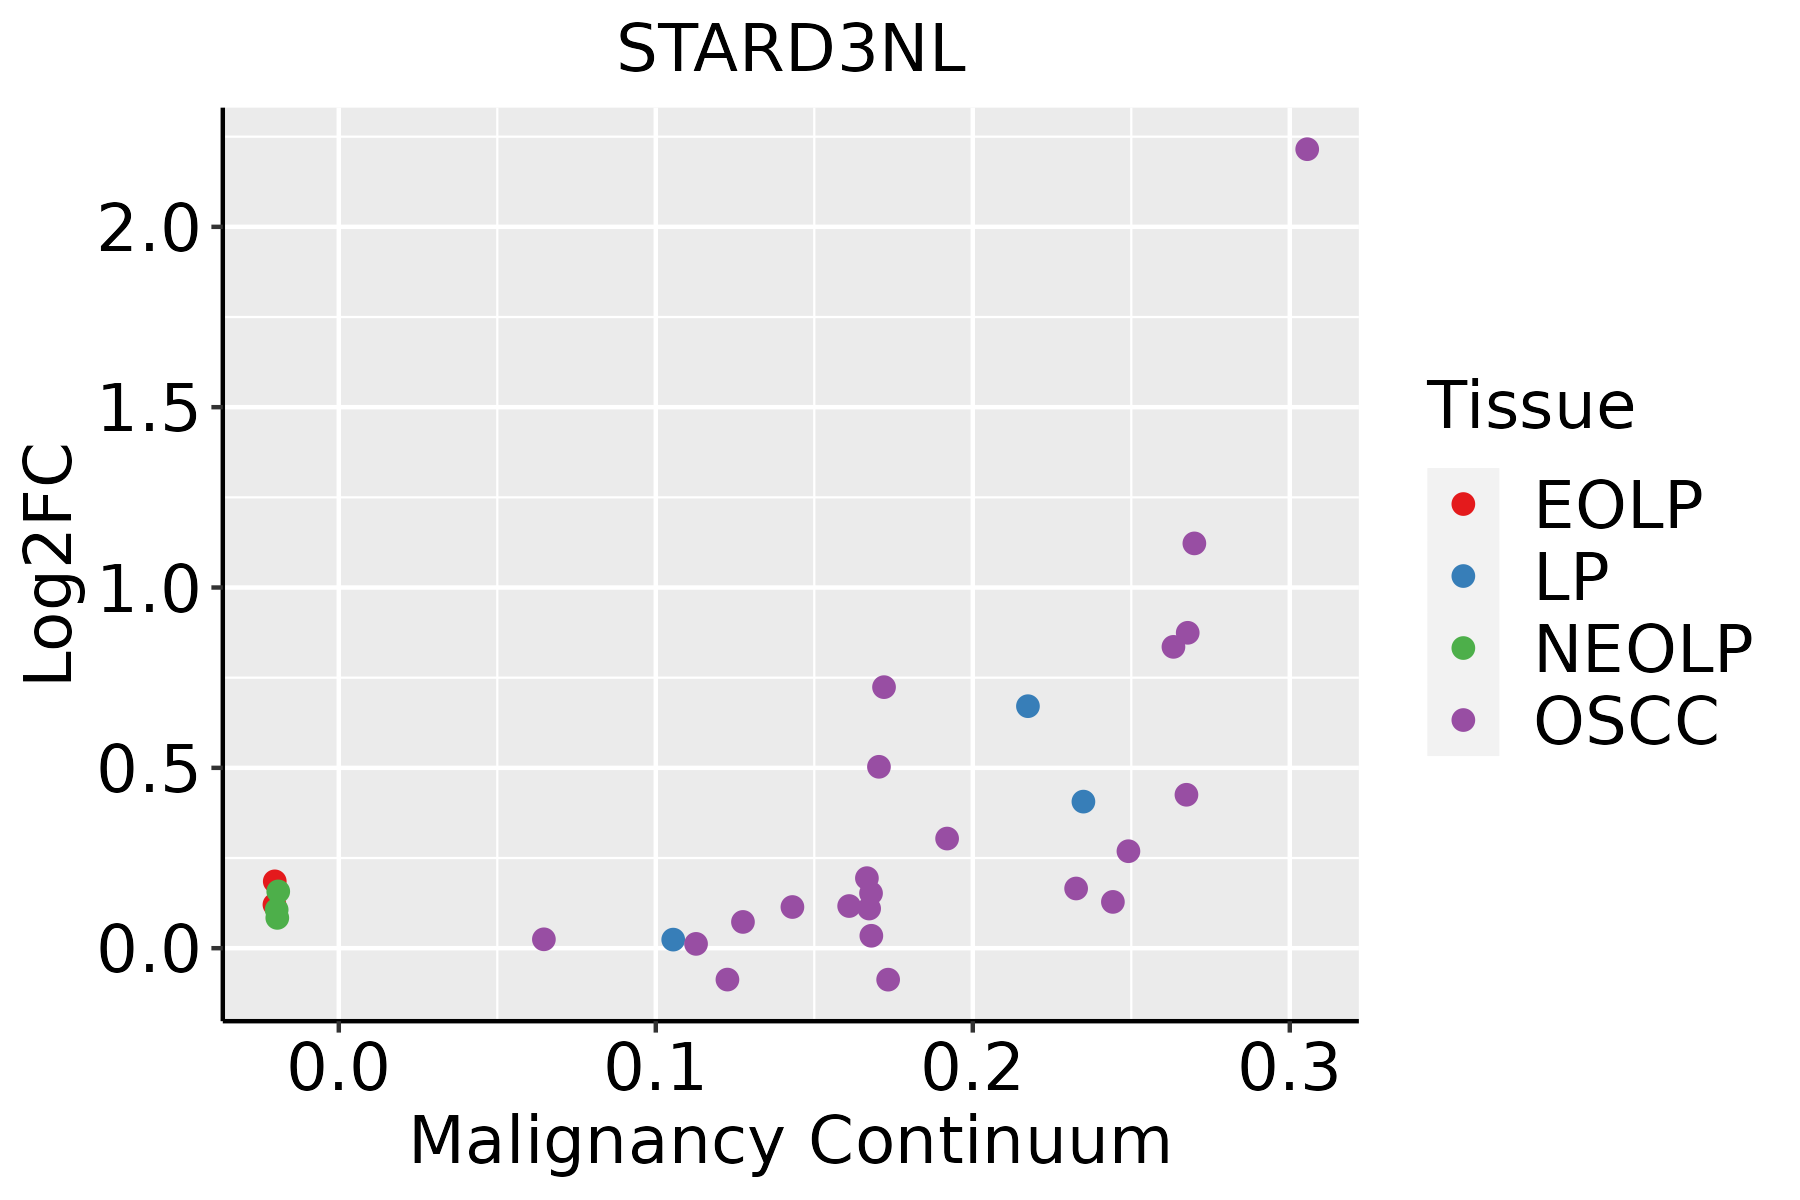 | EOLP: Erosive Oral lichen planus |
| LP: leukoplakia | ||
| NEOLP: Non-erosive oral lichen planus | ||
| OSCC: Oral squamous cell carcinoma | ||
| Prostate | 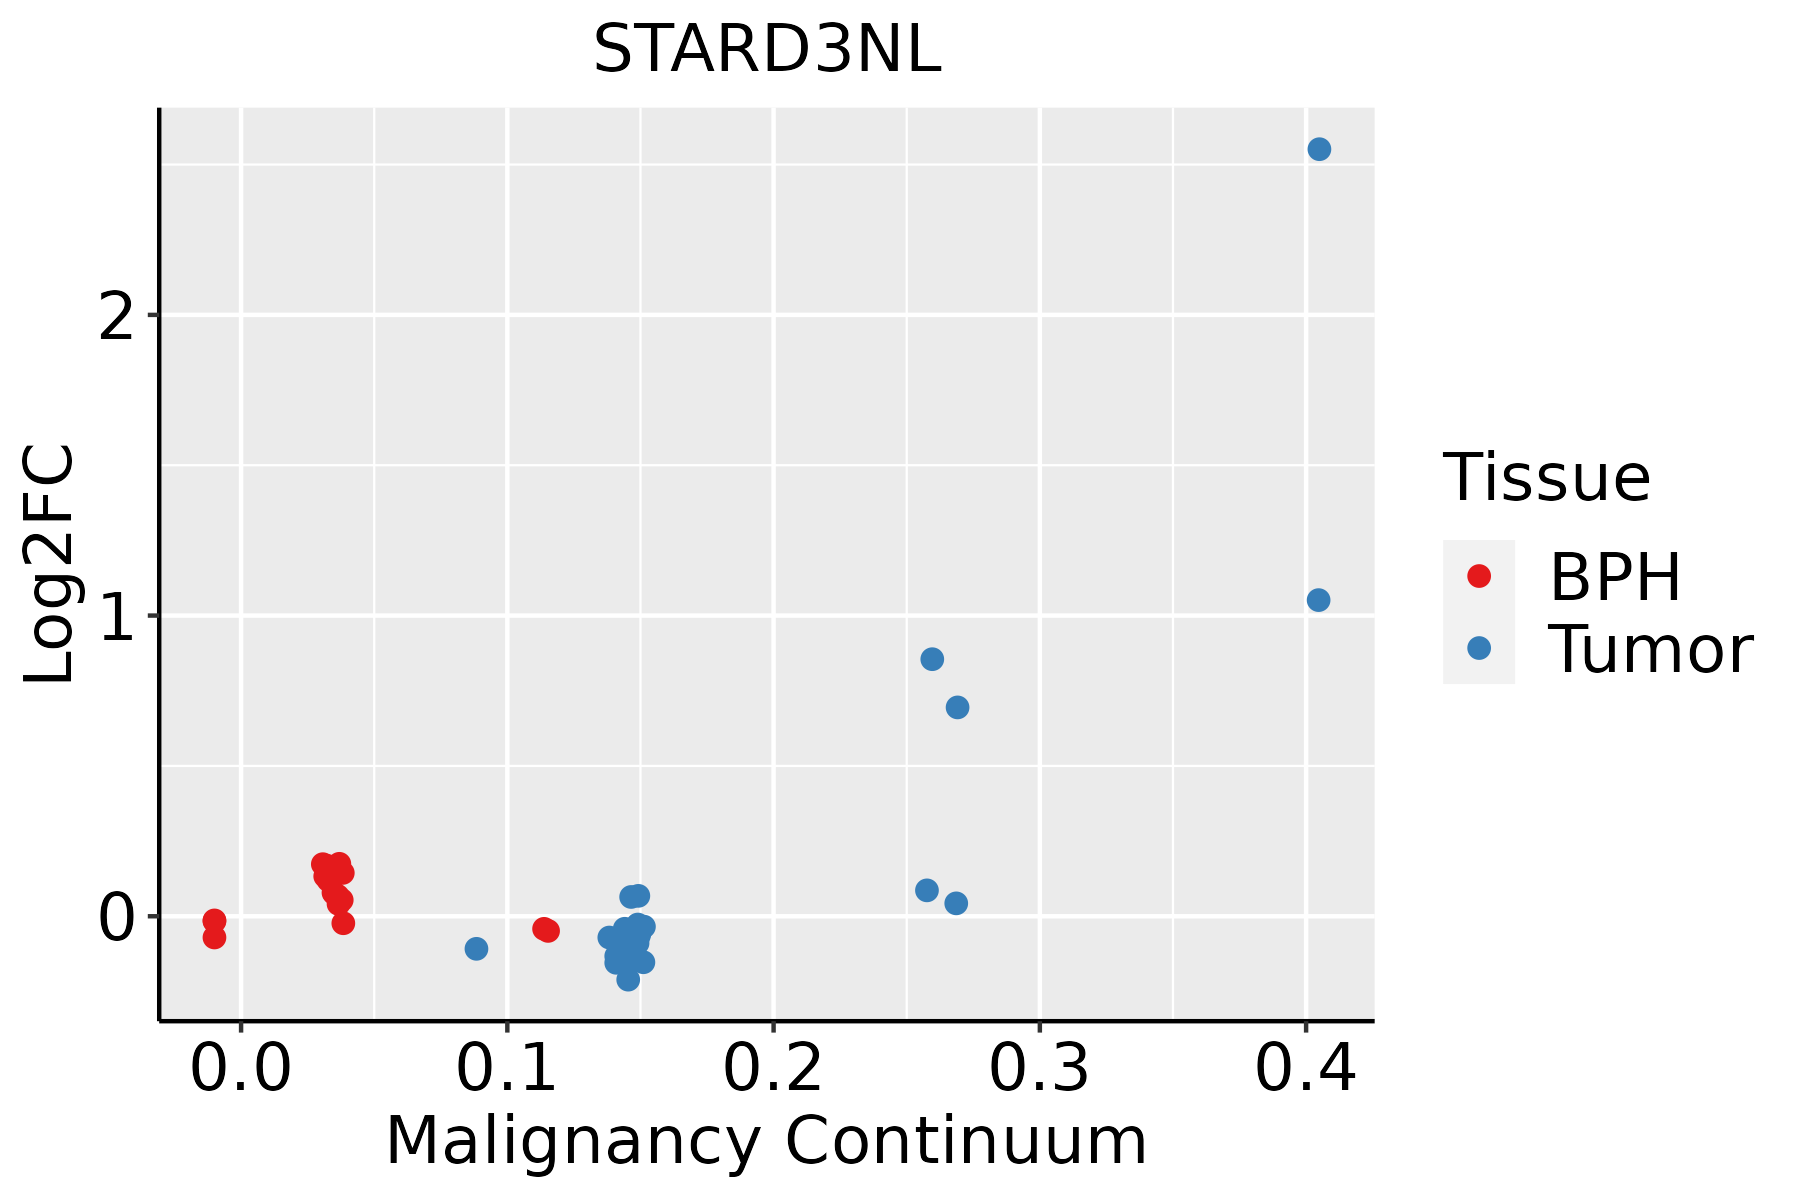 | BPH: Benign Prostatic Hyperplasia |
| Thyroid |  | ATC: Anaplastic thyroid cancer |
| HT: Hashimoto's thyroiditis | ||
| PTC: Papillary thyroid cancer |
| ∗log2FC in expression of this searched gene in stem-like cells from each diseased tissue sample relative to stem-like cells in normal samples in each tissue plotted against the malignancy continuum. Samples are colored based on if they are from different disease stage. |
Top |
Malignant transformation related pathway analysis |
| Find out the enriched GO biological processes and KEGG pathways involved in transition from healthy to precancer to cancer |
| Tissue | Disease Stage | Enriched GO biological Processes |
| Colorectum | AD |  |
| Colorectum | SER |  |
| Colorectum | MSS |  |
| Colorectum | MSI-H |  |
| Colorectum | FAP |  |
| ∗Top 15 enriched GO BP terms are showed in the bar plot of each disease state in each tissue. Each row represents a significant GO biological process which is colored according to the -log10(p.adjust). |
| Page: 1 2 3 4 5 6 7 8 9 |
| GO ID | Tissue | Disease Stage | Description | Gene Ratio | Bg Ratio | pvalue | p.adjust | Count |
| GO:005165616 | Esophagus | HGIN | establishment of organelle localization | 90/2587 | 390/18723 | 4.27e-07 | 1.94e-05 | 90 |
| GO:005165010 | Esophagus | HGIN | establishment of vesicle localization | 35/2587 | 161/18723 | 3.89e-03 | 3.54e-02 | 35 |
| GO:005164810 | Esophagus | HGIN | vesicle localization | 37/2587 | 177/18723 | 6.03e-03 | 4.87e-02 | 37 |
| GO:005165617 | Esophagus | ESCC | establishment of organelle localization | 273/8552 | 390/18723 | 9.13e-23 | 1.81e-20 | 273 |
| GO:005165016 | Esophagus | ESCC | establishment of vesicle localization | 114/8552 | 161/18723 | 8.20e-11 | 2.53e-09 | 114 |
| GO:005164815 | Esophagus | ESCC | vesicle localization | 119/8552 | 177/18723 | 5.16e-09 | 1.08e-07 | 119 |
| GO:00069038 | Esophagus | ESCC | vesicle targeting | 38/8552 | 45/18723 | 8.42e-08 | 1.43e-06 | 38 |
| GO:00990222 | Esophagus | ESCC | vesicle tethering | 10/8552 | 11/18723 | 2.54e-03 | 1.08e-02 | 10 |
| GO:005165621 | Liver | HCC | establishment of organelle localization | 226/7958 | 390/18723 | 4.15e-10 | 1.34e-08 | 226 |
| GO:005165021 | Liver | HCC | establishment of vesicle localization | 103/7958 | 161/18723 | 2.94e-08 | 6.69e-07 | 103 |
| GO:005164821 | Liver | HCC | vesicle localization | 107/7958 | 177/18723 | 1.05e-06 | 1.57e-05 | 107 |
| GO:000690311 | Liver | HCC | vesicle targeting | 34/7958 | 45/18723 | 6.75e-06 | 8.08e-05 | 34 |
| GO:005165610 | Oral cavity | OSCC | establishment of organelle localization | 239/7305 | 390/18723 | 2.46e-19 | 3.31e-17 | 239 |
| GO:00069037 | Oral cavity | OSCC | vesicle targeting | 38/7305 | 45/18723 | 4.49e-10 | 1.19e-08 | 38 |
| GO:00516509 | Oral cavity | OSCC | establishment of vesicle localization | 101/7305 | 161/18723 | 8.79e-10 | 2.17e-08 | 101 |
| GO:00516489 | Oral cavity | OSCC | vesicle localization | 105/7305 | 177/18723 | 3.30e-08 | 6.30e-07 | 105 |
| GO:0099022 | Oral cavity | OSCC | vesicle tethering | 10/7305 | 11/18723 | 5.78e-04 | 3.30e-03 | 10 |
| GO:005165623 | Oral cavity | EOLP | establishment of organelle localization | 73/2218 | 390/18723 | 4.59e-05 | 6.11e-04 | 73 |
| GO:005165022 | Oral cavity | EOLP | establishment of vesicle localization | 35/2218 | 161/18723 | 2.54e-04 | 2.47e-03 | 35 |
| GO:005164822 | Oral cavity | EOLP | vesicle localization | 37/2218 | 177/18723 | 3.88e-04 | 3.48e-03 | 37 |
| Page: 1 2 |
| Pathway ID | Tissue | Disease Stage | Description | Gene Ratio | Bg Ratio | pvalue | p.adjust | qvalue | Count |
| Page: 1 |
Top |
Cell-cell communication analysis |
| Identification of potential cell-cell interactions between two cell types and their ligand-receptor pairs for different disease states |
| Ligand | Receptor | LRpair | Pathway | Tissue | Disease Stage |
| Page: 1 |
Top |
Single-cell gene regulatory network inference analysis |
| Find out the significant the regulons (TFs) and the target genes of each regulon across cell types for different disease states |
| TF | Cell Type | Tissue | Disease Stage | Target Gene | RSS | Regulon Activity |
| ∗The dot plots of a searched regulon are shown for all cell subpopulations in each disease state of each tissue based on the regulon specific score inferred using pySCENIC and by calculating the average expression. |
| Page: 1 |
Top |
Somatic mutation of malignant transformation related genes |
| Annotation of somatic variants for genes involved in malignant transformation |
| Hugo Symbol | Variant Class | Variant Classification | dbSNP RS | HGVSc | HGVSp | HGVSp Short | SWISSPROT | BIOTYPE | SIFT | PolyPhen | Tumor Sample Barcode | Tissue | Histology | Sex | Age | Stage | Therapy Types | Drugs | Outcome |
| STARD3NL | SNV | Missense_Mutation | c.44G>C | p.Ser15Thr | p.S15T | O95772 | protein_coding | tolerated(0.28) | possibly_damaging(0.906) | TCGA-A8-A08L-01 | Breast | breast invasive carcinoma | Female | >=65 | III/IV | Unknown | Unknown | SD | |
| STARD3NL | SNV | Missense_Mutation | novel | c.637N>A | p.Glu213Lys | p.E213K | O95772 | protein_coding | deleterious(0) | probably_damaging(0.989) | TCGA-VS-A953-01 | Cervix | cervical & endocervical cancer | Female | <65 | I/II | Unknown | Unknown | PD |
| STARD3NL | SNV | Missense_Mutation | c.336N>G | p.Ile112Met | p.I112M | O95772 | protein_coding | deleterious(0.03) | probably_damaging(0.958) | TCGA-AA-A010-01 | Colorectum | colon adenocarcinoma | Female | <65 | I/II | Chemotherapy | folinic | CR | |
| STARD3NL | SNV | Missense_Mutation | rs767198270 | c.296A>G | p.Asp99Gly | p.D99G | O95772 | protein_coding | deleterious(0) | probably_damaging(1) | TCGA-AA-A01R-01 | Colorectum | colon adenocarcinoma | Male | <65 | III/IV | Chemotherapy | 5-fluorouracil | PD |
| STARD3NL | SNV | Missense_Mutation | c.296N>T | p.Asp99Val | p.D99V | O95772 | protein_coding | deleterious(0) | probably_damaging(1) | TCGA-B5-A0K6-01 | Endometrium | uterine corpus endometrioid carcinoma | Female | <65 | I/II | Unknown | Unknown | SD | |
| STARD3NL | SNV | Missense_Mutation | c.52N>C | p.Ser18Pro | p.S18P | O95772 | protein_coding | tolerated(0.09) | benign(0.021) | TCGA-B5-A11G-01 | Endometrium | uterine corpus endometrioid carcinoma | Female | >=65 | I/II | Unknown | Unknown | SD | |
| STARD3NL | SNV | Missense_Mutation | novel | c.101T>C | p.Met34Thr | p.M34T | O95772 | protein_coding | tolerated(0.39) | benign(0.015) | TCGA-B5-A3FC-01 | Endometrium | uterine corpus endometrioid carcinoma | Female | <65 | I/II | Unknown | Unknown | SD |
| STARD3NL | SNV | Missense_Mutation | rs141608996 | c.643N>A | p.Glu215Lys | p.E215K | O95772 | protein_coding | tolerated(0.07) | benign(0.071) | TCGA-EO-A22R-01 | Endometrium | uterine corpus endometrioid carcinoma | Female | <65 | I/II | Unknown | Unknown | SD |
| STARD3NL | SNV | Missense_Mutation | c.235N>A | p.Gly79Ser | p.G79S | O95772 | protein_coding | tolerated(0.17) | possibly_damaging(0.714) | TCGA-EO-A22U-01 | Endometrium | uterine corpus endometrioid carcinoma | Female | >=65 | I/II | Unknown | Unknown | SD | |
| STARD3NL | SNV | Missense_Mutation | rs760254369 | c.320N>A | p.Arg107Gln | p.R107Q | O95772 | protein_coding | deleterious(0) | probably_damaging(1) | TCGA-EO-A3B0-01 | Endometrium | uterine corpus endometrioid carcinoma | Female | <65 | III/IV | Unknown | Unknown | SD |
| Page: 1 2 3 |
Top |
Related drugs of malignant transformation related genes |
| Identification of chemicals and drugs interact with genes involved in malignant transfromation |
| (DGIdb 4.0) |
| Entrez ID | Symbol | Category | Interaction Types | Drug Claim Name | Drug Name | PMIDs |
| Page: 1 |

Copyright 2023-Present -The University of Texas Health Science Center at Houston |