
|
|||||
|
 | |
| |
| |
| |
| |
| |
|
Gene: STARD10 |
Gene summary for STARD10 |
| Gene information | Species | Human | Gene symbol | STARD10 | Gene ID | 10809 |
| Gene name | StAR related lipid transfer domain containing 10 | |
| Gene Alias | CGI-52 | |
| Cytomap | 11q13.4 | |
| Gene Type | protein-coding | GO ID | GO:0006810 | UniProtAcc | A0A024R5L8 |
Top |
Malignant transformation analysis |
| Identification of the aberrant gene expression in precancerous and cancerous lesions by comparing the gene expression of stem-like cells in diseased tissues with normal stem cells |
| Entrez ID | Symbol | Replicates | Species | Organ | Tissue | Adj P-value | Log2FC | Malignancy |
| 10809 | STARD10 | GSM4909285 | Human | Breast | IDC | 1.04e-07 | -2.86e-01 | 0.21 |
| 10809 | STARD10 | GSM4909290 | Human | Breast | IDC | 2.14e-19 | 6.43e-01 | 0.2096 |
| 10809 | STARD10 | GSM4909291 | Human | Breast | IDC | 1.52e-07 | 4.50e-01 | 0.1753 |
| 10809 | STARD10 | GSM4909294 | Human | Breast | IDC | 2.16e-04 | 4.22e-01 | 0.2022 |
| 10809 | STARD10 | GSM4909296 | Human | Breast | IDC | 4.57e-03 | -1.78e-01 | 0.1524 |
| 10809 | STARD10 | GSM4909297 | Human | Breast | IDC | 1.42e-06 | 1.02e-01 | 0.1517 |
| 10809 | STARD10 | GSM4909301 | Human | Breast | IDC | 8.87e-24 | 6.83e-01 | 0.1577 |
| 10809 | STARD10 | GSM4909304 | Human | Breast | IDC | 7.61e-93 | 1.32e+00 | 0.1636 |
| 10809 | STARD10 | GSM4909309 | Human | Breast | IDC | 1.51e-02 | 1.42e-01 | 0.0483 |
| 10809 | STARD10 | GSM4909311 | Human | Breast | IDC | 2.19e-14 | -1.62e-01 | 0.1534 |
| 10809 | STARD10 | GSM4909313 | Human | Breast | IDC | 4.32e-12 | 4.63e-01 | 0.0391 |
| 10809 | STARD10 | GSM4909315 | Human | Breast | IDC | 3.93e-12 | 5.55e-01 | 0.21 |
| 10809 | STARD10 | GSM4909316 | Human | Breast | IDC | 3.37e-19 | 7.85e-01 | 0.21 |
| 10809 | STARD10 | GSM4909317 | Human | Breast | IDC | 7.24e-28 | 7.22e-01 | 0.1355 |
| 10809 | STARD10 | GSM4909318 | Human | Breast | IDC | 5.88e-25 | 1.10e+00 | 0.2031 |
| 10809 | STARD10 | GSM4909319 | Human | Breast | IDC | 1.49e-36 | 4.42e-01 | 0.1563 |
| 10809 | STARD10 | GSM4909320 | Human | Breast | IDC | 7.75e-18 | 5.49e-01 | 0.1575 |
| 10809 | STARD10 | GSM4909321 | Human | Breast | IDC | 4.67e-30 | 7.49e-01 | 0.1559 |
| 10809 | STARD10 | M1 | Human | Breast | IDC | 2.15e-27 | 7.95e-01 | 0.1577 |
| 10809 | STARD10 | NCCBC11 | Human | Breast | DCIS | 3.37e-14 | 6.06e-01 | 0.1232 |
| Page: 1 2 3 4 5 6 7 8 9 10 11 |
| Tissue | Expression Dynamics | Abbreviation |
| Breast | 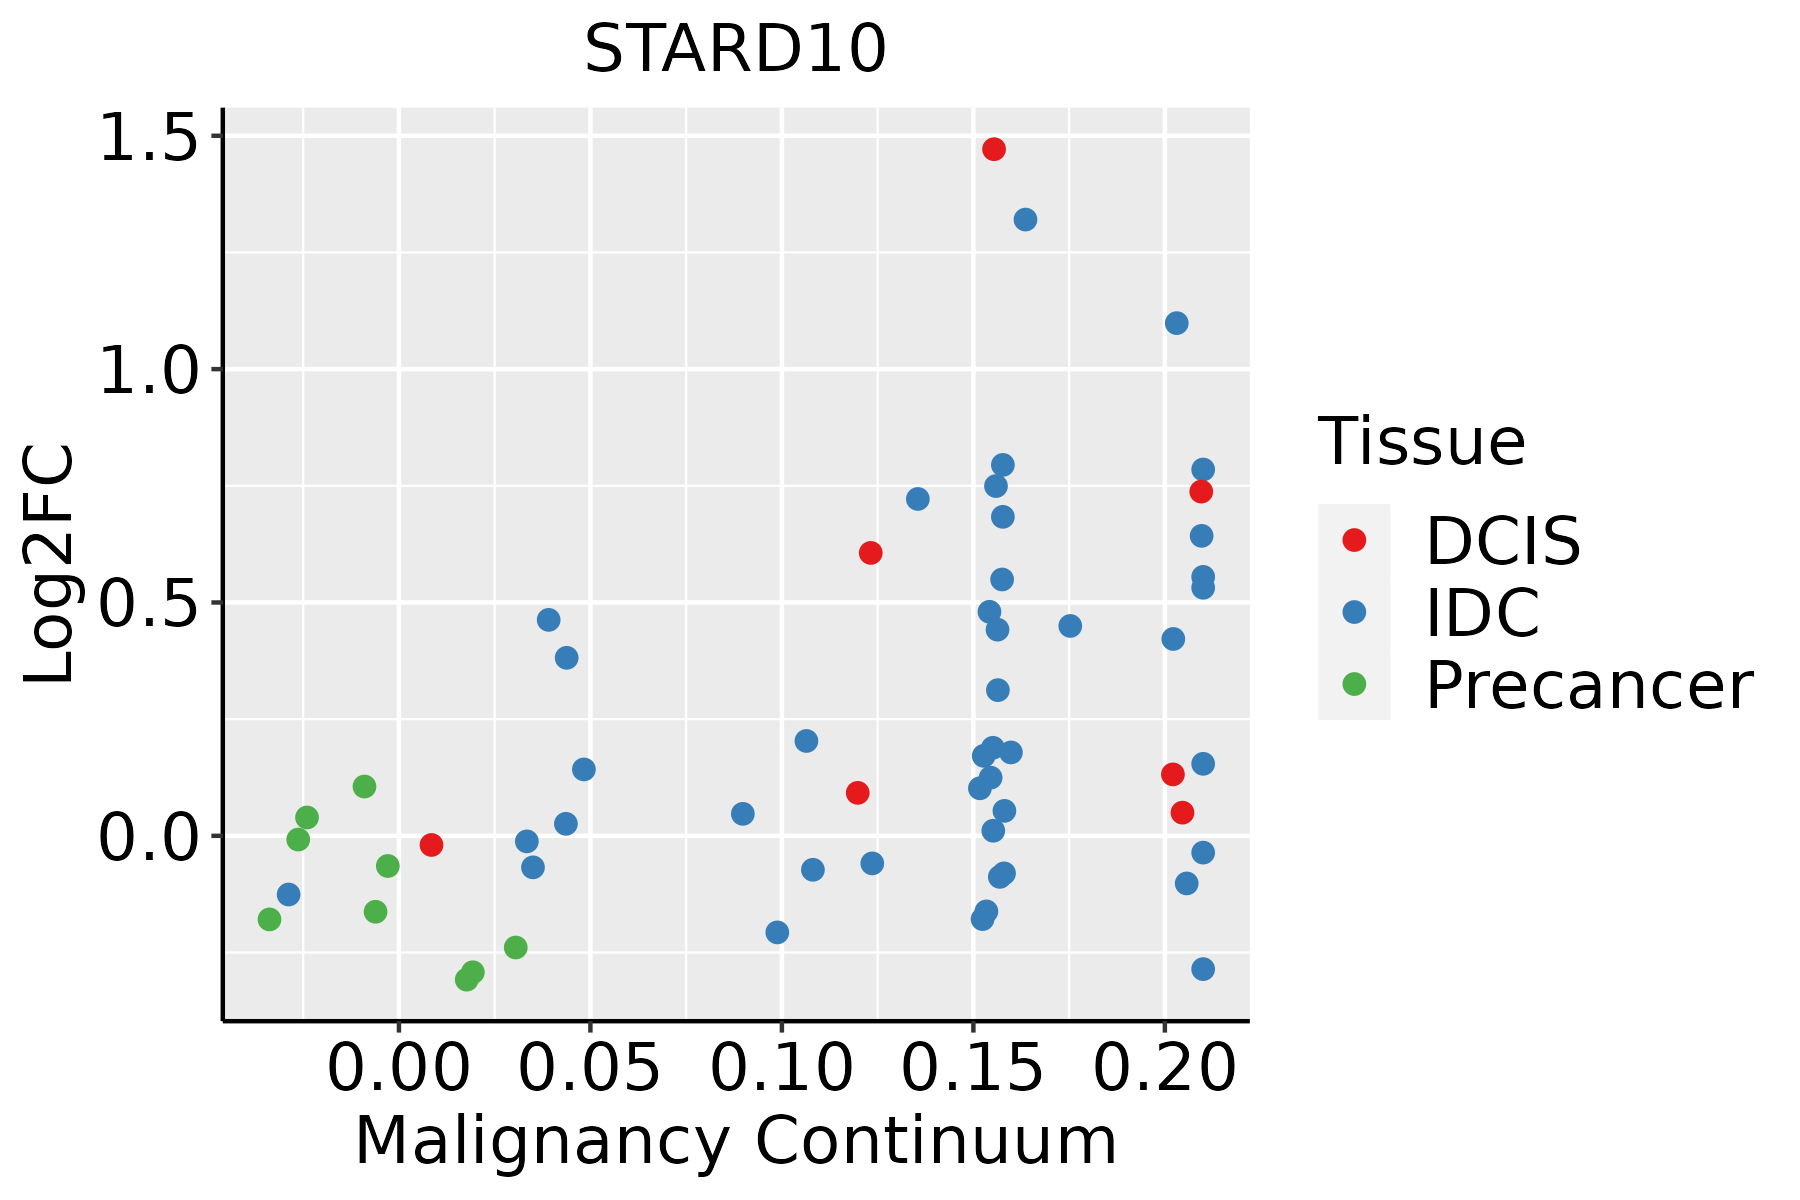 | IDC: Invasive ductal carcinoma |
| DCIS: Ductal carcinoma in situ | ||
| Precancer(BRCA1-mut): Precancerous lesion from BRCA1 mutation carriers | ||
| Colorectum (GSE201348) |  | FAP: Familial adenomatous polyposis |
| CRC: Colorectal cancer | ||
| Colorectum (HTA11) |  | AD: Adenomas |
| SER: Sessile serrated lesions | ||
| MSI-H: Microsatellite-high colorectal cancer | ||
| MSS: Microsatellite stable colorectal cancer | ||
| Esophagus | 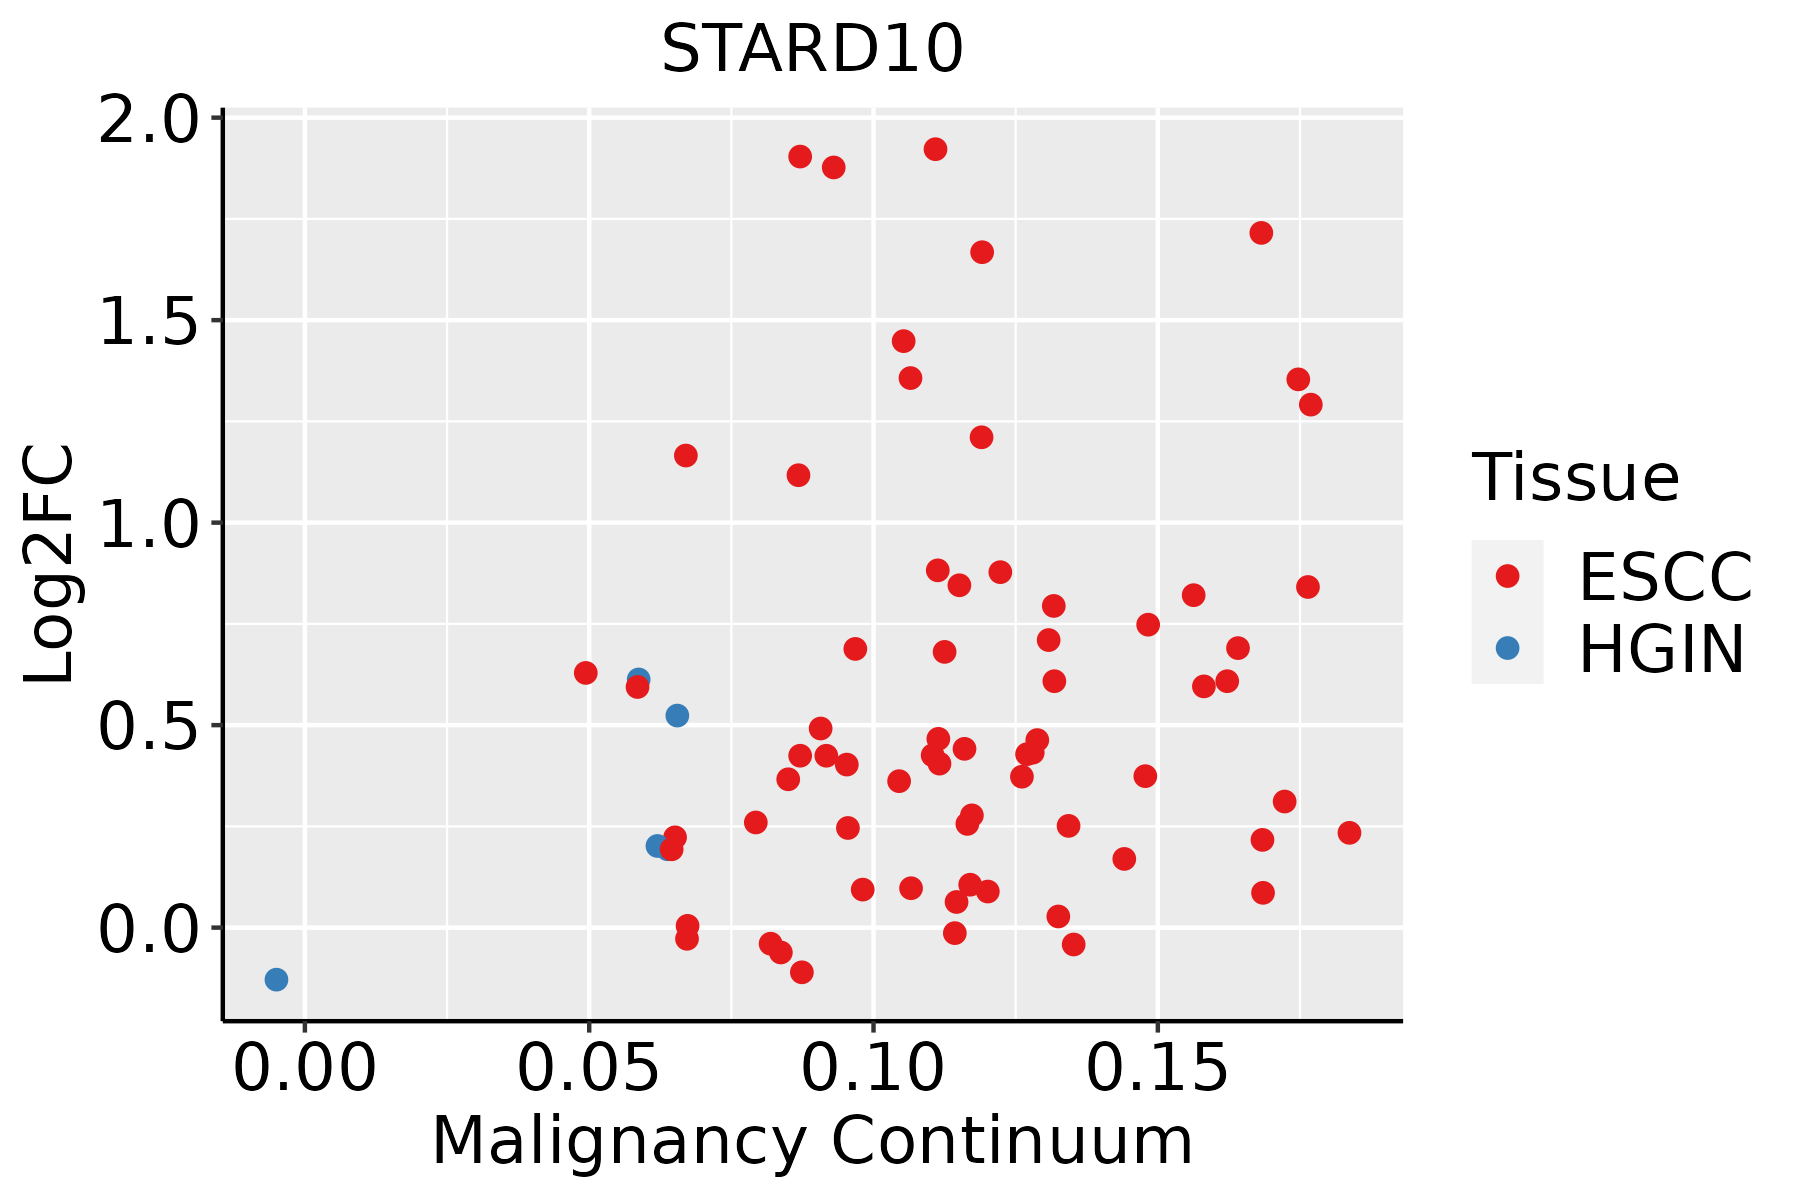 | ESCC: Esophageal squamous cell carcinoma |
| HGIN: High-grade intraepithelial neoplasias | ||
| LGIN: Low-grade intraepithelial neoplasias | ||
| GC | 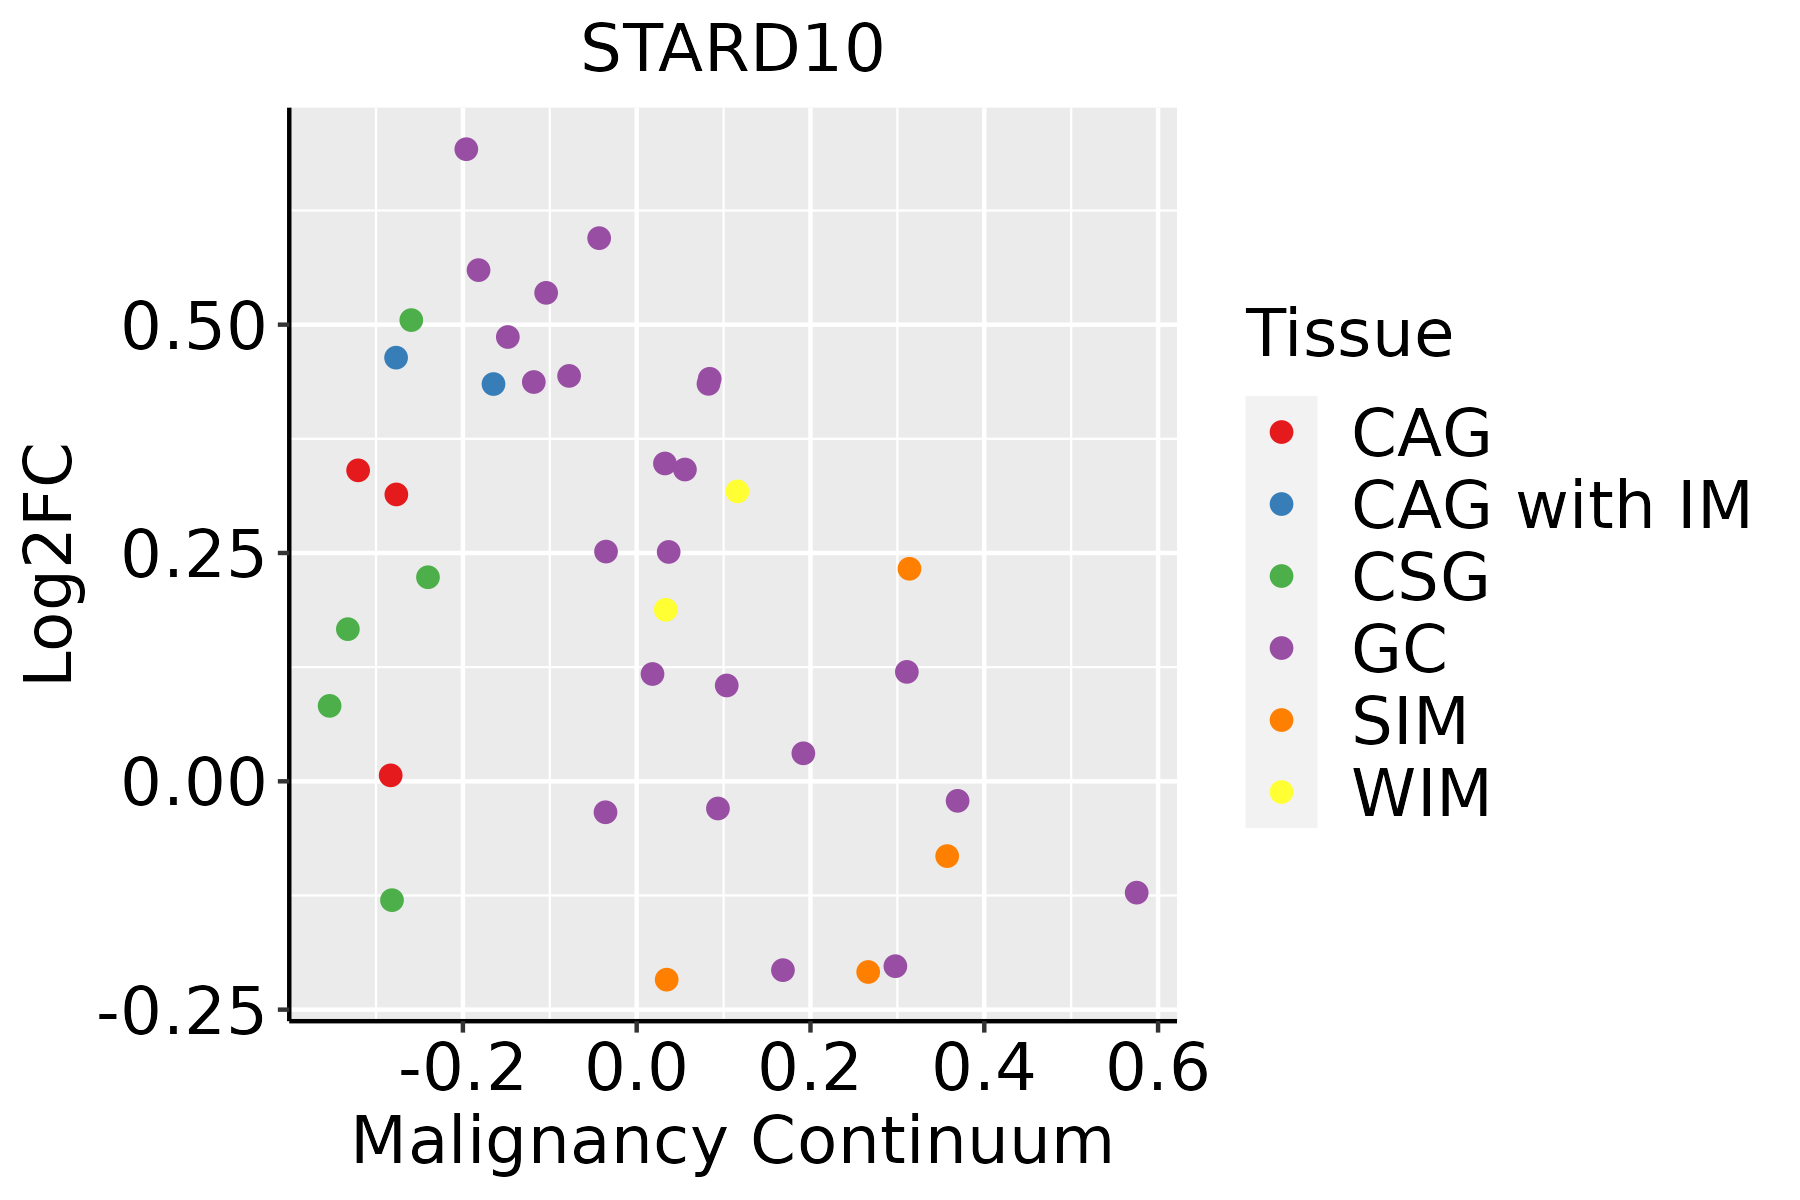 | CAG: Chronic atrophic gastritis |
| CAG with IM: Chronic atrophic gastritis with intestinal metaplasia | ||
| CSG: Chronic superficial gastritis | ||
| GC: Gastric cancer | ||
| SIM: Severe intestinal metaplasia | ||
| WIM: Wild intestinal metaplasia | ||
| Liver | 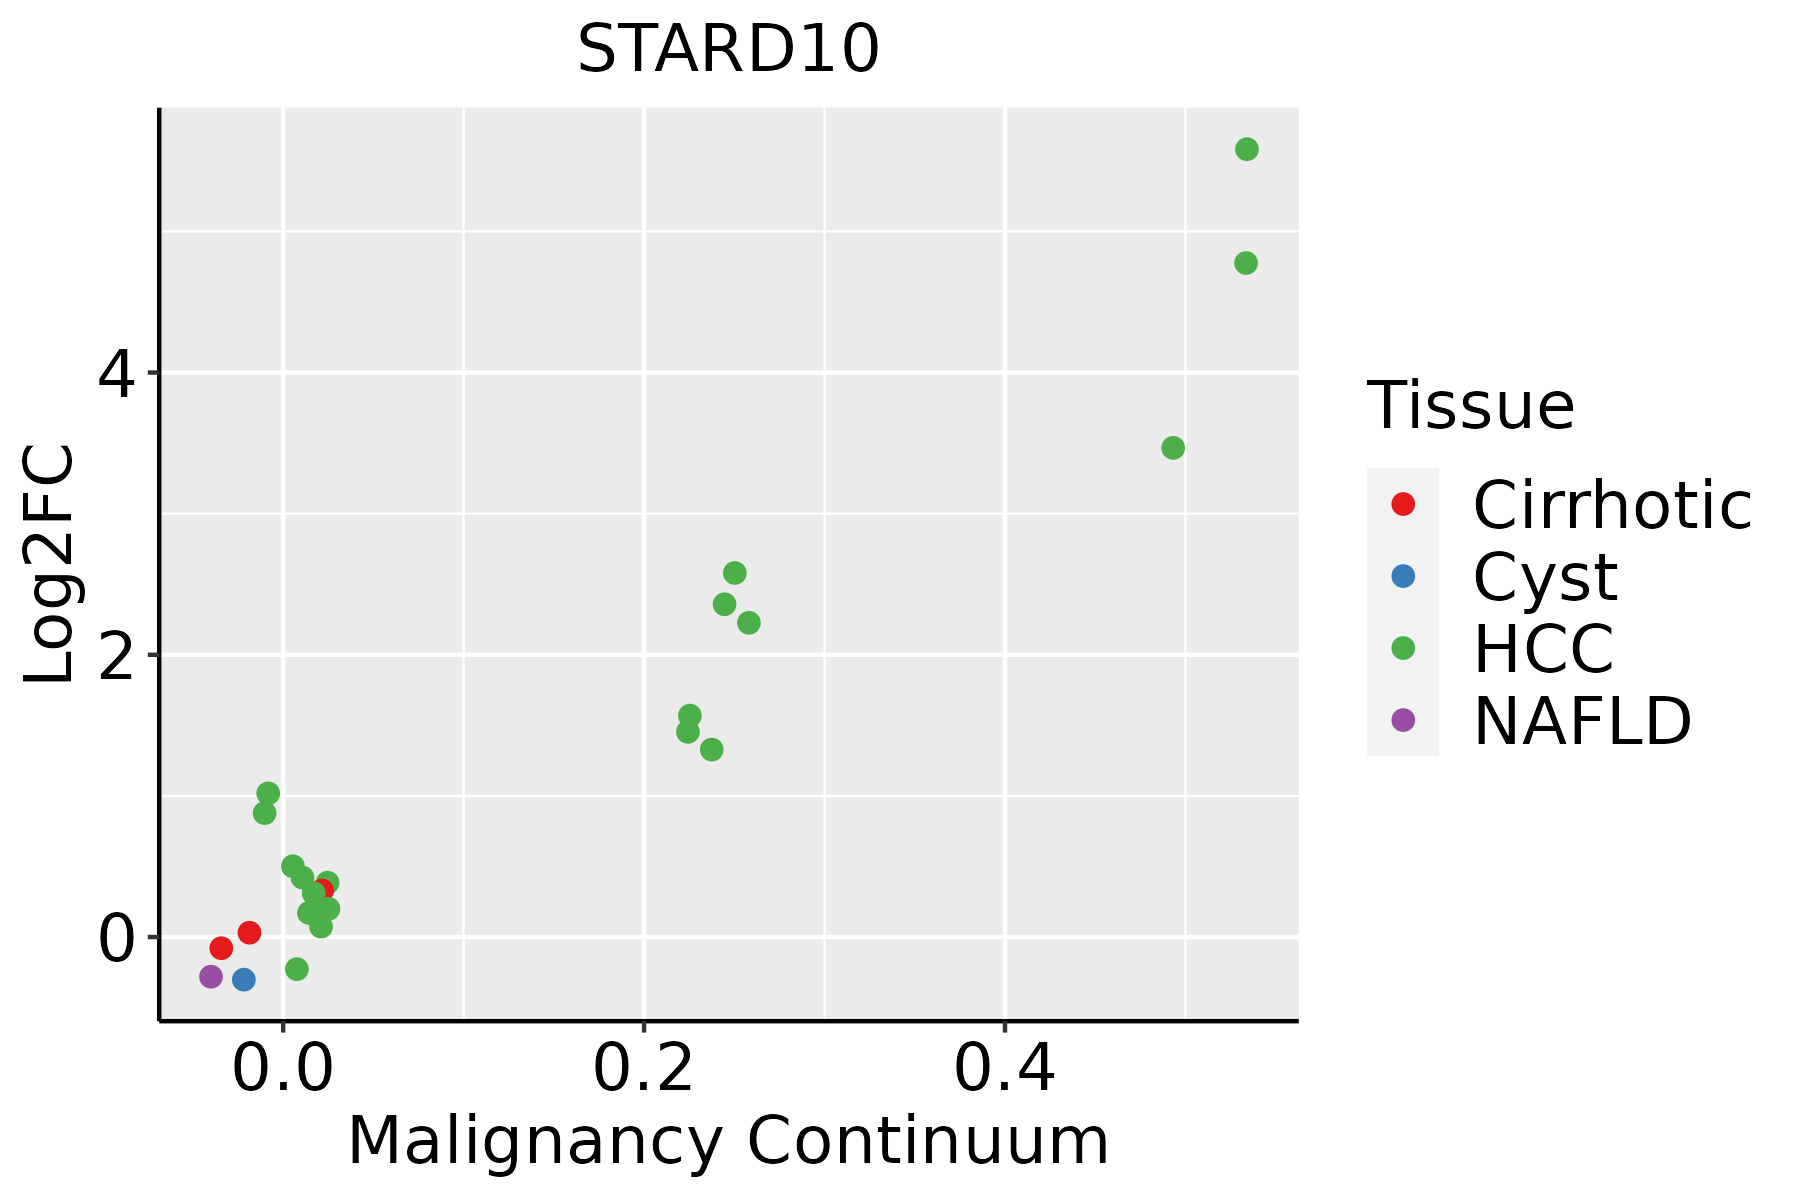 | HCC: Hepatocellular carcinoma |
| NAFLD: Non-alcoholic fatty liver disease | ||
| Oral Cavity | 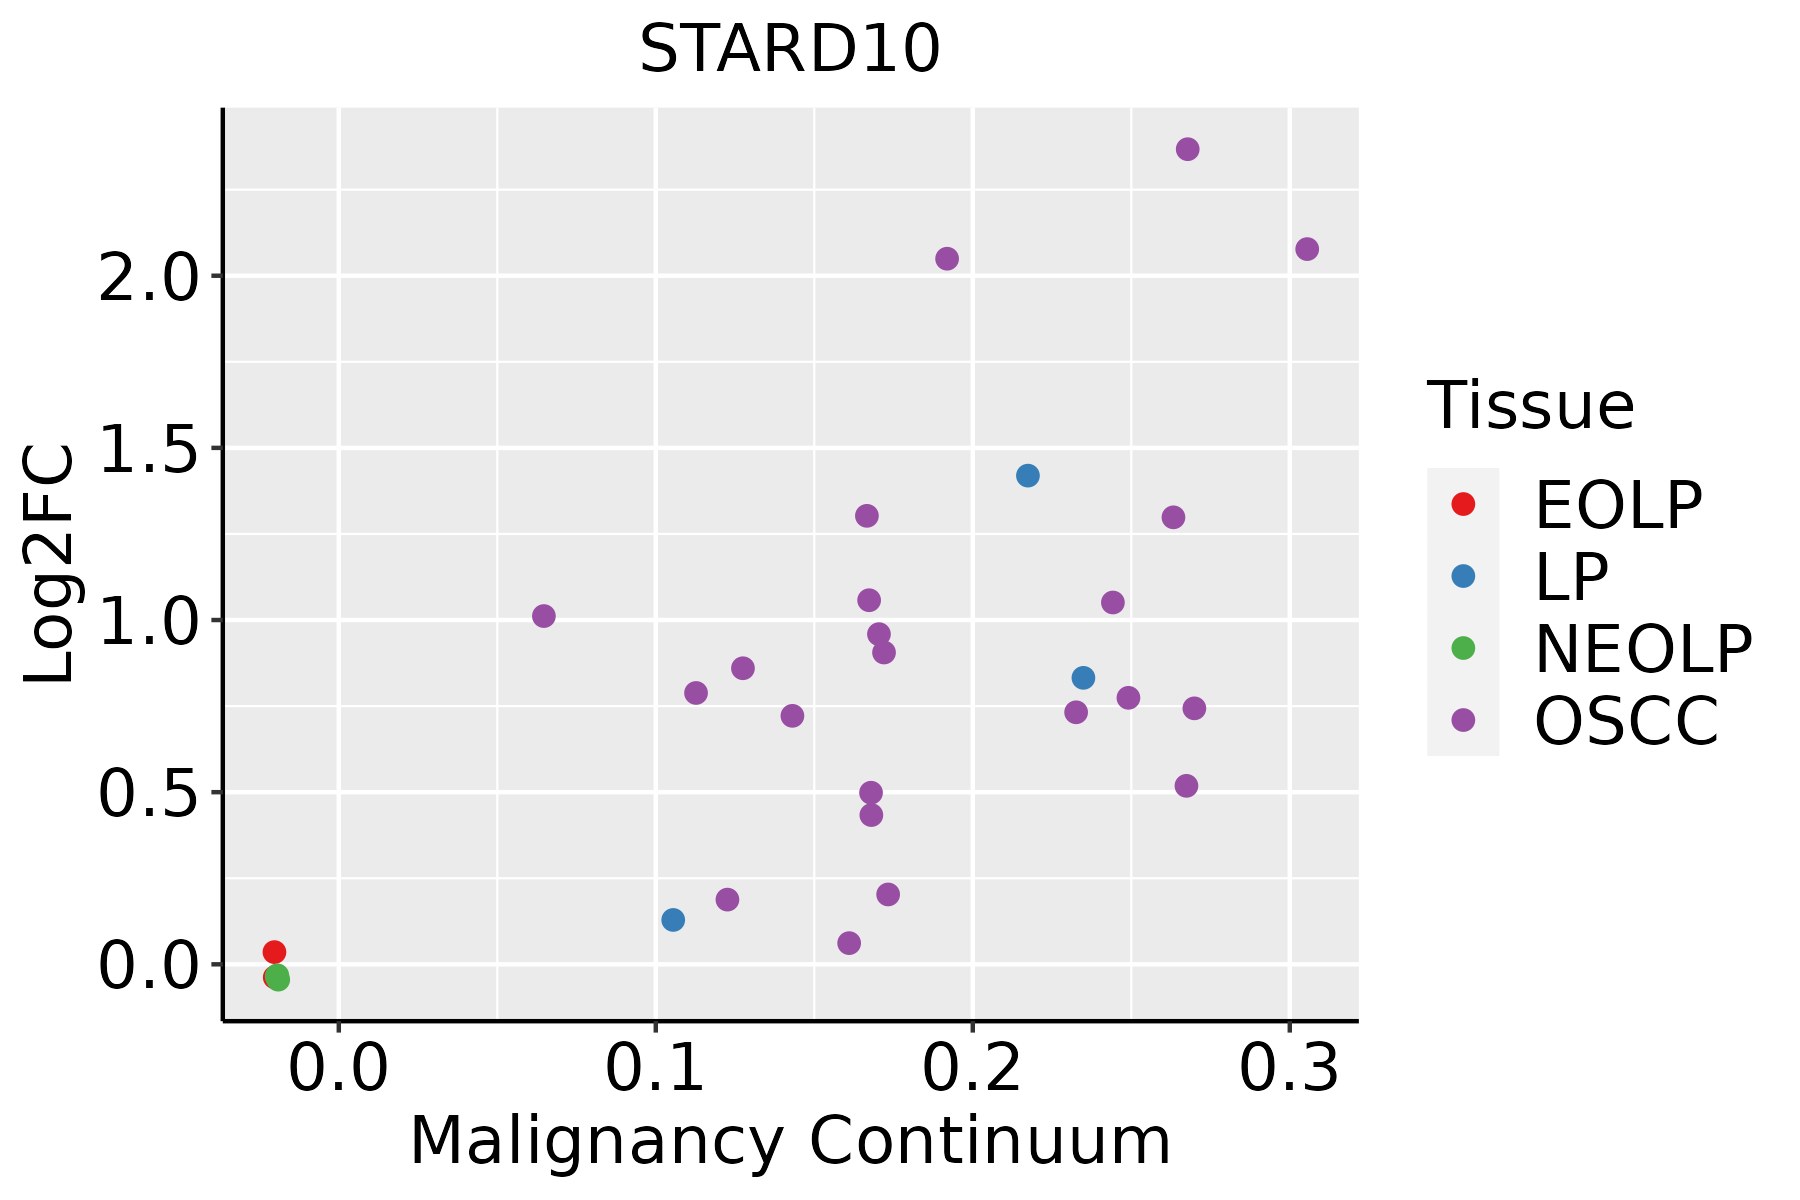 | EOLP: Erosive Oral lichen planus |
| LP: leukoplakia | ||
| NEOLP: Non-erosive oral lichen planus | ||
| OSCC: Oral squamous cell carcinoma | ||
| Prostate |  | BPH: Benign Prostatic Hyperplasia |
| Skin | 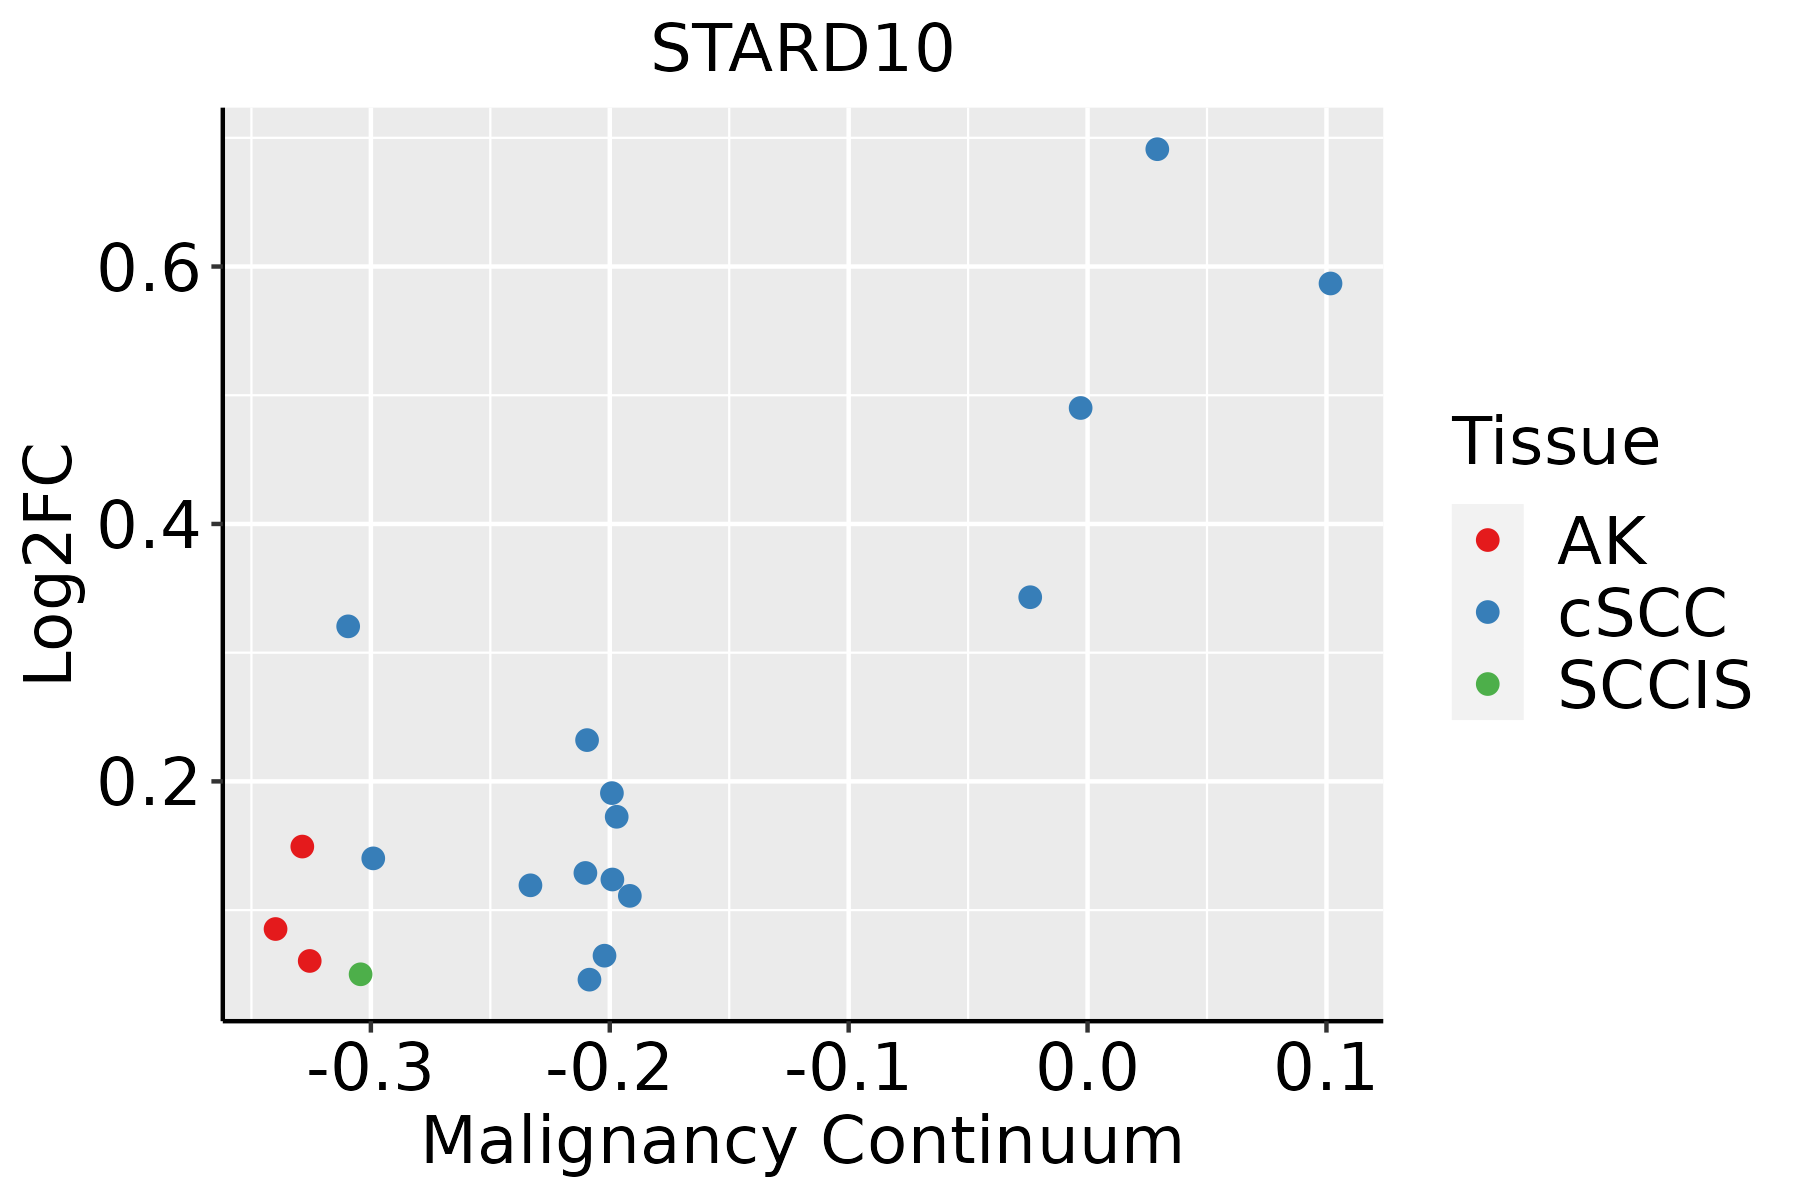 | AK: Actinic keratosis |
| cSCC: Cutaneous squamous cell carcinoma | ||
| SCCIS:squamous cell carcinoma in situ | ||
| Thyroid | 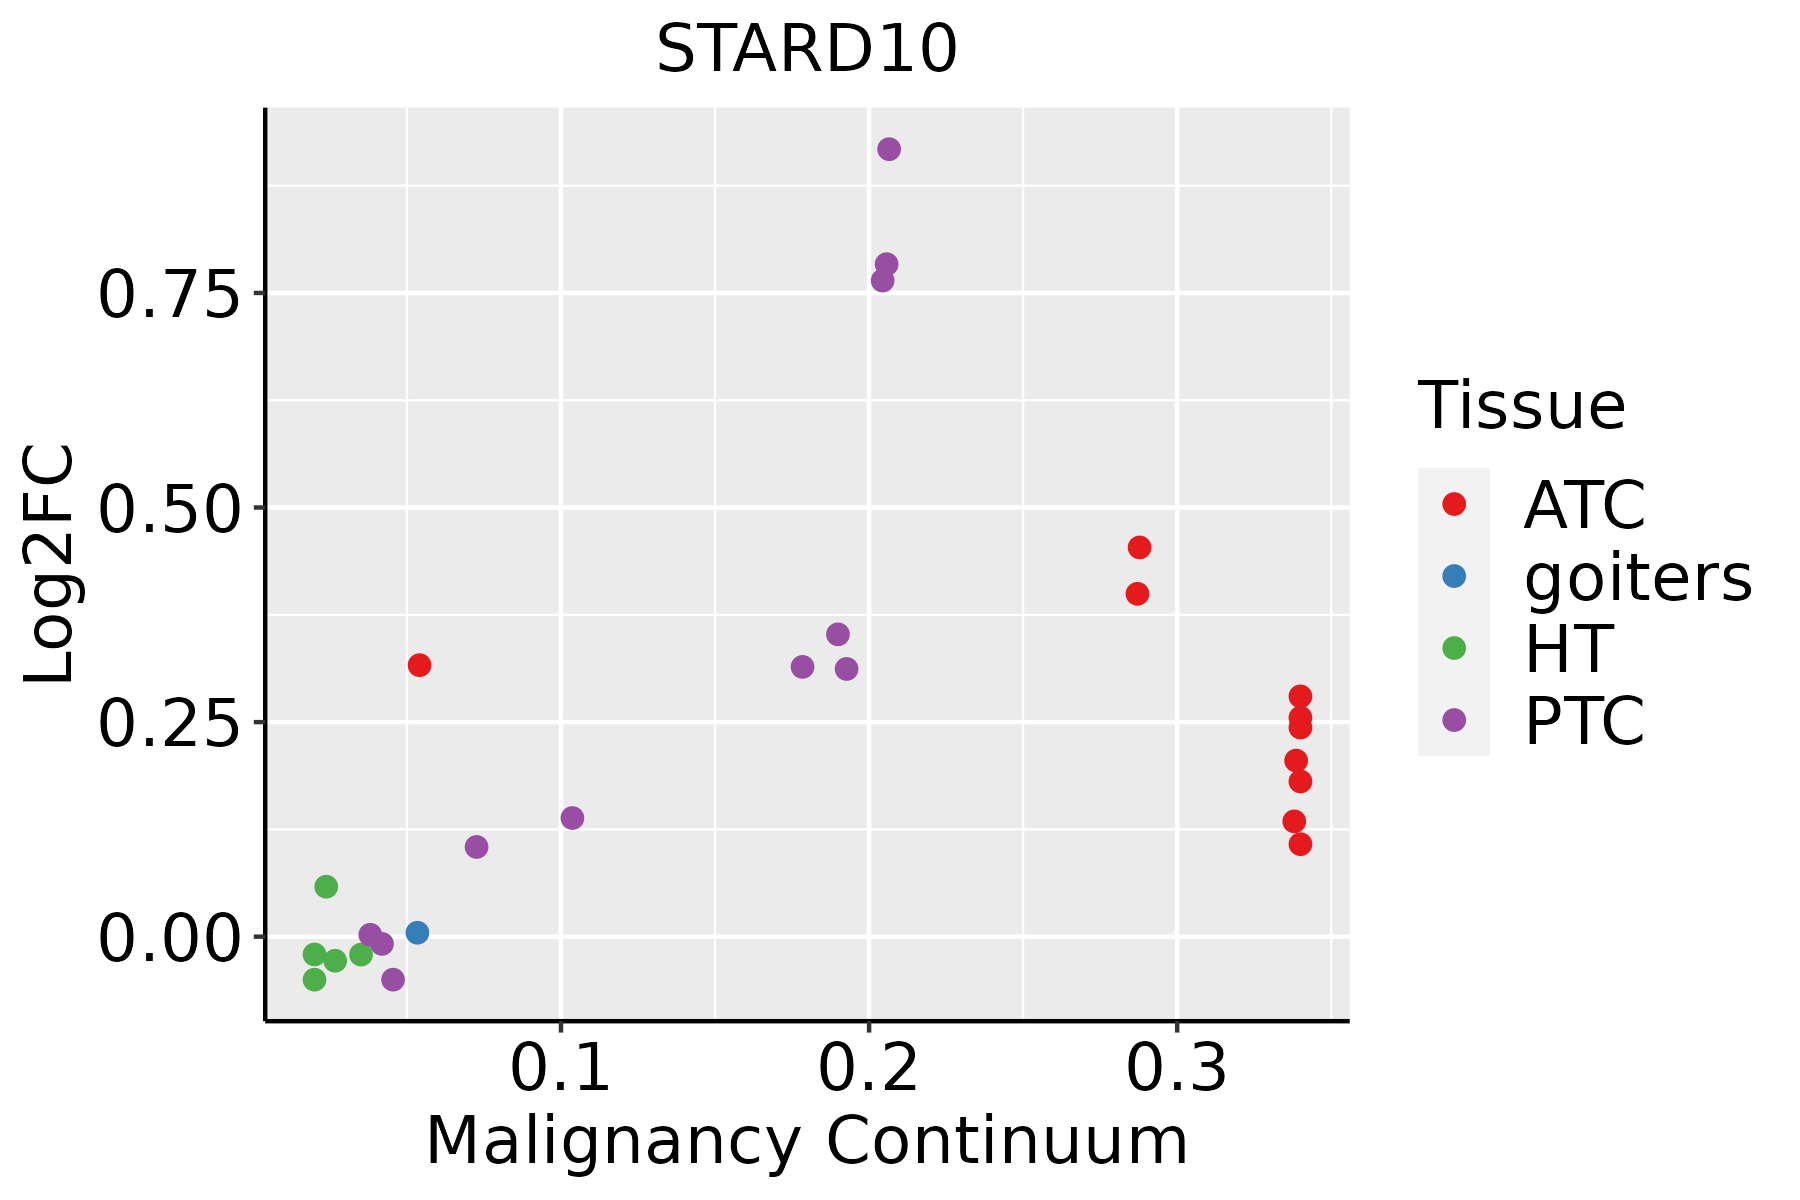 | ATC: Anaplastic thyroid cancer |
| HT: Hashimoto's thyroiditis | ||
| PTC: Papillary thyroid cancer |
| ∗log2FC in expression of this searched gene in stem-like cells from each diseased tissue sample relative to stem-like cells in normal samples in each tissue plotted against the malignancy continuum. Samples are colored based on if they are from different disease stage. |
Top |
Malignant transformation related pathway analysis |
| Find out the enriched GO biological processes and KEGG pathways involved in transition from healthy to precancer to cancer |
| Tissue | Disease Stage | Enriched GO biological Processes |
| Colorectum | AD |  |
| Colorectum | SER |  |
| Colorectum | MSS |  |
| Colorectum | MSI-H |  |
| Colorectum | FAP |  |
| ∗Top 15 enriched GO BP terms are showed in the bar plot of each disease state in each tissue. Each row represents a significant GO biological process which is colored according to the -log10(p.adjust). |
| Page: 1 2 3 4 5 6 7 8 9 |
| GO ID | Tissue | Disease Stage | Description | Gene Ratio | Bg Ratio | pvalue | p.adjust | Count |
| GO:0010876 | Colorectum | AD | lipid localization | 120/3918 | 448/18723 | 1.59e-03 | 1.33e-02 | 120 |
| GO:0006869 | Colorectum | AD | lipid transport | 108/3918 | 398/18723 | 1.67e-03 | 1.39e-02 | 108 |
| GO:00108761 | Colorectum | MSS | lipid localization | 104/3467 | 448/18723 | 6.76e-03 | 4.38e-02 | 104 |
| GO:001087611 | Liver | Cirrhotic | lipid localization | 147/4634 | 448/18723 | 6.24e-05 | 7.12e-04 | 147 |
| GO:000686911 | Liver | Cirrhotic | lipid transport | 128/4634 | 398/18723 | 4.54e-04 | 3.69e-03 | 128 |
| GO:001087621 | Liver | HCC | lipid localization | 228/7958 | 448/18723 | 1.80e-04 | 1.41e-03 | 228 |
| GO:000686921 | Liver | HCC | lipid transport | 198/7958 | 398/18723 | 1.92e-03 | 9.78e-03 | 198 |
| GO:00108764 | Stomach | SIM | lipid localization | 30/708 | 448/18723 | 1.87e-03 | 2.08e-02 | 30 |
| GO:00068693 | Stomach | SIM | lipid transport | 27/708 | 398/18723 | 2.58e-03 | 2.55e-02 | 27 |
| Page: 1 |
| Pathway ID | Tissue | Disease Stage | Description | Gene Ratio | Bg Ratio | pvalue | p.adjust | qvalue | Count |
| Page: 1 |
Top |
Cell-cell communication analysis |
| Identification of potential cell-cell interactions between two cell types and their ligand-receptor pairs for different disease states |
| Ligand | Receptor | LRpair | Pathway | Tissue | Disease Stage |
| Page: 1 |
Top |
Single-cell gene regulatory network inference analysis |
| Find out the significant the regulons (TFs) and the target genes of each regulon across cell types for different disease states |
| TF | Cell Type | Tissue | Disease Stage | Target Gene | RSS | Regulon Activity |
| ∗The dot plots of a searched regulon are shown for all cell subpopulations in each disease state of each tissue based on the regulon specific score inferred using pySCENIC and by calculating the average expression. |
| Page: 1 |
Top |
Somatic mutation of malignant transformation related genes |
| Annotation of somatic variants for genes involved in malignant transformation |
| Hugo Symbol | Variant Class | Variant Classification | dbSNP RS | HGVSc | HGVSp | HGVSp Short | SWISSPROT | BIOTYPE | SIFT | PolyPhen | Tumor Sample Barcode | Tissue | Histology | Sex | Age | Stage | Therapy Types | Drugs | Outcome |
| STARD10 | SNV | Missense_Mutation | c.16N>T | p.Ala6Ser | p.A6S | Q9Y365 | protein_coding | tolerated_low_confidence(0.14) | benign(0.003) | TCGA-C8-A12Y-01 | Breast | breast invasive carcinoma | Female | <65 | I/II | Unknown | Unknown | SD | |
| STARD10 | SNV | Missense_Mutation | rs750557441 | c.488N>A | p.Arg163Gln | p.R163Q | Q9Y365 | protein_coding | deleterious(0) | probably_damaging(1) | TCGA-D8-A27M-01 | Breast | breast invasive carcinoma | Female | <65 | I/II | Chemotherapy | methotrexate+5 | SD |
| STARD10 | insertion | In_Frame_Ins | novel | c.560_561insGCATGGAAGGCTTTGCTACAGAACTTGCAGTTGTACTTCTTACTG | p.Ala187_Gln188insHisGlyArgLeuCysTyrArgThrCysSerCysThrSerTyrCys | p.A187_Q188insHGRLCYRTCSCTSYC | Q9Y365 | protein_coding | TCGA-A7-A4SB-01 | Breast | breast invasive carcinoma | Female | <65 | III/IV | Chemotherapy | docetaxel | CR | ||
| STARD10 | insertion | Frame_Shift_Ins | novel | c.386_387insGT | p.Asp129GlufsTer19 | p.D129Efs*19 | Q9Y365 | protein_coding | TCGA-B6-A0IE-01 | Breast | breast invasive carcinoma | Female | <65 | III/IV | Unknown | Unknown | PD | ||
| STARD10 | insertion | In_Frame_Ins | novel | c.385_386insGGTCTCTTGAGCAGATCAGGAGAGGGC | p.Asp129delinsGlySerLeuGluGlnIleArgArgGlyHis | p.D129delinsGSLEQIRRGH | Q9Y365 | protein_coding | TCGA-B6-A0IE-01 | Breast | breast invasive carcinoma | Female | <65 | III/IV | Unknown | Unknown | PD | ||
| STARD10 | SNV | Missense_Mutation | novel | c.767N>G | p.His256Arg | p.H256R | Q9Y365 | protein_coding | tolerated(0.68) | benign(0.005) | TCGA-2W-A8YY-01 | Cervix | cervical & endocervical cancer | Female | <65 | I/II | Chemotherapy | cisplatin | CR |
| STARD10 | SNV | Missense_Mutation | rs760513932 | c.275G>A | p.Arg92His | p.R92H | Q9Y365 | protein_coding | deleterious(0) | probably_damaging(0.975) | TCGA-C5-A8XK-01 | Cervix | cervical & endocervical cancer | Female | <65 | I/II | Chemotherapy | cisplatin | SD |
| STARD10 | SNV | Missense_Mutation | c.240G>C | p.Glu80Asp | p.E80D | Q9Y365 | protein_coding | tolerated(0.17) | benign(0.01) | TCGA-IR-A3LL-01 | Cervix | cervical & endocervical cancer | Female | <65 | I/II | Chemotherapy | cisplatin | CR | |
| STARD10 | SNV | Missense_Mutation | c.172N>A | p.Ala58Thr | p.A58T | Q9Y365 | protein_coding | tolerated(0.57) | benign(0.089) | TCGA-A6-5665-01 | Colorectum | colon adenocarcinoma | Female | >=65 | I/II | Unknown | Unknown | PD | |
| STARD10 | SNV | Missense_Mutation | rs202222156 | c.340G>A | p.Val114Met | p.V114M | Q9Y365 | protein_coding | deleterious(0.01) | probably_damaging(0.975) | TCGA-AA-3833-01 | Colorectum | colon adenocarcinoma | Female | <65 | I/II | Unknown | Unknown | SD |
| Page: 1 2 3 4 |
Top |
Related drugs of malignant transformation related genes |
| Identification of chemicals and drugs interact with genes involved in malignant transfromation |
| (DGIdb 4.0) |
| Entrez ID | Symbol | Category | Interaction Types | Drug Claim Name | Drug Name | PMIDs |
| Page: 1 |

Copyright 2023-Present -The University of Texas Health Science Center at Houston |