
|
|||||
|
 | |
| |
| |
| |
| |
| |
|
Gene: STAP2 |
Gene summary for STAP2 |
| Gene information | Species | Human | Gene symbol | STAP2 | Gene ID | 55620 |
| Gene name | signal transducing adaptor family member 2 | |
| Gene Alias | BKS | |
| Cytomap | 19p13.3 | |
| Gene Type | protein-coding | GO ID | GO:0005575 | UniProtAcc | Q9UGK3 |
Top |
Malignant transformation analysis |
| Identification of the aberrant gene expression in precancerous and cancerous lesions by comparing the gene expression of stem-like cells in diseased tissues with normal stem cells |
| Entrez ID | Symbol | Replicates | Species | Organ | Tissue | Adj P-value | Log2FC | Malignancy |
| 55620 | STAP2 | HTA11_2487_2000001011 | Human | Colorectum | SER | 2.11e-05 | 4.53e-01 | -0.1808 |
| 55620 | STAP2 | HTA11_347_2000001011 | Human | Colorectum | AD | 1.31e-09 | 4.22e-01 | -0.1954 |
| 55620 | STAP2 | HTA11_411_2000001011 | Human | Colorectum | SER | 1.31e-03 | 8.29e-01 | -0.2602 |
| 55620 | STAP2 | HTA11_3361_2000001011 | Human | Colorectum | AD | 4.49e-02 | 3.42e-01 | -0.1207 |
| 55620 | STAP2 | HTA11_83_2000001011 | Human | Colorectum | SER | 8.25e-06 | 4.17e-01 | -0.1526 |
| 55620 | STAP2 | HTA11_696_2000001011 | Human | Colorectum | AD | 6.10e-20 | 5.60e-01 | -0.1464 |
| 55620 | STAP2 | HTA11_866_2000001011 | Human | Colorectum | AD | 9.38e-06 | 3.38e-01 | -0.1001 |
| 55620 | STAP2 | HTA11_1391_2000001011 | Human | Colorectum | AD | 2.29e-06 | 3.91e-01 | -0.059 |
| 55620 | STAP2 | HTA11_546_2000001011 | Human | Colorectum | AD | 2.97e-02 | 4.10e-01 | -0.0842 |
| 55620 | STAP2 | HTA11_7696_3000711011 | Human | Colorectum | AD | 1.41e-02 | 2.44e-01 | 0.0674 |
| 55620 | STAP2 | A015-C-203 | Human | Colorectum | FAP | 3.08e-06 | 2.27e-01 | -0.1294 |
| 55620 | STAP2 | A015-C-104 | Human | Colorectum | FAP | 2.20e-04 | 7.26e-02 | -0.1899 |
| 55620 | STAP2 | A002-C-116 | Human | Colorectum | FAP | 1.19e-02 | -6.65e-02 | -0.0452 |
| 55620 | STAP2 | LZE3D | Human | Esophagus | HGIN | 1.52e-02 | 4.13e-01 | 0.0668 |
| 55620 | STAP2 | LZE4T | Human | Esophagus | ESCC | 1.73e-06 | 4.43e-01 | 0.0811 |
| 55620 | STAP2 | LZE7T | Human | Esophagus | ESCC | 4.90e-05 | 6.14e-01 | 0.0667 |
| 55620 | STAP2 | LZE8T | Human | Esophagus | ESCC | 2.03e-10 | 4.79e-01 | 0.067 |
| 55620 | STAP2 | LZE20T | Human | Esophagus | ESCC | 5.95e-04 | 2.27e-01 | 0.0662 |
| 55620 | STAP2 | LZE22T | Human | Esophagus | ESCC | 2.43e-05 | 4.58e-01 | 0.068 |
| 55620 | STAP2 | LZE24T | Human | Esophagus | ESCC | 1.83e-21 | 8.86e-01 | 0.0596 |
| Page: 1 2 3 4 5 6 7 |
| Tissue | Expression Dynamics | Abbreviation |
| Colorectum (GSE201348) |  | FAP: Familial adenomatous polyposis |
| CRC: Colorectal cancer | ||
| Colorectum (HTA11) |  | AD: Adenomas |
| SER: Sessile serrated lesions | ||
| MSI-H: Microsatellite-high colorectal cancer | ||
| MSS: Microsatellite stable colorectal cancer | ||
| Esophagus | 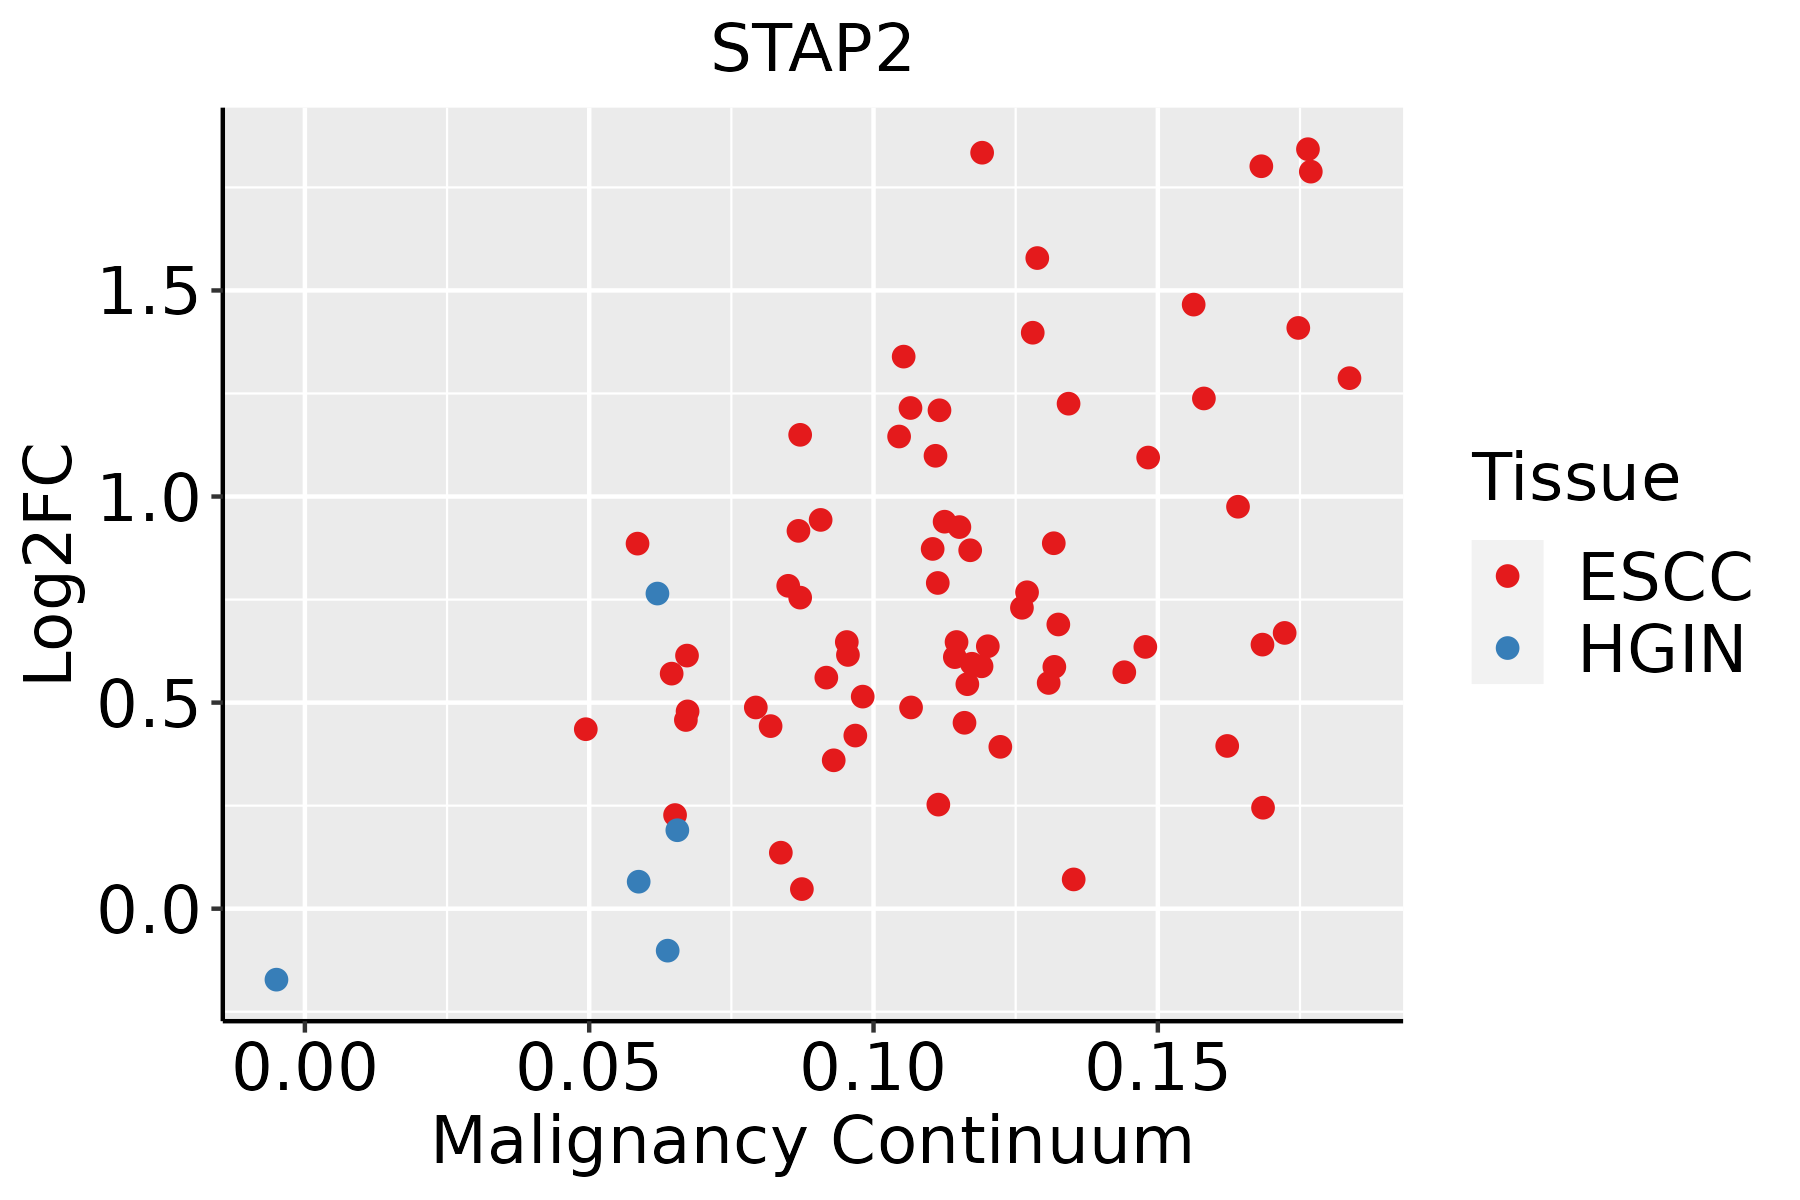 | ESCC: Esophageal squamous cell carcinoma |
| HGIN: High-grade intraepithelial neoplasias | ||
| LGIN: Low-grade intraepithelial neoplasias | ||
| GC |  | CAG: Chronic atrophic gastritis |
| CAG with IM: Chronic atrophic gastritis with intestinal metaplasia | ||
| CSG: Chronic superficial gastritis | ||
| GC: Gastric cancer | ||
| SIM: Severe intestinal metaplasia | ||
| WIM: Wild intestinal metaplasia | ||
| Liver |  | HCC: Hepatocellular carcinoma |
| NAFLD: Non-alcoholic fatty liver disease | ||
| Oral Cavity | 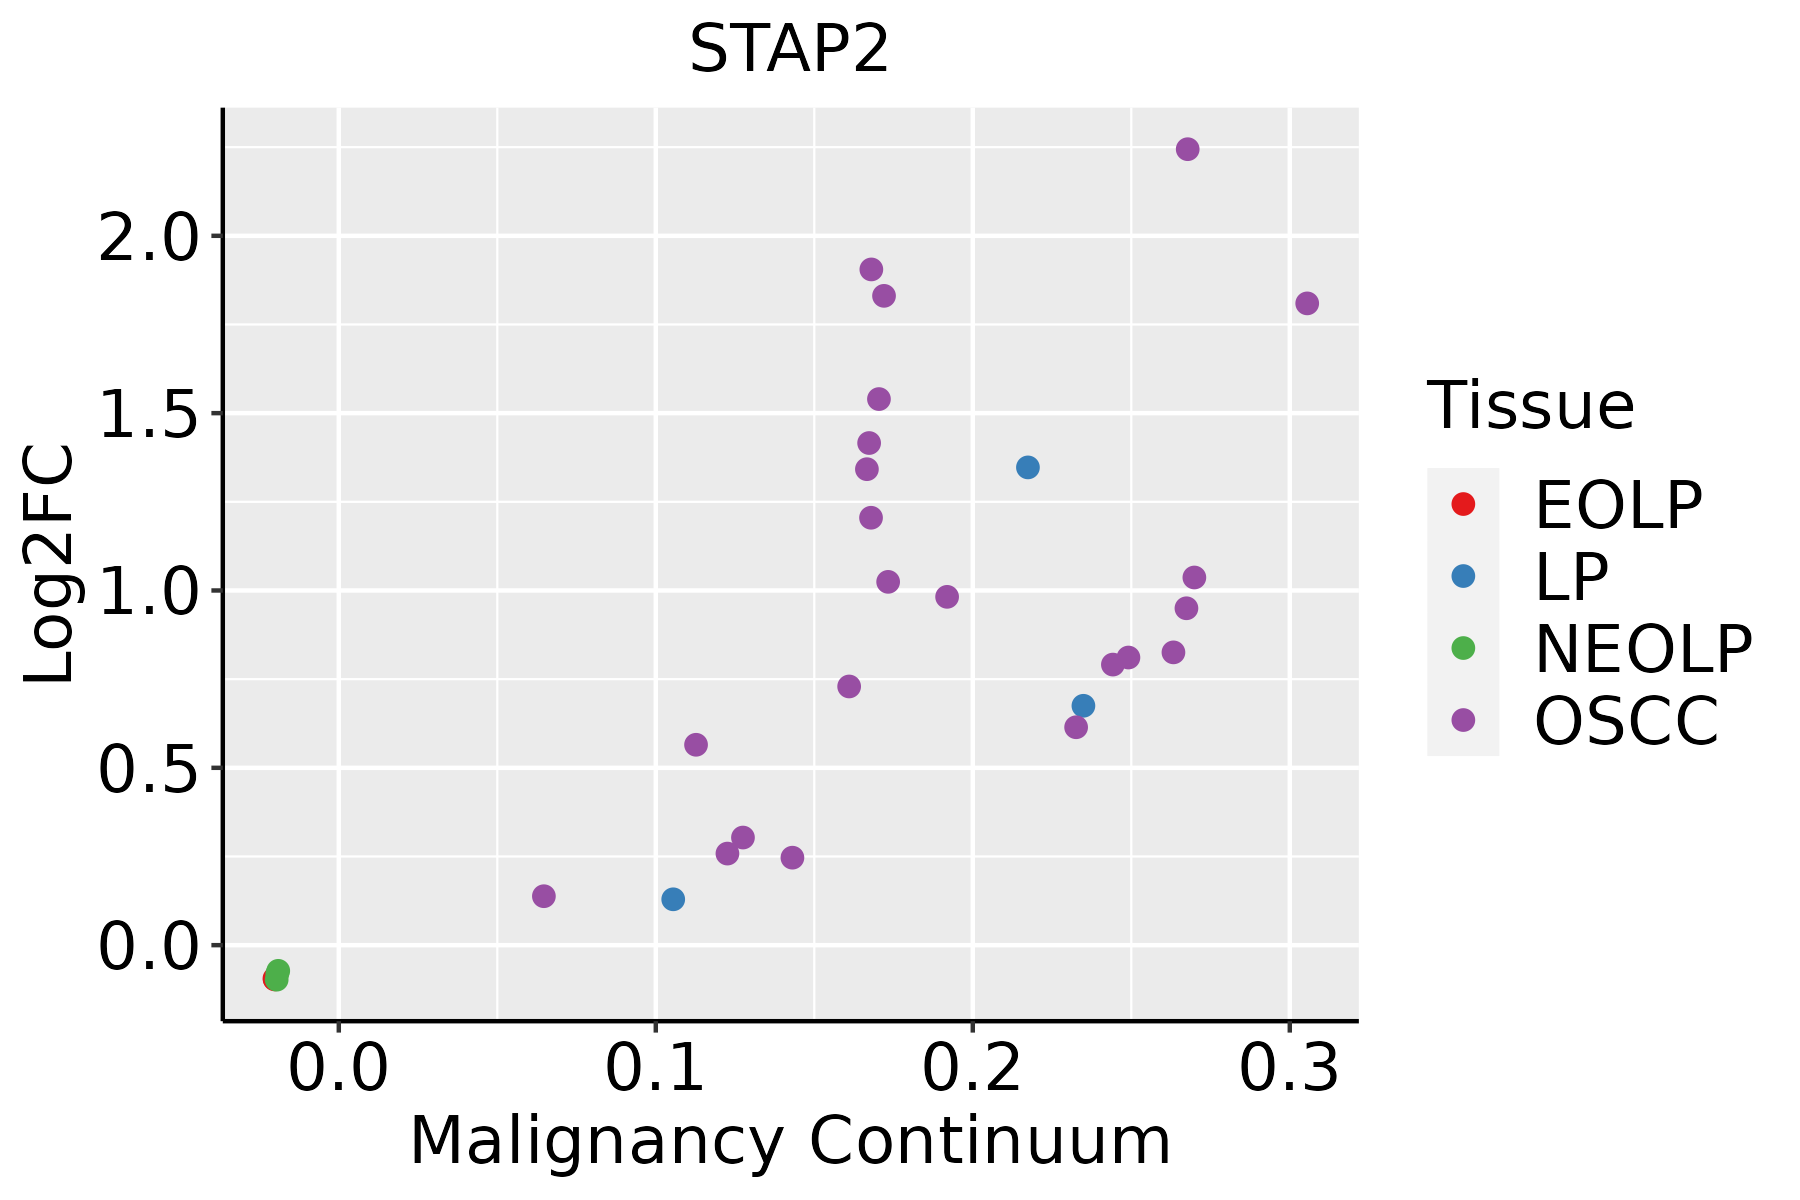 | EOLP: Erosive Oral lichen planus |
| LP: leukoplakia | ||
| NEOLP: Non-erosive oral lichen planus | ||
| OSCC: Oral squamous cell carcinoma | ||
| Skin |  | AK: Actinic keratosis |
| cSCC: Cutaneous squamous cell carcinoma | ||
| SCCIS:squamous cell carcinoma in situ |
| ∗log2FC in expression of this searched gene in stem-like cells from each diseased tissue sample relative to stem-like cells in normal samples in each tissue plotted against the malignancy continuum. Samples are colored based on if they are from different disease stage. |
Top |
Malignant transformation related pathway analysis |
| Find out the enriched GO biological processes and KEGG pathways involved in transition from healthy to precancer to cancer |
| Tissue | Disease Stage | Enriched GO biological Processes |
| Colorectum | AD |  |
| Colorectum | SER |  |
| Colorectum | MSS |  |
| Colorectum | MSI-H |  |
| Colorectum | FAP |  |
| ∗Top 15 enriched GO BP terms are showed in the bar plot of each disease state in each tissue. Each row represents a significant GO biological process which is colored according to the -log10(p.adjust). |
| Page: 1 2 3 4 5 6 7 8 9 |
| GO ID | Tissue | Disease Stage | Description | Gene Ratio | Bg Ratio | pvalue | p.adjust | Count |
| Page: 1 |
| Pathway ID | Tissue | Disease Stage | Description | Gene Ratio | Bg Ratio | pvalue | p.adjust | qvalue | Count |
| Page: 1 |
Top |
Cell-cell communication analysis |
| Identification of potential cell-cell interactions between two cell types and their ligand-receptor pairs for different disease states |
| Ligand | Receptor | LRpair | Pathway | Tissue | Disease Stage |
| Page: 1 |
Top |
Single-cell gene regulatory network inference analysis |
| Find out the significant the regulons (TFs) and the target genes of each regulon across cell types for different disease states |
| TF | Cell Type | Tissue | Disease Stage | Target Gene | RSS | Regulon Activity |
| ∗The dot plots of a searched regulon are shown for all cell subpopulations in each disease state of each tissue based on the regulon specific score inferred using pySCENIC and by calculating the average expression. |
| Page: 1 |
Top |
Somatic mutation of malignant transformation related genes |
| Annotation of somatic variants for genes involved in malignant transformation |
| Hugo Symbol | Variant Class | Variant Classification | dbSNP RS | HGVSc | HGVSp | HGVSp Short | SWISSPROT | BIOTYPE | SIFT | PolyPhen | Tumor Sample Barcode | Tissue | Histology | Sex | Age | Stage | Therapy Types | Drugs | Outcome |
| STAP2 | SNV | Missense_Mutation | c.926N>C | p.Asn309Thr | p.N309T | Q9UGK3 | protein_coding | deleterious(0.02) | possibly_damaging(0.602) | TCGA-A8-A08P-01 | Breast | breast invasive carcinoma | Female | >=65 | III/IV | Chemotherapy | 5-fluorouracil | CR | |
| STAP2 | SNV | Missense_Mutation | c.743N>G | p.Glu248Gly | p.E248G | Q9UGK3 | protein_coding | tolerated(0.05) | probably_damaging(0.929) | TCGA-A8-A09Z-01 | Breast | breast invasive carcinoma | Female | >=65 | I/II | Unknown | Unknown | SD | |
| STAP2 | SNV | Missense_Mutation | novel | c.1195N>G | p.Leu399Val | p.L399V | Q9UGK3 | protein_coding | deleterious_low_confidence(0.03) | benign(0.08) | TCGA-BH-A6R8-01 | Breast | breast invasive carcinoma | Female | <65 | I/II | Unknown | Unknown | SD |
| STAP2 | SNV | Missense_Mutation | novel | c.778N>A | p.Asp260Asn | p.D260N | Q9UGK3 | protein_coding | tolerated(0.25) | benign(0.139) | TCGA-E9-A6HE-01 | Breast | breast invasive carcinoma | Female | <65 | III/IV | Chemotherapy | adriamycin | CR |
| STAP2 | SNV | Missense_Mutation | novel | c.977A>G | p.Asp326Gly | p.D326G | Q9UGK3 | protein_coding | deleterious_low_confidence(0) | benign(0.366) | TCGA-OL-A66J-01 | Breast | breast invasive carcinoma | Female | >=65 | I/II | Unknown | Unknown | SD |
| STAP2 | insertion | Frame_Shift_Ins | novel | c.967_968insGCTCACTGCAAGCTCCGCCTCCTGGGTTCACGCCATTCTCCTGCCT | p.Glu323GlyfsTer24 | p.E323Gfs*24 | Q9UGK3 | protein_coding | TCGA-B6-A0I6-01 | Breast | breast invasive carcinoma | Female | <65 | I/II | Unknown | Unknown | PD | ||
| STAP2 | insertion | In_Frame_Ins | novel | c.934_935insGAAAAGCCCATTTTACAG | p.Thr312delinsArgLysAlaHisPheThrAla | p.T312delinsRKAHFTA | Q9UGK3 | protein_coding | TCGA-BH-A0GZ-01 | Breast | breast invasive carcinoma | Female | <65 | I/II | Hormone Therapy | arimidex | SD | ||
| STAP2 | deletion | Frame_Shift_Del | novel | c.1201delN | p.Ser401LeufsTer33 | p.S401Lfs*33 | Q9UGK3 | protein_coding | TCGA-D8-A27V-01 | Breast | breast invasive carcinoma | Female | <65 | I/II | Hormone Therapy | tamoxiphen | SD | ||
| STAP2 | SNV | Missense_Mutation | rs746861123 | c.640G>A | p.Val214Met | p.V214M | Q9UGK3 | protein_coding | deleterious(0.02) | probably_damaging(0.966) | TCGA-C5-A7CO-01 | Cervix | cervical & endocervical cancer | Female | >=65 | I/II | Chemotherapy | cisplatin | SD |
| STAP2 | SNV | Missense_Mutation | c.499N>C | p.Glu167Gln | p.E167Q | Q9UGK3 | protein_coding | deleterious(0.04) | possibly_damaging(0.803) | TCGA-IR-A3LK-01 | Cervix | cervical & endocervical cancer | Female | >=65 | I/II | Chemotherapy | cisplatin | PD |
| Page: 1 2 3 4 |
Top |
Related drugs of malignant transformation related genes |
| Identification of chemicals and drugs interact with genes involved in malignant transfromation |
| (DGIdb 4.0) |
| Entrez ID | Symbol | Category | Interaction Types | Drug Claim Name | Drug Name | PMIDs |
| Page: 1 |

Copyright 2023-Present -The University of Texas Health Science Center at Houston |