
|
|||||
|
 | |
| |
| |
| |
| |
| |
|
Gene: STAMBPL1 |
Gene summary for STAMBPL1 |
| Gene information | Species | Human | Gene symbol | STAMBPL1 | Gene ID | 57559 |
| Gene name | STAM binding protein like 1 | |
| Gene Alias | ALMalpha | |
| Cytomap | 10q23.31 | |
| Gene Type | protein-coding | GO ID | GO:0006464 | UniProtAcc | Q96FJ0 |
Top |
Malignant transformation analysis |
| Identification of the aberrant gene expression in precancerous and cancerous lesions by comparing the gene expression of stem-like cells in diseased tissues with normal stem cells |
| Entrez ID | Symbol | Replicates | Species | Organ | Tissue | Adj P-value | Log2FC | Malignancy |
| 57559 | STAMBPL1 | HTA11_3410_2000001011 | Human | Colorectum | AD | 1.52e-12 | -5.51e-01 | 0.0155 |
| 57559 | STAMBPL1 | HTA11_2487_2000001011 | Human | Colorectum | SER | 1.01e-10 | -6.41e-01 | -0.1808 |
| 57559 | STAMBPL1 | HTA11_1938_2000001011 | Human | Colorectum | AD | 3.65e-02 | -4.01e-01 | -0.0811 |
| 57559 | STAMBPL1 | HTA11_347_2000001011 | Human | Colorectum | AD | 2.20e-05 | -3.82e-01 | -0.1954 |
| 57559 | STAMBPL1 | HTA11_411_2000001011 | Human | Colorectum | SER | 3.14e-02 | -7.10e-01 | -0.2602 |
| 57559 | STAMBPL1 | HTA11_3361_2000001011 | Human | Colorectum | AD | 2.13e-09 | -6.60e-01 | -0.1207 |
| 57559 | STAMBPL1 | HTA11_83_2000001011 | Human | Colorectum | SER | 7.43e-03 | -5.47e-01 | -0.1526 |
| 57559 | STAMBPL1 | HTA11_696_2000001011 | Human | Colorectum | AD | 3.16e-22 | -6.08e-01 | -0.1464 |
| 57559 | STAMBPL1 | HTA11_866_2000001011 | Human | Colorectum | AD | 1.51e-11 | -4.62e-01 | -0.1001 |
| 57559 | STAMBPL1 | HTA11_1391_2000001011 | Human | Colorectum | AD | 3.59e-03 | -4.12e-01 | -0.059 |
| 57559 | STAMBPL1 | HTA11_2992_2000001011 | Human | Colorectum | SER | 1.77e-02 | -6.53e-01 | -0.1706 |
| 57559 | STAMBPL1 | HTA11_546_2000001011 | Human | Colorectum | AD | 9.20e-04 | -5.74e-01 | -0.0842 |
| 57559 | STAMBPL1 | HTA11_866_3004761011 | Human | Colorectum | AD | 5.35e-10 | -5.27e-01 | 0.096 |
| 57559 | STAMBPL1 | HTA11_8622_2000001021 | Human | Colorectum | SER | 3.97e-02 | -5.92e-01 | 0.0528 |
| 57559 | STAMBPL1 | HTA11_10711_2000001011 | Human | Colorectum | AD | 5.17e-06 | -5.27e-01 | 0.0338 |
| 57559 | STAMBPL1 | HTA11_7696_3000711011 | Human | Colorectum | AD | 5.23e-16 | -5.29e-01 | 0.0674 |
| 57559 | STAMBPL1 | HTA11_99999970781_79442 | Human | Colorectum | MSS | 5.67e-20 | -5.79e-01 | 0.294 |
| 57559 | STAMBPL1 | HTA11_99999971662_82457 | Human | Colorectum | MSS | 8.91e-05 | -3.60e-01 | 0.3859 |
| 57559 | STAMBPL1 | HTA11_99999973899_84307 | Human | Colorectum | MSS | 1.70e-05 | -6.30e-01 | 0.2585 |
| 57559 | STAMBPL1 | HTA11_99999974143_84620 | Human | Colorectum | MSS | 1.16e-27 | -6.39e-01 | 0.3005 |
| Page: 1 2 3 |
| Tissue | Expression Dynamics | Abbreviation |
| Colorectum (GSE201348) |  | FAP: Familial adenomatous polyposis |
| CRC: Colorectal cancer | ||
| Colorectum (HTA11) | 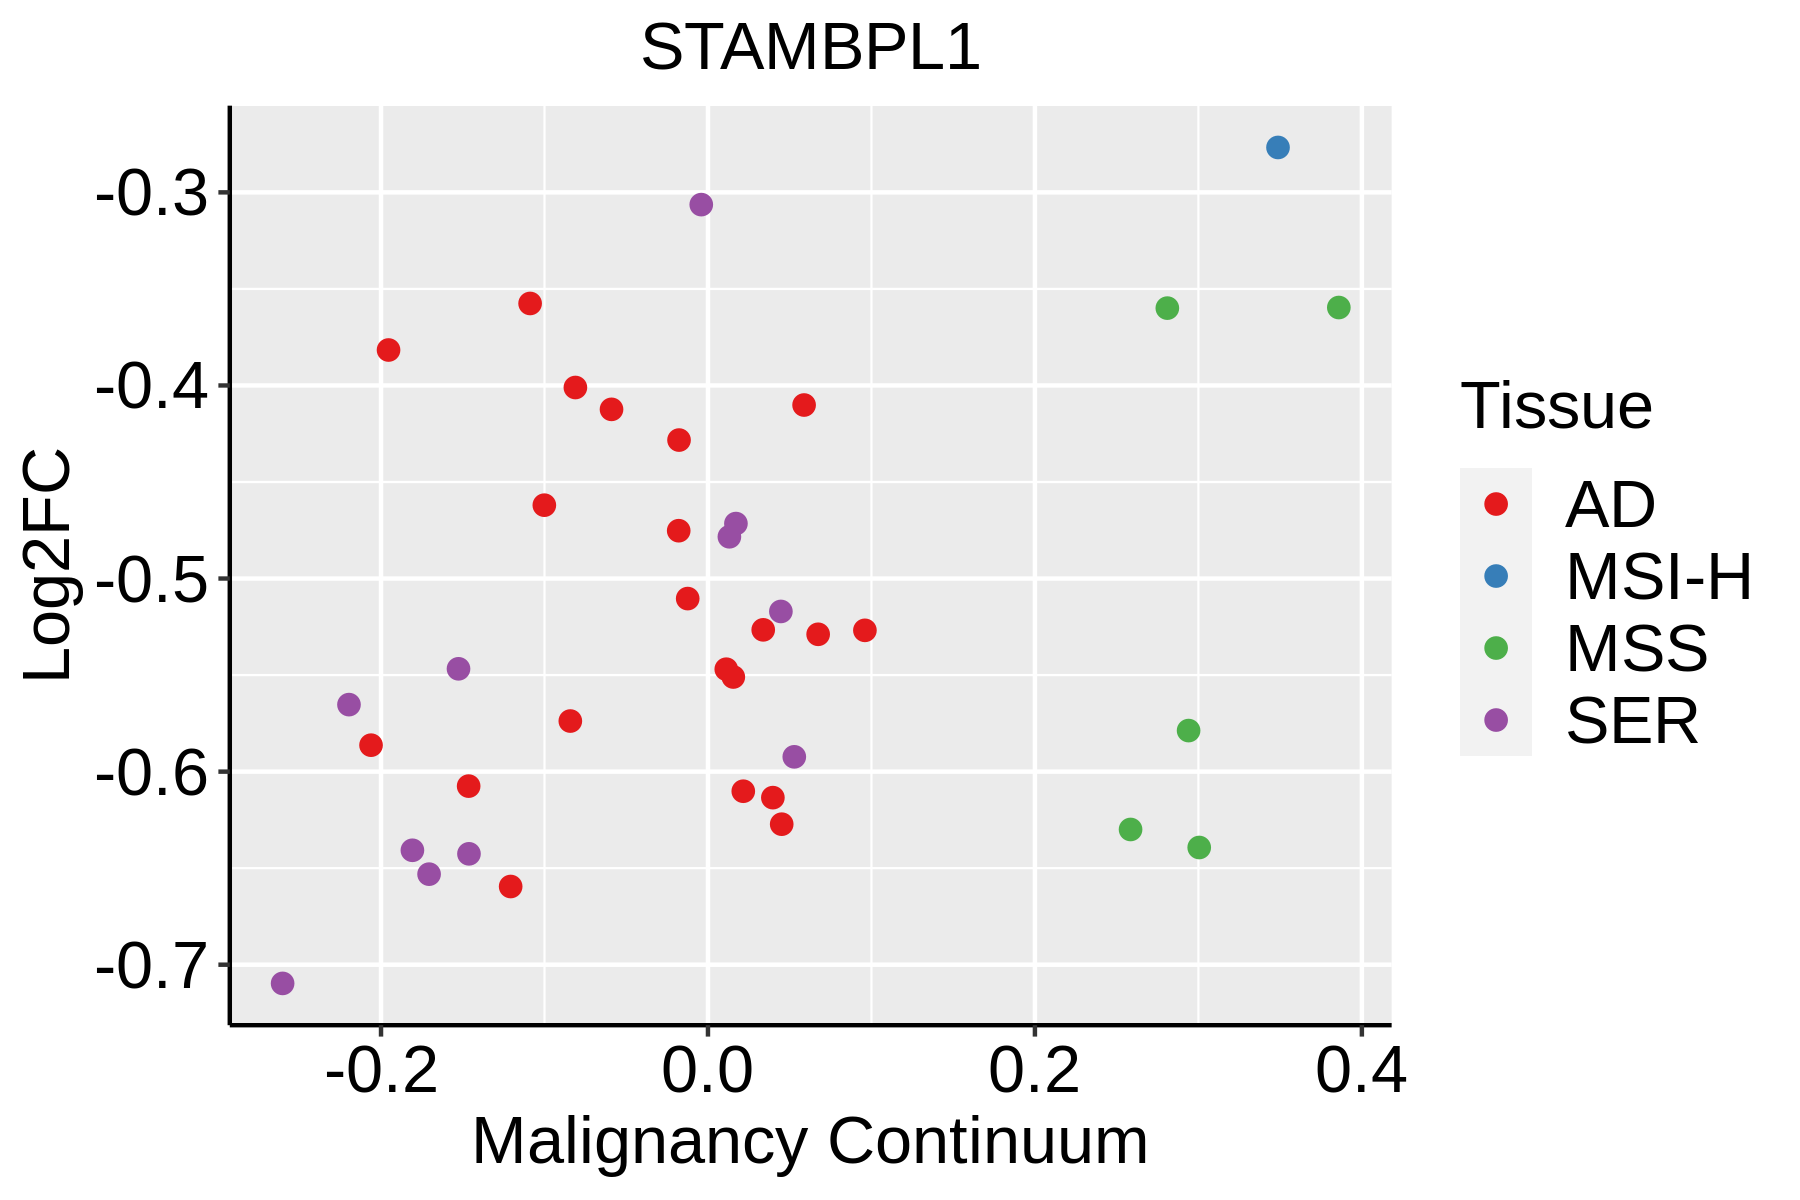 | AD: Adenomas |
| SER: Sessile serrated lesions | ||
| MSI-H: Microsatellite-high colorectal cancer | ||
| MSS: Microsatellite stable colorectal cancer | ||
| Liver | 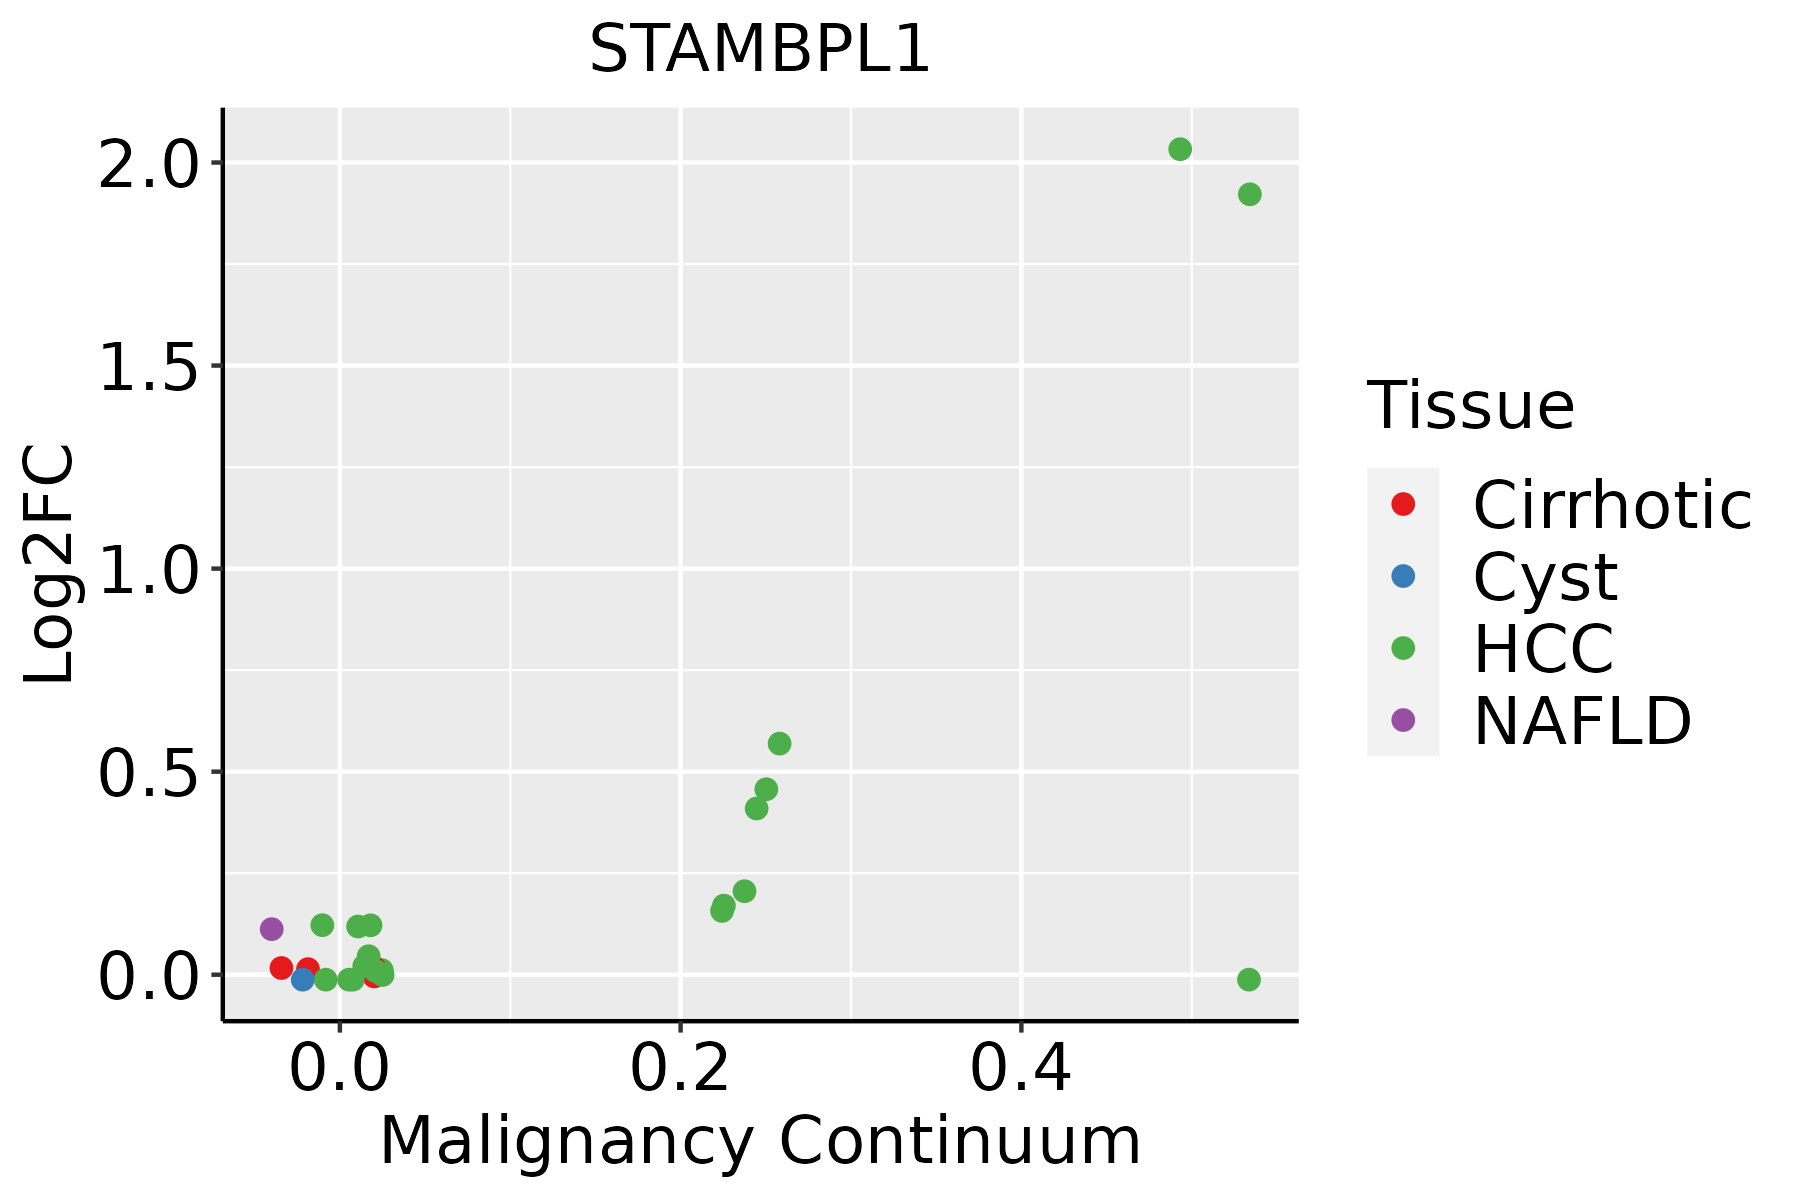 | HCC: Hepatocellular carcinoma |
| NAFLD: Non-alcoholic fatty liver disease |
| ∗log2FC in expression of this searched gene in stem-like cells from each diseased tissue sample relative to stem-like cells in normal samples in each tissue plotted against the malignancy continuum. Samples are colored based on if they are from different disease stage. |
Top |
Malignant transformation related pathway analysis |
| Find out the enriched GO biological processes and KEGG pathways involved in transition from healthy to precancer to cancer |
| Tissue | Disease Stage | Enriched GO biological Processes |
| Colorectum | AD |  |
| Colorectum | SER |  |
| Colorectum | MSS |  |
| Colorectum | MSI-H |  |
| Colorectum | FAP |  |
| ∗Top 15 enriched GO BP terms are showed in the bar plot of each disease state in each tissue. Each row represents a significant GO biological process which is colored according to the -log10(p.adjust). |
| Page: 1 2 3 4 5 6 7 8 9 |
| GO ID | Tissue | Disease Stage | Description | Gene Ratio | Bg Ratio | pvalue | p.adjust | Count |
| GO:00706461 | Liver | HCC | protein modification by small protein removal | 91/7958 | 157/18723 | 6.50e-05 | 5.92e-04 | 91 |
| GO:00165791 | Liver | HCC | protein deubiquitination | 78/7958 | 139/18723 | 8.13e-04 | 4.87e-03 | 78 |
| GO:00705361 | Liver | HCC | protein K63-linked deubiquitination | 24/7958 | 35/18723 | 1.64e-03 | 8.61e-03 | 24 |
| Page: 1 |
| Pathway ID | Tissue | Disease Stage | Description | Gene Ratio | Bg Ratio | pvalue | p.adjust | qvalue | Count |
| Page: 1 |
Top |
Cell-cell communication analysis |
| Identification of potential cell-cell interactions between two cell types and their ligand-receptor pairs for different disease states |
| Ligand | Receptor | LRpair | Pathway | Tissue | Disease Stage |
| Page: 1 |
Top |
Single-cell gene regulatory network inference analysis |
| Find out the significant the regulons (TFs) and the target genes of each regulon across cell types for different disease states |
| TF | Cell Type | Tissue | Disease Stage | Target Gene | RSS | Regulon Activity |
| ∗The dot plots of a searched regulon are shown for all cell subpopulations in each disease state of each tissue based on the regulon specific score inferred using pySCENIC and by calculating the average expression. |
| Page: 1 |
Top |
Somatic mutation of malignant transformation related genes |
| Annotation of somatic variants for genes involved in malignant transformation |
| Hugo Symbol | Variant Class | Variant Classification | dbSNP RS | HGVSc | HGVSp | HGVSp Short | SWISSPROT | BIOTYPE | SIFT | PolyPhen | Tumor Sample Barcode | Tissue | Histology | Sex | Age | Stage | Therapy Types | Drugs | Outcome |
| STAMBPL1 | SNV | Missense_Mutation | c.1170N>T | p.Arg390Ser | p.R390S | Q96FJ0 | protein_coding | tolerated(0.2) | probably_damaging(0.993) | TCGA-A8-A09A-01 | Breast | breast invasive carcinoma | Female | <65 | I/II | Hormone Therapy | tamoxiphen | SD | |
| STAMBPL1 | SNV | Missense_Mutation | rs148947892 | c.391N>A | p.Val131Ile | p.V131I | Q96FJ0 | protein_coding | tolerated(0.13) | benign(0) | TCGA-AN-A046-01 | Breast | breast invasive carcinoma | Female | >=65 | I/II | Unknown | Unknown | SD |
| STAMBPL1 | SNV | Missense_Mutation | c.975N>C | p.Met325Ile | p.M325I | Q96FJ0 | protein_coding | deleterious(0.02) | benign(0.003) | TCGA-B6-A0RT-01 | Breast | breast invasive carcinoma | Female | <65 | III/IV | Unknown | Unknown | SD | |
| STAMBPL1 | insertion | Frame_Shift_Ins | novel | c.887_888insGAAGTATTTTGTCATTG | p.Ile296MetfsTer12 | p.I296Mfs*12 | Q96FJ0 | protein_coding | TCGA-A7-A0CJ-01 | Breast | breast invasive carcinoma | Female | <65 | I/II | Chemotherapy | cytoxan | SD | ||
| STAMBPL1 | insertion | Nonsense_Mutation | novel | c.889_890insAGAGGTTTTAAATGAGAAGAA | p.Leu297delinsGlnArgPheTerMetArgArgIle | p.L297delinsQRF*MRRI | Q96FJ0 | protein_coding | TCGA-A7-A0CJ-01 | Breast | breast invasive carcinoma | Female | <65 | I/II | Chemotherapy | cytoxan | SD | ||
| STAMBPL1 | insertion | Frame_Shift_Ins | novel | c.712_713insTTTTGAG | p.Tyr238PhefsTer5 | p.Y238Ffs*5 | Q96FJ0 | protein_coding | TCGA-A7-A6VX-01 | Breast | breast invasive carcinoma | Female | >=65 | I/II | Chemotherapy | docetaxel | CR | ||
| STAMBPL1 | SNV | Missense_Mutation | c.1364N>T | p.Ser455Leu | p.S455L | Q96FJ0 | protein_coding | deleterious_low_confidence(0) | benign(0) | TCGA-C5-A3HE-01 | Cervix | cervical & endocervical cancer | Female | <65 | I/II | Unknown | Unknown | PD | |
| STAMBPL1 | SNV | Missense_Mutation | c.321G>C | p.Met107Ile | p.M107I | Q96FJ0 | protein_coding | tolerated(0.22) | benign(0.001) | TCGA-DG-A2KM-01 | Cervix | cervical & endocervical cancer | Female | <65 | I/II | Chemotherapy | cisplatin | SD | |
| STAMBPL1 | SNV | Missense_Mutation | novel | c.619G>T | p.Asp207Tyr | p.D207Y | Q96FJ0 | protein_coding | deleterious(0.01) | benign(0.018) | TCGA-VS-A8QM-01 | Cervix | cervical & endocervical cancer | Female | <65 | I/II | Chemotherapy | cisplatin | PD |
| STAMBPL1 | SNV | Missense_Mutation | c.1285N>C | p.Lys429Gln | p.K429Q | Q96FJ0 | protein_coding | tolerated(0.52) | benign(0.015) | TCGA-A6-6141-01 | Colorectum | colon adenocarcinoma | Male | <65 | I/II | Chemotherapy | 5-fu | SD |
| Page: 1 2 3 4 5 |
Top |
Related drugs of malignant transformation related genes |
| Identification of chemicals and drugs interact with genes involved in malignant transfromation |
| (DGIdb 4.0) |
| Entrez ID | Symbol | Category | Interaction Types | Drug Claim Name | Drug Name | PMIDs |
| Page: 1 |

Copyright 2023-Present -The University of Texas Health Science Center at Houston |