
|
|||||
|
 | |
| |
| |
| |
| |
| |
|
Gene: STAM2 |
Gene summary for STAM2 |
| Gene information | Species | Human | Gene symbol | STAM2 | Gene ID | 10254 |
| Gene name | signal transducing adaptor molecule 2 | |
| Gene Alias | Hbp | |
| Cytomap | 2q23.3 | |
| Gene Type | protein-coding | GO ID | GO:0006810 | UniProtAcc | O75886 |
Top |
Malignant transformation analysis |
| Identification of the aberrant gene expression in precancerous and cancerous lesions by comparing the gene expression of stem-like cells in diseased tissues with normal stem cells |
| Entrez ID | Symbol | Replicates | Species | Organ | Tissue | Adj P-value | Log2FC | Malignancy |
| 10254 | STAM2 | LZE4T | Human | Esophagus | ESCC | 2.26e-06 | 1.59e-01 | 0.0811 |
| 10254 | STAM2 | LZE5T | Human | Esophagus | ESCC | 2.61e-04 | 2.80e-01 | 0.0514 |
| 10254 | STAM2 | LZE8T | Human | Esophagus | ESCC | 1.58e-02 | 6.13e-02 | 0.067 |
| 10254 | STAM2 | LZE24T | Human | Esophagus | ESCC | 6.95e-11 | 2.21e-01 | 0.0596 |
| 10254 | STAM2 | P1T-E | Human | Esophagus | ESCC | 4.10e-02 | 1.76e-01 | 0.0875 |
| 10254 | STAM2 | P2T-E | Human | Esophagus | ESCC | 9.38e-18 | 1.10e-01 | 0.1177 |
| 10254 | STAM2 | P4T-E | Human | Esophagus | ESCC | 5.12e-12 | 3.09e-01 | 0.1323 |
| 10254 | STAM2 | P5T-E | Human | Esophagus | ESCC | 4.68e-10 | 1.02e-01 | 0.1327 |
| 10254 | STAM2 | P8T-E | Human | Esophagus | ESCC | 6.01e-15 | 1.90e-01 | 0.0889 |
| 10254 | STAM2 | P9T-E | Human | Esophagus | ESCC | 1.46e-07 | 1.45e-01 | 0.1131 |
| 10254 | STAM2 | P10T-E | Human | Esophagus | ESCC | 4.24e-07 | 1.23e-01 | 0.116 |
| 10254 | STAM2 | P11T-E | Human | Esophagus | ESCC | 6.79e-06 | 2.93e-01 | 0.1426 |
| 10254 | STAM2 | P12T-E | Human | Esophagus | ESCC | 3.42e-26 | 2.95e-01 | 0.1122 |
| 10254 | STAM2 | P15T-E | Human | Esophagus | ESCC | 3.15e-18 | 4.30e-01 | 0.1149 |
| 10254 | STAM2 | P16T-E | Human | Esophagus | ESCC | 1.86e-17 | 1.71e-01 | 0.1153 |
| 10254 | STAM2 | P17T-E | Human | Esophagus | ESCC | 4.33e-02 | 2.46e-01 | 0.1278 |
| 10254 | STAM2 | P20T-E | Human | Esophagus | ESCC | 3.13e-08 | 1.85e-01 | 0.1124 |
| 10254 | STAM2 | P21T-E | Human | Esophagus | ESCC | 5.52e-22 | 2.25e-01 | 0.1617 |
| 10254 | STAM2 | P22T-E | Human | Esophagus | ESCC | 6.97e-09 | 1.03e-01 | 0.1236 |
| 10254 | STAM2 | P23T-E | Human | Esophagus | ESCC | 2.83e-15 | 3.54e-01 | 0.108 |
| Page: 1 2 3 4 |
| Tissue | Expression Dynamics | Abbreviation |
| Esophagus |  | ESCC: Esophageal squamous cell carcinoma |
| HGIN: High-grade intraepithelial neoplasias | ||
| LGIN: Low-grade intraepithelial neoplasias | ||
| Liver |  | HCC: Hepatocellular carcinoma |
| NAFLD: Non-alcoholic fatty liver disease | ||
| Thyroid | 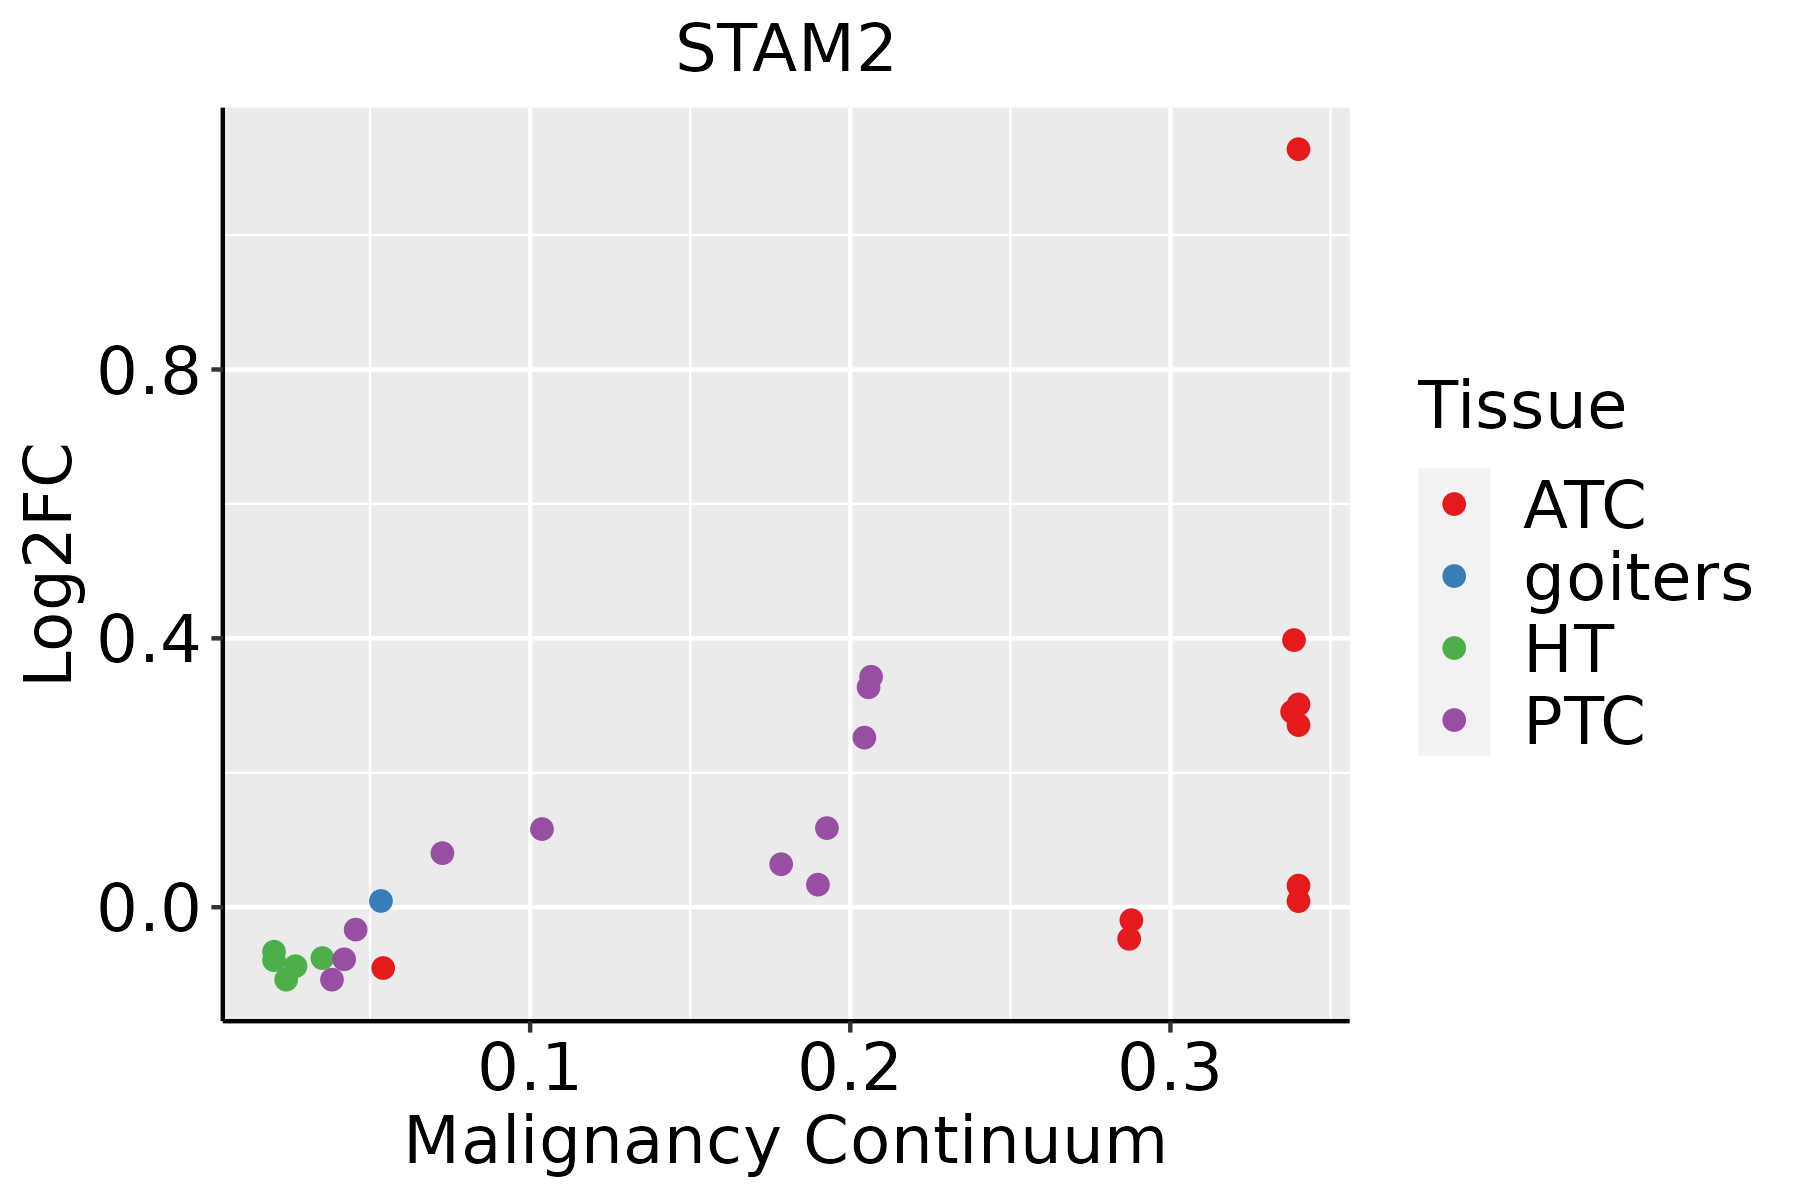 | ATC: Anaplastic thyroid cancer |
| HT: Hashimoto's thyroiditis | ||
| PTC: Papillary thyroid cancer |
| ∗log2FC in expression of this searched gene in stem-like cells from each diseased tissue sample relative to stem-like cells in normal samples in each tissue plotted against the malignancy continuum. Samples are colored based on if they are from different disease stage. |
Top |
Malignant transformation related pathway analysis |
| Find out the enriched GO biological processes and KEGG pathways involved in transition from healthy to precancer to cancer |
| Tissue | Disease Stage | Enriched GO biological Processes |
| Colorectum | AD |  |
| Colorectum | SER |  |
| Colorectum | MSS |  |
| Colorectum | MSI-H |  |
| Colorectum | FAP |  |
| ∗Top 15 enriched GO BP terms are showed in the bar plot of each disease state in each tissue. Each row represents a significant GO biological process which is colored according to the -log10(p.adjust). |
| Page: 1 2 3 4 5 6 7 8 9 |
| GO ID | Tissue | Disease Stage | Description | Gene Ratio | Bg Ratio | pvalue | p.adjust | Count |
| GO:001623617 | Esophagus | ESCC | macroautophagy | 216/8552 | 291/18723 | 1.94e-23 | 4.57e-21 | 216 |
| GO:001605014 | Esophagus | ESCC | vesicle organization | 211/8552 | 300/18723 | 2.85e-18 | 2.87e-16 | 211 |
| GO:003625714 | Esophagus | ESCC | multivesicular body organization | 30/8552 | 31/18723 | 1.04e-09 | 2.50e-08 | 30 |
| GO:003625814 | Esophagus | ESCC | multivesicular body assembly | 29/8552 | 30/18723 | 2.21e-09 | 4.99e-08 | 29 |
| GO:000703214 | Esophagus | ESCC | endosome organization | 61/8552 | 82/18723 | 1.13e-07 | 1.85e-06 | 61 |
| GO:00160505 | Liver | NAFLD | vesicle organization | 50/1882 | 300/18723 | 2.42e-04 | 4.06e-03 | 50 |
| GO:00162365 | Liver | NAFLD | macroautophagy | 45/1882 | 291/18723 | 2.31e-03 | 2.19e-02 | 45 |
| GO:001623621 | Liver | HCC | macroautophagy | 204/7958 | 291/18723 | 8.66e-22 | 1.41e-19 | 204 |
| GO:001605021 | Liver | HCC | vesicle organization | 194/7958 | 300/18723 | 5.58e-15 | 3.97e-13 | 194 |
| GO:000703211 | Liver | HCC | endosome organization | 61/7958 | 82/18723 | 4.36e-09 | 1.15e-07 | 61 |
| GO:003625711 | Liver | HCC | multivesicular body organization | 27/7958 | 31/18723 | 3.48e-07 | 5.97e-06 | 27 |
| GO:003625811 | Liver | HCC | multivesicular body assembly | 26/7958 | 30/18723 | 7.18e-07 | 1.12e-05 | 26 |
| GO:0016236110 | Thyroid | PTC | macroautophagy | 167/5968 | 291/18723 | 1.51e-19 | 1.91e-17 | 167 |
| GO:001605017 | Thyroid | PTC | vesicle organization | 163/5968 | 300/18723 | 4.74e-16 | 3.69e-14 | 163 |
| GO:00362579 | Thyroid | PTC | multivesicular body organization | 26/5968 | 31/18723 | 3.25e-09 | 8.76e-08 | 26 |
| GO:00362588 | Thyroid | PTC | multivesicular body assembly | 25/5968 | 30/18723 | 8.60e-09 | 2.10e-07 | 25 |
| GO:000703210 | Thyroid | PTC | endosome organization | 48/5968 | 82/18723 | 5.65e-07 | 9.04e-06 | 48 |
| GO:001623623 | Thyroid | ATC | macroautophagy | 169/6293 | 291/18723 | 6.56e-18 | 7.69e-16 | 169 |
| GO:001605023 | Thyroid | ATC | vesicle organization | 166/6293 | 300/18723 | 6.14e-15 | 3.92e-13 | 166 |
| GO:003625715 | Thyroid | ATC | multivesicular body organization | 25/6293 | 31/18723 | 1.01e-07 | 1.70e-06 | 25 |
| Page: 1 2 |
| Pathway ID | Tissue | Disease Stage | Description | Gene Ratio | Bg Ratio | pvalue | p.adjust | qvalue | Count |
| hsa04144210 | Esophagus | ESCC | Endocytosis | 186/4205 | 251/8465 | 9.74e-16 | 4.66e-14 | 2.39e-14 | 186 |
| hsa0414437 | Esophagus | ESCC | Endocytosis | 186/4205 | 251/8465 | 9.74e-16 | 4.66e-14 | 2.39e-14 | 186 |
| hsa0414422 | Liver | HCC | Endocytosis | 178/4020 | 251/8465 | 2.03e-14 | 5.22e-13 | 2.91e-13 | 178 |
| hsa0414432 | Liver | HCC | Endocytosis | 178/4020 | 251/8465 | 2.03e-14 | 5.22e-13 | 2.91e-13 | 178 |
| Page: 1 |
Top |
Cell-cell communication analysis |
| Identification of potential cell-cell interactions between two cell types and their ligand-receptor pairs for different disease states |
| Ligand | Receptor | LRpair | Pathway | Tissue | Disease Stage |
| Page: 1 |
Top |
Single-cell gene regulatory network inference analysis |
| Find out the significant the regulons (TFs) and the target genes of each regulon across cell types for different disease states |
| TF | Cell Type | Tissue | Disease Stage | Target Gene | RSS | Regulon Activity |
| ∗The dot plots of a searched regulon are shown for all cell subpopulations in each disease state of each tissue based on the regulon specific score inferred using pySCENIC and by calculating the average expression. |
| Page: 1 |
Top |
Somatic mutation of malignant transformation related genes |
| Annotation of somatic variants for genes involved in malignant transformation |
| Hugo Symbol | Variant Class | Variant Classification | dbSNP RS | HGVSc | HGVSp | HGVSp Short | SWISSPROT | BIOTYPE | SIFT | PolyPhen | Tumor Sample Barcode | Tissue | Histology | Sex | Age | Stage | Therapy Types | Drugs | Outcome |
| STAM2 | SNV | Missense_Mutation | c.1213A>G | p.Met405Val | p.M405V | O75886 | protein_coding | tolerated(0.2) | benign(0) | TCGA-A8-A08J-01 | Breast | breast invasive carcinoma | Female | <65 | III/IV | Unknown | Unknown | PD | |
| STAM2 | SNV | Missense_Mutation | novel | c.849N>T | p.Lys283Asn | p.K283N | O75886 | protein_coding | tolerated(0.48) | benign(0.058) | TCGA-AN-A046-01 | Breast | breast invasive carcinoma | Female | >=65 | I/II | Unknown | Unknown | SD |
| STAM2 | SNV | Missense_Mutation | novel | c.28N>A | p.Glu10Lys | p.E10K | O75886 | protein_coding | deleterious(0.02) | benign(0.138) | TCGA-AR-A24Q-01 | Breast | breast invasive carcinoma | Female | <65 | I/II | Chemotherapy | doxorubicin | SD |
| STAM2 | SNV | Missense_Mutation | c.996N>A | p.Met332Ile | p.M332I | O75886 | protein_coding | tolerated(0.05) | benign(0.011) | TCGA-BH-A0DO-01 | Breast | breast invasive carcinoma | Female | >=65 | I/II | Unknown | Unknown | SD | |
| STAM2 | SNV | Missense_Mutation | c.528N>T | p.Leu176Phe | p.L176F | O75886 | protein_coding | deleterious(0.02) | probably_damaging(0.942) | TCGA-E9-A244-01 | Breast | breast invasive carcinoma | Female | <65 | I/II | Chemotherapy | cyclophosphamide | SD | |
| STAM2 | insertion | Frame_Shift_Ins | novel | c.1272_1273insTTCTCTT | p.Ile425PhefsTer45 | p.I425Ffs*45 | O75886 | protein_coding | TCGA-A8-A07U-01 | Breast | breast invasive carcinoma | Female | >=65 | III/IV | Chemotherapy | 5-fluorouracil | SD | ||
| STAM2 | insertion | Frame_Shift_Ins | novel | c.1270_1271insTATGGAGAAAAAACTGGTGTAGTTTTGAAACT | p.Gln424LeufsTer16 | p.Q424Lfs*16 | O75886 | protein_coding | TCGA-A8-A07U-01 | Breast | breast invasive carcinoma | Female | >=65 | III/IV | Chemotherapy | 5-fluorouracil | SD | ||
| STAM2 | SNV | Missense_Mutation | novel | c.230N>A | p.Gly77Glu | p.G77E | O75886 | protein_coding | deleterious(0) | probably_damaging(0.997) | TCGA-VS-A94Z-01 | Cervix | cervical & endocervical cancer | Female | <65 | I/II | Chemotherapy | cisplatin | CR |
| STAM2 | deletion | Frame_Shift_Del | novel | c.949delC | p.Gln317LysfsTer6 | p.Q317Kfs*6 | O75886 | protein_coding | TCGA-2W-A8YY-01 | Cervix | cervical & endocervical cancer | Female | <65 | I/II | Chemotherapy | cisplatin | CR | ||
| STAM2 | SNV | Missense_Mutation | c.628T>G | p.Leu210Val | p.L210V | O75886 | protein_coding | deleterious(0.03) | possibly_damaging(0.85) | TCGA-AA-3984-01 | Colorectum | colon adenocarcinoma | Female | <65 | I/II | Unknown | Unknown | SD |
| Page: 1 2 3 4 5 |
Top |
Related drugs of malignant transformation related genes |
| Identification of chemicals and drugs interact with genes involved in malignant transfromation |
| (DGIdb 4.0) |
| Entrez ID | Symbol | Category | Interaction Types | Drug Claim Name | Drug Name | PMIDs |
| Page: 1 |

Copyright 2023-Present -The University of Texas Health Science Center at Houston |