
|
|||||
|
 | |
| |
| |
| |
| |
| |
|
Gene: STAG1 |
Gene summary for STAG1 |
| Gene information | Species | Human | Gene symbol | STAG1 | Gene ID | 10274 |
| Gene name | stromal antigen 1 | |
| Gene Alias | MRD47 | |
| Cytomap | 3q22.3 | |
| Gene Type | protein-coding | GO ID | GO:0000226 | UniProtAcc | Q4LE48 |
Top |
Malignant transformation analysis |
| Identification of the aberrant gene expression in precancerous and cancerous lesions by comparing the gene expression of stem-like cells in diseased tissues with normal stem cells |
| Entrez ID | Symbol | Replicates | Species | Organ | Tissue | Adj P-value | Log2FC | Malignancy |
| 10274 | STAG1 | CCI_1 | Human | Cervix | CC | 1.46e-25 | 2.23e+00 | 0.528 |
| 10274 | STAG1 | CCI_2 | Human | Cervix | CC | 2.36e-21 | 2.61e+00 | 0.5249 |
| 10274 | STAG1 | CCI_3 | Human | Cervix | CC | 3.81e-40 | 2.26e+00 | 0.516 |
| 10274 | STAG1 | CCII_1 | Human | Cervix | CC | 8.18e-15 | 8.18e-01 | 0.3249 |
| 10274 | STAG1 | HTA11_3410_2000001011 | Human | Colorectum | AD | 2.23e-09 | -5.16e-01 | 0.0155 |
| 10274 | STAG1 | HTA11_347_2000001011 | Human | Colorectum | AD | 5.97e-06 | 5.34e-01 | -0.1954 |
| 10274 | STAG1 | HTA11_6801_2000001011 | Human | Colorectum | SER | 3.63e-02 | -4.82e-01 | 0.0171 |
| 10274 | STAG1 | HTA11_7696_3000711011 | Human | Colorectum | AD | 2.67e-03 | -3.38e-01 | 0.0674 |
| 10274 | STAG1 | HTA11_99999965062_69753 | Human | Colorectum | MSI-H | 1.21e-07 | 8.69e-01 | 0.3487 |
| 10274 | STAG1 | HTA11_99999971662_82457 | Human | Colorectum | MSS | 1.30e-02 | -2.58e-01 | 0.3859 |
| 10274 | STAG1 | HTA11_99999974143_84620 | Human | Colorectum | MSS | 8.75e-08 | -4.58e-01 | 0.3005 |
| 10274 | STAG1 | F007 | Human | Colorectum | FAP | 8.14e-04 | -3.39e-01 | 0.1176 |
| 10274 | STAG1 | A001-C-207 | Human | Colorectum | FAP | 3.46e-03 | -2.92e-01 | 0.1278 |
| 10274 | STAG1 | A015-C-203 | Human | Colorectum | FAP | 4.68e-33 | -2.48e-01 | -0.1294 |
| 10274 | STAG1 | A015-C-204 | Human | Colorectum | FAP | 4.13e-07 | -2.95e-01 | -0.0228 |
| 10274 | STAG1 | A014-C-040 | Human | Colorectum | FAP | 9.05e-05 | -4.03e-01 | -0.1184 |
| 10274 | STAG1 | A002-C-201 | Human | Colorectum | FAP | 1.30e-13 | -3.00e-01 | 0.0324 |
| 10274 | STAG1 | A001-C-119 | Human | Colorectum | FAP | 3.01e-05 | -3.96e-02 | -0.1557 |
| 10274 | STAG1 | A001-C-108 | Human | Colorectum | FAP | 5.50e-19 | -1.05e-01 | -0.0272 |
| 10274 | STAG1 | A002-C-205 | Human | Colorectum | FAP | 1.44e-24 | -3.07e-01 | -0.1236 |
| Page: 1 2 3 4 5 6 7 8 9 10 11 |
| Tissue | Expression Dynamics | Abbreviation |
| Cervix |  | CC: Cervix cancer |
| HSIL_HPV: HPV-infected high-grade squamous intraepithelial lesions | ||
| N_HPV: HPV-infected normal cervix | ||
| Colorectum (GSE201348) |  | FAP: Familial adenomatous polyposis |
| CRC: Colorectal cancer | ||
| Colorectum (HTA11) |  | AD: Adenomas |
| SER: Sessile serrated lesions | ||
| MSI-H: Microsatellite-high colorectal cancer | ||
| MSS: Microsatellite stable colorectal cancer | ||
| Endometrium |  | AEH: Atypical endometrial hyperplasia |
| EEC: Endometrioid Cancer | ||
| Esophagus |  | ESCC: Esophageal squamous cell carcinoma |
| HGIN: High-grade intraepithelial neoplasias | ||
| LGIN: Low-grade intraepithelial neoplasias | ||
| Liver |  | HCC: Hepatocellular carcinoma |
| NAFLD: Non-alcoholic fatty liver disease | ||
| Lung |  | AAH: Atypical adenomatous hyperplasia |
| AIS: Adenocarcinoma in situ | ||
| IAC: Invasive lung adenocarcinoma | ||
| MIA: Minimally invasive adenocarcinoma | ||
| Oral Cavity |  | EOLP: Erosive Oral lichen planus |
| LP: leukoplakia | ||
| NEOLP: Non-erosive oral lichen planus | ||
| OSCC: Oral squamous cell carcinoma | ||
| Prostate | 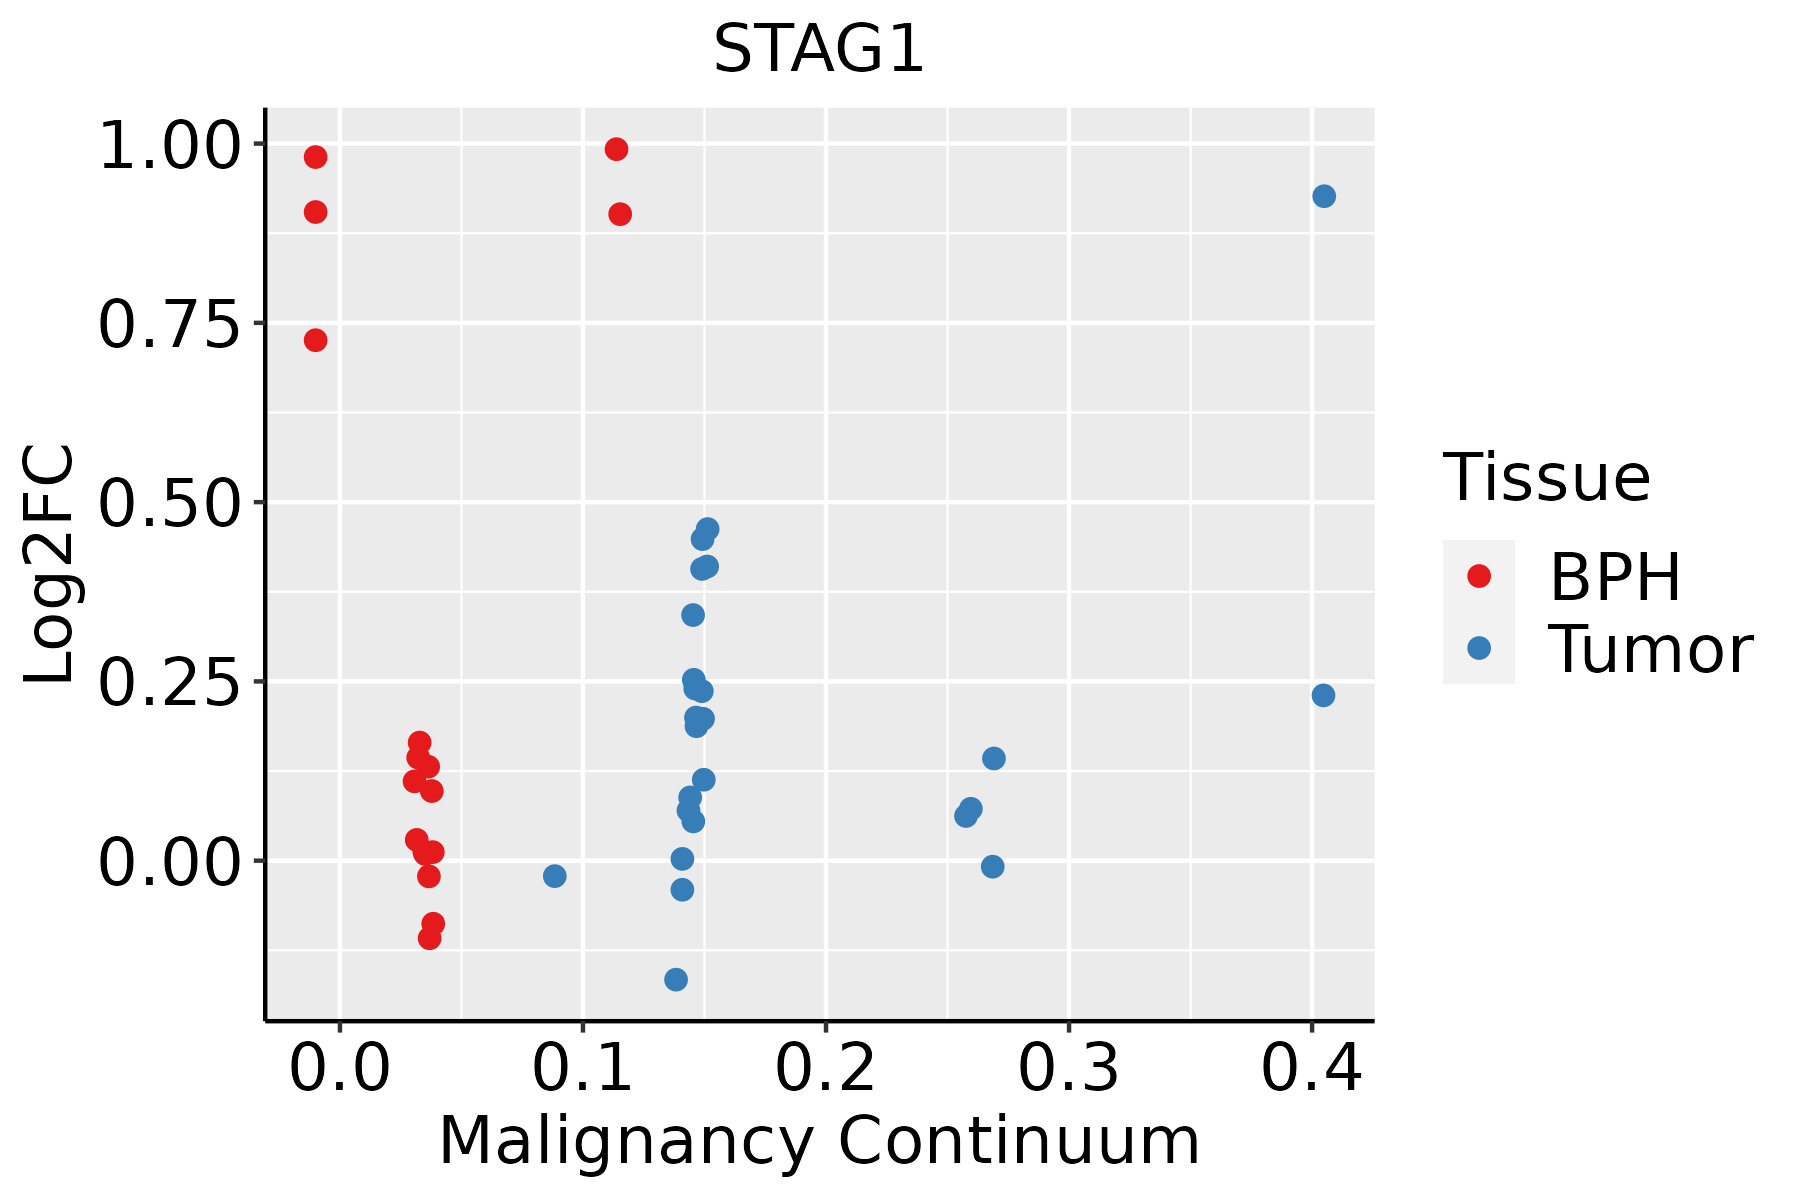 | BPH: Benign Prostatic Hyperplasia |
| Skin |  | AK: Actinic keratosis |
| cSCC: Cutaneous squamous cell carcinoma | ||
| SCCIS:squamous cell carcinoma in situ | ||
| Thyroid |  | ATC: Anaplastic thyroid cancer |
| HT: Hashimoto's thyroiditis | ||
| PTC: Papillary thyroid cancer |
| ∗log2FC in expression of this searched gene in stem-like cells from each diseased tissue sample relative to stem-like cells in normal samples in each tissue plotted against the malignancy continuum. Samples are colored based on if they are from different disease stage. |
Top |
Malignant transformation related pathway analysis |
| Find out the enriched GO biological processes and KEGG pathways involved in transition from healthy to precancer to cancer |
| Tissue | Disease Stage | Enriched GO biological Processes |
| Colorectum | AD |  |
| Colorectum | SER |  |
| Colorectum | MSS |  |
| Colorectum | MSI-H |  |
| Colorectum | FAP |  |
| ∗Top 15 enriched GO BP terms are showed in the bar plot of each disease state in each tissue. Each row represents a significant GO biological process which is colored according to the -log10(p.adjust). |
| Page: 1 2 3 4 5 6 7 8 9 |
| GO ID | Tissue | Disease Stage | Description | Gene Ratio | Bg Ratio | pvalue | p.adjust | Count |
| GO:01400143 | Cervix | CC | mitotic nuclear division | 50/2311 | 287/18723 | 7.27e-03 | 3.91e-02 | 50 |
| GO:00070625 | Cervix | CC | sister chromatid cohesion | 15/2311 | 62/18723 | 7.30e-03 | 3.92e-02 | 15 |
| GO:00482851 | Cervix | CC | organelle fission | 78/2311 | 488/18723 | 9.70e-03 | 4.79e-02 | 78 |
| GO:0007051 | Colorectum | AD | spindle organization | 58/3918 | 184/18723 | 4.71e-04 | 5.20e-03 | 58 |
| GO:1902850 | Colorectum | AD | microtubule cytoskeleton organization involved in mitosis | 48/3918 | 147/18723 | 5.87e-04 | 6.21e-03 | 48 |
| GO:0090307 | Colorectum | AD | mitotic spindle assembly | 25/3918 | 65/18723 | 9.12e-04 | 8.71e-03 | 25 |
| GO:0007052 | Colorectum | AD | mitotic spindle organization | 40/3918 | 120/18723 | 1.03e-03 | 9.61e-03 | 40 |
| GO:0007062 | Colorectum | AD | sister chromatid cohesion | 23/3918 | 62/18723 | 2.51e-03 | 1.92e-02 | 23 |
| GO:0051225 | Colorectum | AD | spindle assembly | 37/3918 | 117/18723 | 4.32e-03 | 2.96e-02 | 37 |
| GO:0140014 | Colorectum | AD | mitotic nuclear division | 78/3918 | 287/18723 | 6.48e-03 | 4.05e-02 | 78 |
| GO:00070511 | Colorectum | MSS | spindle organization | 53/3467 | 184/18723 | 4.23e-04 | 5.19e-03 | 53 |
| GO:19028501 | Colorectum | MSS | microtubule cytoskeleton organization involved in mitosis | 44/3467 | 147/18723 | 5.17e-04 | 5.98e-03 | 44 |
| GO:00070521 | Colorectum | MSS | mitotic spindle organization | 36/3467 | 120/18723 | 1.52e-03 | 1.39e-02 | 36 |
| GO:00903071 | Colorectum | MSS | mitotic spindle assembly | 22/3467 | 65/18723 | 2.33e-03 | 1.90e-02 | 22 |
| GO:00070621 | Colorectum | MSS | sister chromatid cohesion | 20/3467 | 62/18723 | 6.63e-03 | 4.38e-02 | 20 |
| GO:00512251 | Colorectum | MSS | spindle assembly | 33/3467 | 117/18723 | 6.68e-03 | 4.38e-02 | 33 |
| GO:01400141 | Colorectum | MSS | mitotic nuclear division | 70/3467 | 287/18723 | 7.48e-03 | 4.72e-02 | 70 |
| GO:00070512 | Colorectum | FAP | spindle organization | 41/2622 | 184/18723 | 1.50e-03 | 1.34e-02 | 41 |
| GO:00070622 | Colorectum | FAP | sister chromatid cohesion | 18/2622 | 62/18723 | 1.60e-03 | 1.42e-02 | 18 |
| GO:00070623 | Colorectum | CRC | sister chromatid cohesion | 16/2078 | 62/18723 | 9.40e-04 | 1.15e-02 | 16 |
| Page: 1 2 3 4 5 6 7 |
| Pathway ID | Tissue | Disease Stage | Description | Gene Ratio | Bg Ratio | pvalue | p.adjust | qvalue | Count |
| hsa041106 | Cervix | CC | Cell cycle | 36/1267 | 157/8465 | 4.94e-03 | 1.67e-02 | 9.86e-03 | 36 |
| hsa0411013 | Cervix | CC | Cell cycle | 36/1267 | 157/8465 | 4.94e-03 | 1.67e-02 | 9.86e-03 | 36 |
| hsa04110 | Colorectum | FAP | Cell cycle | 37/1404 | 157/8465 | 1.44e-02 | 4.77e-02 | 2.90e-02 | 37 |
| hsa041101 | Colorectum | FAP | Cell cycle | 37/1404 | 157/8465 | 1.44e-02 | 4.77e-02 | 2.90e-02 | 37 |
| hsa0411023 | Esophagus | ESCC | Cell cycle | 126/4205 | 157/8465 | 1.34e-15 | 5.60e-14 | 2.87e-14 | 126 |
| hsa0411033 | Esophagus | ESCC | Cell cycle | 126/4205 | 157/8465 | 1.34e-15 | 5.60e-14 | 2.87e-14 | 126 |
| hsa041104 | Liver | Cirrhotic | Cell cycle | 61/2530 | 157/8465 | 9.53e-03 | 3.21e-02 | 1.98e-02 | 61 |
| hsa0411011 | Liver | Cirrhotic | Cell cycle | 61/2530 | 157/8465 | 9.53e-03 | 3.21e-02 | 1.98e-02 | 61 |
| hsa041102 | Liver | HCC | Cell cycle | 106/4020 | 157/8465 | 2.54e-07 | 3.04e-06 | 1.69e-06 | 106 |
| hsa041103 | Liver | HCC | Cell cycle | 106/4020 | 157/8465 | 2.54e-07 | 3.04e-06 | 1.69e-06 | 106 |
| hsa041105 | Lung | IAC | Cell cycle | 30/1053 | 157/8465 | 1.03e-02 | 3.83e-02 | 2.54e-02 | 30 |
| hsa0411012 | Lung | IAC | Cell cycle | 30/1053 | 157/8465 | 1.03e-02 | 3.83e-02 | 2.54e-02 | 30 |
| hsa041108 | Oral cavity | OSCC | Cell cycle | 118/3704 | 157/8465 | 7.15e-16 | 2.66e-14 | 1.35e-14 | 118 |
| hsa0411015 | Oral cavity | OSCC | Cell cycle | 118/3704 | 157/8465 | 7.15e-16 | 2.66e-14 | 1.35e-14 | 118 |
| hsa0411041 | Oral cavity | EOLP | Cell cycle | 42/1218 | 157/8465 | 3.20e-05 | 1.61e-04 | 9.52e-05 | 42 |
| hsa0411051 | Oral cavity | EOLP | Cell cycle | 42/1218 | 157/8465 | 3.20e-05 | 1.61e-04 | 9.52e-05 | 42 |
| hsa0411061 | Oral cavity | NEOLP | Cell cycle | 37/1112 | 157/8465 | 2.29e-04 | 1.58e-03 | 9.95e-04 | 37 |
| hsa0411071 | Oral cavity | NEOLP | Cell cycle | 37/1112 | 157/8465 | 2.29e-04 | 1.58e-03 | 9.95e-04 | 37 |
| hsa0411021 | Prostate | Tumor | Cell cycle | 51/1791 | 157/8465 | 5.67e-04 | 2.89e-03 | 1.79e-03 | 51 |
| hsa0411031 | Prostate | Tumor | Cell cycle | 51/1791 | 157/8465 | 5.67e-04 | 2.89e-03 | 1.79e-03 | 51 |
| Page: 1 |
Top |
Cell-cell communication analysis |
| Identification of potential cell-cell interactions between two cell types and their ligand-receptor pairs for different disease states |
| Ligand | Receptor | LRpair | Pathway | Tissue | Disease Stage |
| Page: 1 |
Top |
Single-cell gene regulatory network inference analysis |
| Find out the significant the regulons (TFs) and the target genes of each regulon across cell types for different disease states |
| TF | Cell Type | Tissue | Disease Stage | Target Gene | RSS | Regulon Activity |
| ∗The dot plots of a searched regulon are shown for all cell subpopulations in each disease state of each tissue based on the regulon specific score inferred using pySCENIC and by calculating the average expression. |
| Page: 1 |
Top |
Somatic mutation of malignant transformation related genes |
| Annotation of somatic variants for genes involved in malignant transformation |
| Hugo Symbol | Variant Class | Variant Classification | dbSNP RS | HGVSc | HGVSp | HGVSp Short | SWISSPROT | BIOTYPE | SIFT | PolyPhen | Tumor Sample Barcode | Tissue | Histology | Sex | Age | Stage | Therapy Types | Drugs | Outcome |
| STAG1 | SNV | Missense_Mutation | novel | c.1345N>C | p.Glu449Gln | p.E449Q | Q8WVM7 | protein_coding | tolerated(0.25) | benign(0.009) | TCGA-A2-A4RX-01 | Breast | breast invasive carcinoma | Female | >=65 | I/II | Unknown | Unknown | SD |
| STAG1 | SNV | Missense_Mutation | novel | c.3643N>A | p.Glu1215Lys | p.E1215K | Q8WVM7 | protein_coding | tolerated_low_confidence(0.17) | possibly_damaging(0.515) | TCGA-A7-A4SF-01 | Breast | breast invasive carcinoma | Female | <65 | I/II | Chemotherapy | carboplatin | CR |
| STAG1 | SNV | Missense_Mutation | c.3427N>A | p.Glu1143Lys | p.E1143K | Q8WVM7 | protein_coding | tolerated_low_confidence(0.13) | benign(0.138) | TCGA-AC-A23H-01 | Breast | breast invasive carcinoma | Female | >=65 | I/II | Unknown | Unknown | PD | |
| STAG1 | SNV | Missense_Mutation | c.3319N>G | p.Gln1107Glu | p.Q1107E | Q8WVM7 | protein_coding | tolerated(0.2) | benign(0.098) | TCGA-AC-A23H-01 | Breast | breast invasive carcinoma | Female | >=65 | I/II | Unknown | Unknown | PD | |
| STAG1 | SNV | Missense_Mutation | novel | c.1931N>A | p.Cys644Tyr | p.C644Y | Q8WVM7 | protein_coding | deleterious(0.01) | probably_damaging(0.971) | TCGA-AN-A046-01 | Breast | breast invasive carcinoma | Female | >=65 | I/II | Unknown | Unknown | SD |
| STAG1 | SNV | Missense_Mutation | novel | c.1711N>G | p.Phe571Val | p.F571V | Q8WVM7 | protein_coding | deleterious(0) | possibly_damaging(0.616) | TCGA-AN-A046-01 | Breast | breast invasive carcinoma | Female | >=65 | I/II | Unknown | Unknown | SD |
| STAG1 | SNV | Missense_Mutation | novel | c.961N>G | p.Met321Val | p.M321V | Q8WVM7 | protein_coding | tolerated(0.27) | benign(0.007) | TCGA-AN-A046-01 | Breast | breast invasive carcinoma | Female | >=65 | I/II | Unknown | Unknown | SD |
| STAG1 | SNV | Missense_Mutation | c.2822A>T | p.Asn941Ile | p.N941I | Q8WVM7 | protein_coding | tolerated(0.12) | benign(0.284) | TCGA-AN-A0XU-01 | Breast | breast invasive carcinoma | Female | <65 | I/II | Unknown | Unknown | SD | |
| STAG1 | SNV | Missense_Mutation | novel | c.1687N>A | p.Asp563Asn | p.D563N | Q8WVM7 | protein_coding | deleterious(0) | probably_damaging(0.918) | TCGA-B6-A0WZ-01 | Breast | breast invasive carcinoma | Female | <65 | I/II | Unknown | Unknown | PD |
| STAG1 | SNV | Missense_Mutation | c.2110N>C | p.Ala704Pro | p.A704P | Q8WVM7 | protein_coding | deleterious(0) | possibly_damaging(0.707) | TCGA-BH-A0BC-01 | Breast | breast invasive carcinoma | Female | <65 | III/IV | Chemotherapy | doxorubicin | SD |
| Page: 1 2 3 4 5 6 7 8 9 10 11 12 13 14 15 16 17 |
Top |
Related drugs of malignant transformation related genes |
| Identification of chemicals and drugs interact with genes involved in malignant transfromation |
| (DGIdb 4.0) |
| Entrez ID | Symbol | Category | Interaction Types | Drug Claim Name | Drug Name | PMIDs |
| Page: 1 |

Copyright 2023-Present -The University of Texas Health Science Center at Houston |