
|
|||||
|
 | |
| |
| |
| |
| |
| |
|
Gene: ST8SIA6-AS1 |
Gene summary for ST8SIA6-AS1 |
| Gene information | Species | Human | Gene symbol | ST8SIA6-AS1 | Gene ID | 100128098 |
| Gene name | ST8SIA6 antisense RNA 1 | |
| Gene Alias | APAL | |
| Cytomap | 10p12.33 | |
| Gene Type | ncRNA | GO ID | NA | UniProtAcc | NA |
Top |
Malignant transformation analysis |
| Identification of the aberrant gene expression in precancerous and cancerous lesions by comparing the gene expression of stem-like cells in diseased tissues with normal stem cells |
| Entrez ID | Symbol | Replicates | Species | Organ | Tissue | Adj P-value | Log2FC | Malignancy |
| 100128098 | ST8SIA6-AS1 | GSM4909289 | Human | Breast | IDC | 1.06e-06 | 3.73e-01 | 0.1064 |
| 100128098 | ST8SIA6-AS1 | GSM4909291 | Human | Breast | IDC | 6.21e-05 | 1.85e-01 | 0.1753 |
| 100128098 | ST8SIA6-AS1 | GSM4909292 | Human | Breast | IDC | 1.47e-03 | 2.92e-01 | 0.1236 |
| 100128098 | ST8SIA6-AS1 | GSM4909293 | Human | Breast | IDC | 1.97e-38 | 5.76e-01 | 0.1581 |
| 100128098 | ST8SIA6-AS1 | GSM4909294 | Human | Breast | IDC | 4.47e-24 | 5.43e-01 | 0.2022 |
| 100128098 | ST8SIA6-AS1 | GSM4909298 | Human | Breast | IDC | 1.23e-14 | 2.50e-01 | 0.1551 |
| 100128098 | ST8SIA6-AS1 | GSM4909311 | Human | Breast | IDC | 1.48e-02 | 2.15e-01 | 0.1534 |
| 100128098 | ST8SIA6-AS1 | GSM4909312 | Human | Breast | IDC | 7.71e-11 | 2.91e-01 | 0.1552 |
| 100128098 | ST8SIA6-AS1 | GSM4909317 | Human | Breast | IDC | 1.20e-15 | 2.81e-01 | 0.1355 |
| 100128098 | ST8SIA6-AS1 | GSM4909318 | Human | Breast | IDC | 9.55e-04 | 3.53e-01 | 0.2031 |
| 100128098 | ST8SIA6-AS1 | P2 | Human | Breast | IDC | 8.03e-06 | 2.42e-01 | 0.21 |
| 100128098 | ST8SIA6-AS1 | HCC2 | Human | Liver | HCC | 2.91e-02 | 1.99e+00 | 0.5341 |
| 100128098 | ST8SIA6-AS1 | Pt14.b | Human | Liver | HCC | 6.81e-05 | 1.83e-01 | 0.018 |
| 100128098 | ST8SIA6-AS1 | S014 | Human | Liver | HCC | 5.28e-50 | 1.13e+00 | 0.2254 |
| 100128098 | ST8SIA6-AS1 | S015 | Human | Liver | HCC | 3.28e-44 | 1.70e+00 | 0.2375 |
| 100128098 | ST8SIA6-AS1 | S016 | Human | Liver | HCC | 4.91e-57 | 1.38e+00 | 0.2243 |
| 100128098 | ST8SIA6-AS1 | S028 | Human | Liver | HCC | 2.06e-02 | 1.35e-01 | 0.2503 |
| 100128098 | ST8SIA6-AS1 | S029 | Human | Liver | HCC | 1.62e-03 | 1.65e-01 | 0.2581 |
| Page: 1 |
| Tissue | Expression Dynamics | Abbreviation |
| Breast | 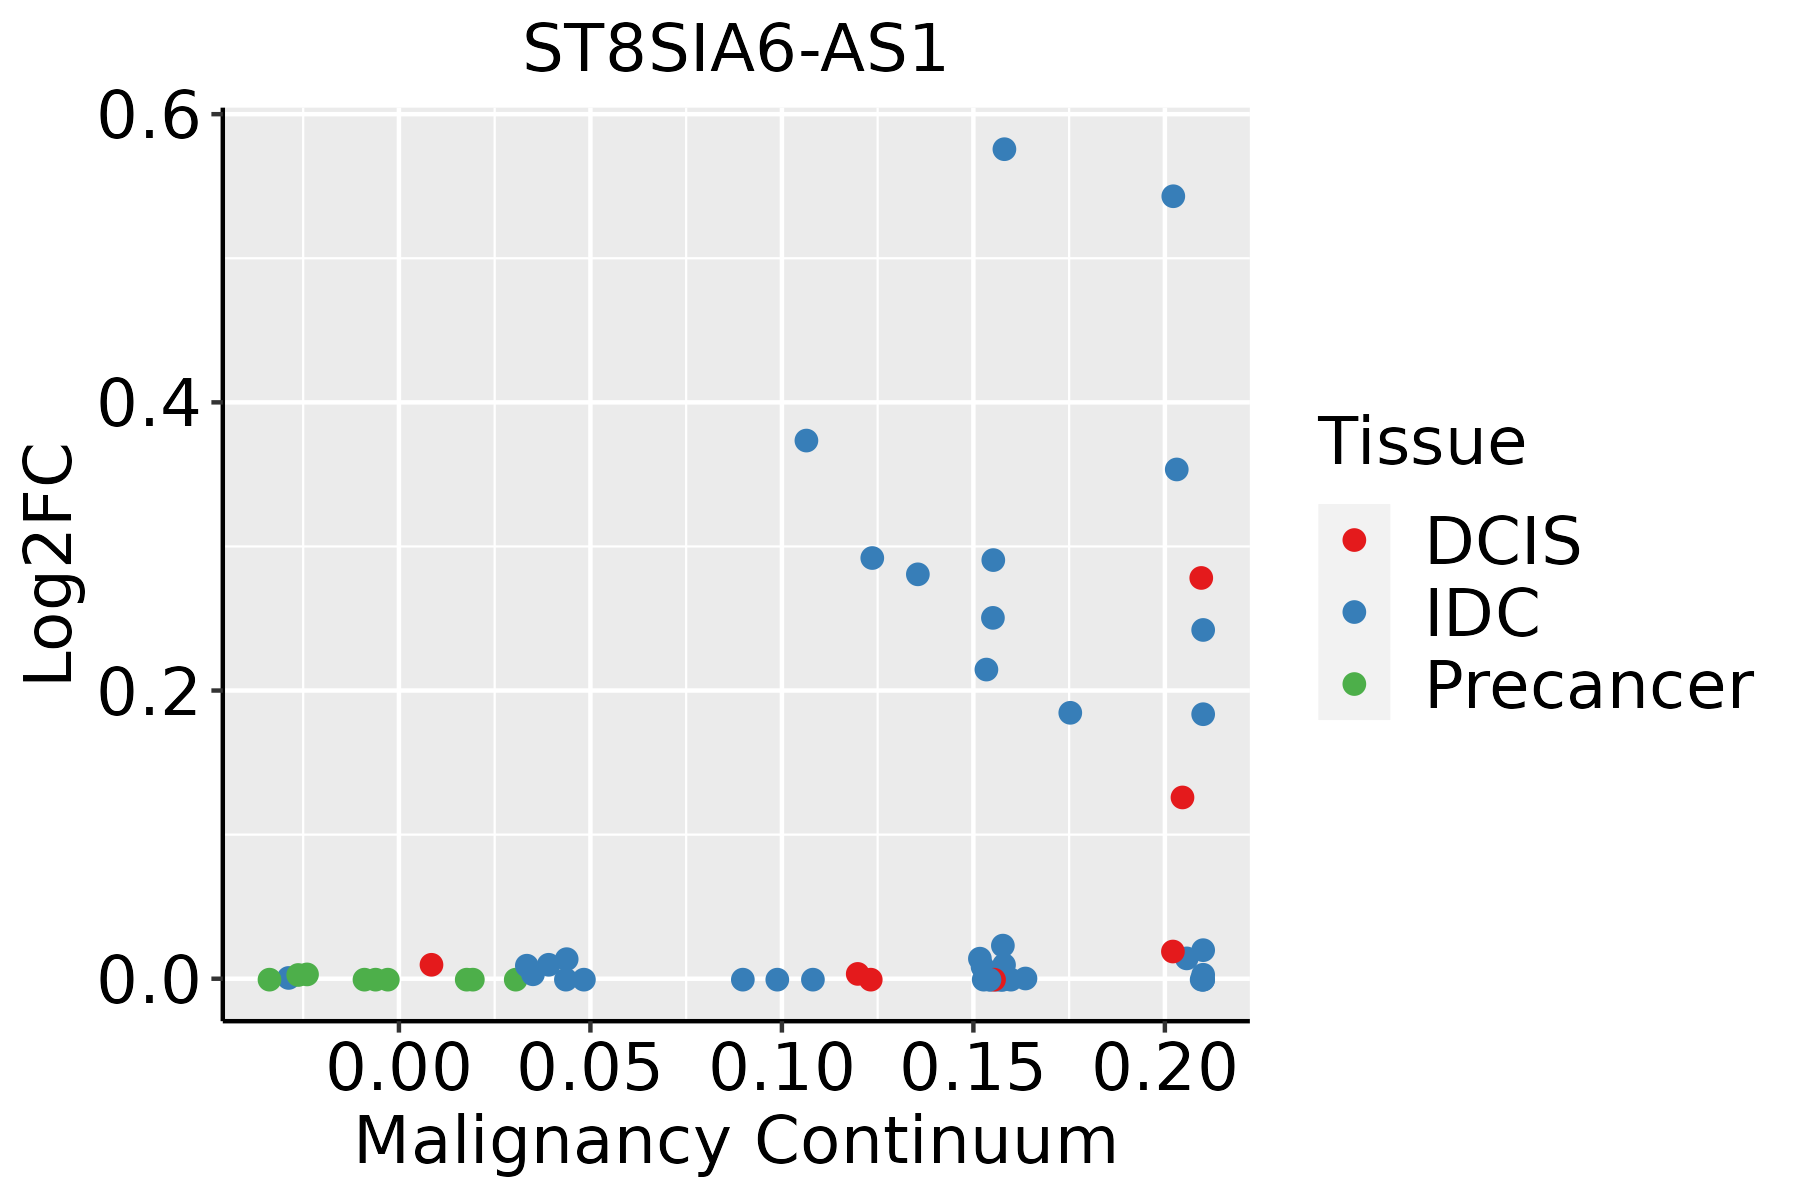 | IDC: Invasive ductal carcinoma |
| DCIS: Ductal carcinoma in situ | ||
| Precancer(BRCA1-mut): Precancerous lesion from BRCA1 mutation carriers | ||
| Liver |  | HCC: Hepatocellular carcinoma |
| NAFLD: Non-alcoholic fatty liver disease |
| ∗log2FC in expression of this searched gene in stem-like cells from each diseased tissue sample relative to stem-like cells in normal samples in each tissue plotted against the malignancy continuum. Samples are colored based on if they are from different disease stage. |
Top |
Malignant transformation related pathway analysis |
| Find out the enriched GO biological processes and KEGG pathways involved in transition from healthy to precancer to cancer |
| Tissue | Disease Stage | Enriched GO biological Processes |
| Colorectum | AD |  |
| Colorectum | SER |  |
| Colorectum | MSS |  |
| Colorectum | MSI-H |  |
| Colorectum | FAP |  |
| ∗Top 15 enriched GO BP terms are showed in the bar plot of each disease state in each tissue. Each row represents a significant GO biological process which is colored according to the -log10(p.adjust). |
| Page: 1 2 3 4 5 6 7 8 9 |
| GO ID | Tissue | Disease Stage | Description | Gene Ratio | Bg Ratio | pvalue | p.adjust | Count |
| Page: 1 |
| Pathway ID | Tissue | Disease Stage | Description | Gene Ratio | Bg Ratio | pvalue | p.adjust | qvalue | Count |
| Page: 1 |
Top |
Cell-cell communication analysis |
| Identification of potential cell-cell interactions between two cell types and their ligand-receptor pairs for different disease states |
| Ligand | Receptor | LRpair | Pathway | Tissue | Disease Stage |
| Page: 1 |
Top |
Single-cell gene regulatory network inference analysis |
| Find out the significant the regulons (TFs) and the target genes of each regulon across cell types for different disease states |
| TF | Cell Type | Tissue | Disease Stage | Target Gene | RSS | Regulon Activity |
| ∗The dot plots of a searched regulon are shown for all cell subpopulations in each disease state of each tissue based on the regulon specific score inferred using pySCENIC and by calculating the average expression. |
| Page: 1 |
Top |
Somatic mutation of malignant transformation related genes |
| Annotation of somatic variants for genes involved in malignant transformation |
| Hugo Symbol | Variant Class | Variant Classification | dbSNP RS | HGVSc | HGVSp | HGVSp Short | SWISSPROT | BIOTYPE | SIFT | PolyPhen | Tumor Sample Barcode | Tissue | Histology | Sex | Age | Stage | Therapy Types | Drugs | Outcome |
| Page: 1 |
Top |
Related drugs of malignant transformation related genes |
| Identification of chemicals and drugs interact with genes involved in malignant transfromation |
| (DGIdb 4.0) |
| Entrez ID | Symbol | Category | Interaction Types | Drug Claim Name | Drug Name | PMIDs |
| Page: 1 |

Copyright 2023-Present -The University of Texas Health Science Center at Houston |