
|
|||||
|
 | |
| |
| |
| |
| |
| |
|
Gene: ST8SIA3 |
Gene summary for ST8SIA3 |
| Gene information | Species | Human | Gene symbol | ST8SIA3 | Gene ID | 51046 |
| Gene name | ST8 alpha-N-acetyl-neuraminide alpha-2,8-sialyltransferase 3 | |
| Gene Alias | SIAT8C | |
| Cytomap | 18q21.31 | |
| Gene Type | protein-coding | GO ID | GO:0001573 | UniProtAcc | O43173 |
Top |
Malignant transformation analysis |
| Identification of the aberrant gene expression in precancerous and cancerous lesions by comparing the gene expression of stem-like cells in diseased tissues with normal stem cells |
| Entrez ID | Symbol | Replicates | Species | Organ | Tissue | Adj P-value | Log2FC | Malignancy |
| 51046 | ST8SIA3 | S014 | Human | Liver | HCC | 3.32e-18 | 7.62e-01 | 0.2254 |
| 51046 | ST8SIA3 | S015 | Human | Liver | HCC | 2.71e-28 | 1.07e+00 | 0.2375 |
| 51046 | ST8SIA3 | S016 | Human | Liver | HCC | 7.18e-31 | 8.16e-01 | 0.2243 |
| Page: 1 |
| Tissue | Expression Dynamics | Abbreviation |
| Liver | 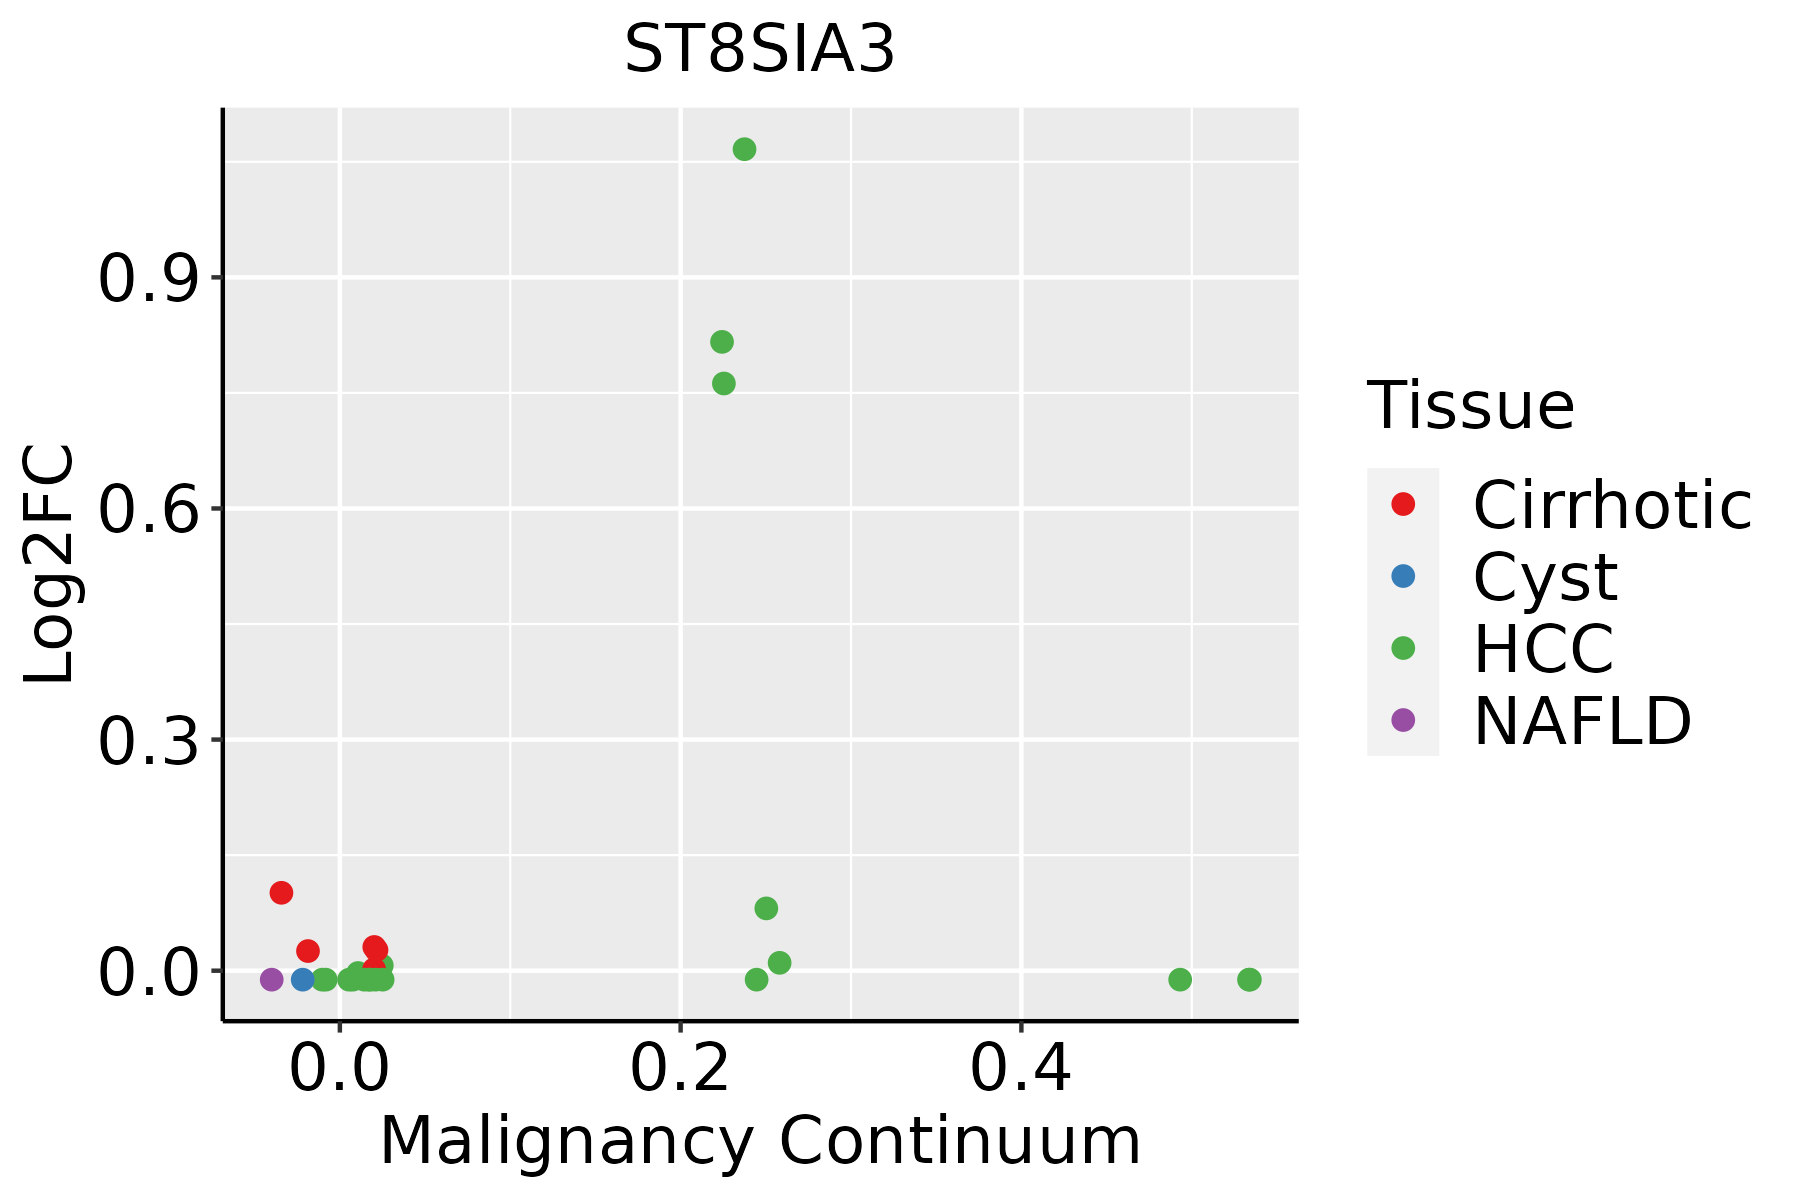 | HCC: Hepatocellular carcinoma |
| NAFLD: Non-alcoholic fatty liver disease |
| ∗log2FC in expression of this searched gene in stem-like cells from each diseased tissue sample relative to stem-like cells in normal samples in each tissue plotted against the malignancy continuum. Samples are colored based on if they are from different disease stage. |
Top |
Malignant transformation related pathway analysis |
| Find out the enriched GO biological processes and KEGG pathways involved in transition from healthy to precancer to cancer |
| Tissue | Disease Stage | Enriched GO biological Processes |
| Colorectum | AD |  |
| Colorectum | SER |  |
| Colorectum | MSS |  |
| Colorectum | MSI-H |  |
| Colorectum | FAP |  |
| ∗Top 15 enriched GO BP terms are showed in the bar plot of each disease state in each tissue. Each row represents a significant GO biological process which is colored according to the -log10(p.adjust). |
| Page: 1 2 3 4 5 6 7 8 9 |
| GO ID | Tissue | Disease Stage | Description | Gene Ratio | Bg Ratio | pvalue | p.adjust | Count |
| GO:00066431 | Liver | HCC | membrane lipid metabolic process | 115/7958 | 203/18723 | 3.17e-05 | 3.22e-04 | 115 |
| GO:00064862 | Liver | HCC | protein glycosylation | 122/7958 | 226/18723 | 3.11e-04 | 2.21e-03 | 122 |
| GO:00434132 | Liver | HCC | macromolecule glycosylation | 122/7958 | 226/18723 | 3.11e-04 | 2.21e-03 | 122 |
| GO:00700852 | Liver | HCC | glycosylation | 128/7958 | 240/18723 | 4.35e-04 | 2.92e-03 | 128 |
| GO:0006665 | Liver | HCC | sphingolipid metabolic process | 85/7958 | 155/18723 | 1.27e-03 | 6.92e-03 | 85 |
| GO:0046467 | Liver | HCC | membrane lipid biosynthetic process | 78/7958 | 142/18723 | 1.85e-03 | 9.46e-03 | 78 |
| GO:0009100 | Liver | HCC | glycoprotein metabolic process | 193/7958 | 387/18723 | 1.89e-03 | 9.62e-03 | 193 |
| GO:0006664 | Liver | HCC | glycolipid metabolic process | 57/7958 | 100/18723 | 2.40e-03 | 1.17e-02 | 57 |
| GO:1903509 | Liver | HCC | liposaccharide metabolic process | 57/7958 | 101/18723 | 3.25e-03 | 1.49e-02 | 57 |
| Page: 1 |
| Pathway ID | Tissue | Disease Stage | Description | Gene Ratio | Bg Ratio | pvalue | p.adjust | qvalue | Count |
| Page: 1 |
Top |
Cell-cell communication analysis |
| Identification of potential cell-cell interactions between two cell types and their ligand-receptor pairs for different disease states |
| Ligand | Receptor | LRpair | Pathway | Tissue | Disease Stage |
| Page: 1 |
Top |
Single-cell gene regulatory network inference analysis |
| Find out the significant the regulons (TFs) and the target genes of each regulon across cell types for different disease states |
| TF | Cell Type | Tissue | Disease Stage | Target Gene | RSS | Regulon Activity |
| ∗The dot plots of a searched regulon are shown for all cell subpopulations in each disease state of each tissue based on the regulon specific score inferred using pySCENIC and by calculating the average expression. |
| Page: 1 |
Top |
Somatic mutation of malignant transformation related genes |
| Annotation of somatic variants for genes involved in malignant transformation |
| Hugo Symbol | Variant Class | Variant Classification | dbSNP RS | HGVSc | HGVSp | HGVSp Short | SWISSPROT | BIOTYPE | SIFT | PolyPhen | Tumor Sample Barcode | Tissue | Histology | Sex | Age | Stage | Therapy Types | Drugs | Outcome |
| ST8SIA3 | SNV | Missense_Mutation | novel | c.18N>T | p.Met6Ile | p.M6I | O43173 | protein_coding | benign(0.38) | TCGA-EW-A6SC-01 | Breast | breast invasive carcinoma | Female | <65 | I/II | Hormone Therapy | aromatase | SD | |
| ST8SIA3 | SNV | Missense_Mutation | c.46N>A | p.Val16Ile | p.V16I | O43173 | protein_coding | benign(0) | TCGA-DS-A0VL-01 | Cervix | cervical & endocervical cancer | Female | <65 | I/II | Unknown | Unknown | SD | ||
| ST8SIA3 | SNV | Missense_Mutation | c.594N>C | p.Gln198His | p.Q198H | O43173 | protein_coding | benign(0.001) | TCGA-FU-A40J-01 | Cervix | cervical & endocervical cancer | Female | <65 | III/IV | Chemotherapy | carboplatin | CR | ||
| ST8SIA3 | SNV | Missense_Mutation | novel | c.463A>G | p.Met155Val | p.M155V | O43173 | protein_coding | benign(0) | TCGA-VS-A9UJ-01 | Cervix | cervical & endocervical cancer | Female | <65 | I/II | Unknown | Unknown | PD | |
| ST8SIA3 | SNV | Missense_Mutation | rs775252109 | c.191C>T | p.Ala64Val | p.A64V | O43173 | protein_coding | benign(0.041) | TCGA-A6-5661-01 | Colorectum | colon adenocarcinoma | Female | >=65 | I/II | Unknown | Unknown | SD | |
| ST8SIA3 | SNV | Missense_Mutation | rs781399885 | c.325N>A | p.Asp109Asn | p.D109N | O43173 | protein_coding | benign(0.32) | TCGA-A6-5665-01 | Colorectum | colon adenocarcinoma | Female | >=65 | I/II | Unknown | Unknown | PD | |
| ST8SIA3 | SNV | Missense_Mutation | rs550363690 | c.364N>T | p.Arg122Trp | p.R122W | O43173 | protein_coding | probably_damaging(0.94) | TCGA-AA-3510-01 | Colorectum | colon adenocarcinoma | Male | >=65 | I/II | Unknown | Unknown | SD | |
| ST8SIA3 | SNV | Missense_Mutation | c.313N>A | p.Leu105Ile | p.L105I | O43173 | protein_coding | benign(0.015) | TCGA-AA-3977-01 | Colorectum | colon adenocarcinoma | Male | >=65 | I/II | Unknown | Unknown | SD | ||
| ST8SIA3 | SNV | Missense_Mutation | c.290N>G | p.Phe97Cys | p.F97C | O43173 | protein_coding | benign(0.43) | TCGA-AZ-4315-01 | Colorectum | colon adenocarcinoma | Male | <65 | I/II | Unknown | Unknown | SD | ||
| ST8SIA3 | SNV | Missense_Mutation | rs113039733 | c.140N>T | p.Pro47Leu | p.P47L | O43173 | protein_coding | benign(0) | TCGA-AZ-6601-01 | Colorectum | colon adenocarcinoma | Male | >=65 | I/II | Unknown | Unknown | PD |
| Page: 1 2 3 4 5 6 7 8 |
Top |
Related drugs of malignant transformation related genes |
| Identification of chemicals and drugs interact with genes involved in malignant transfromation |
| (DGIdb 4.0) |
| Entrez ID | Symbol | Category | Interaction Types | Drug Claim Name | Drug Name | PMIDs |
| Page: 1 |

Copyright 2023-Present -The University of Texas Health Science Center at Houston |