
|
|||||
|
 | |
| |
| |
| |
| |
| |
|
Gene: ST7 |
Gene summary for ST7 |
| Gene information | Species | Human | Gene symbol | ST7 | Gene ID | 7982 |
| Gene name | suppression of tumorigenicity 7 | |
| Gene Alias | ETS7q | |
| Cytomap | 7q31.2 | |
| Gene Type | protein-coding | GO ID | GO:0008150 | UniProtAcc | Q9NRC1 |
Top |
Malignant transformation analysis |
| Identification of the aberrant gene expression in precancerous and cancerous lesions by comparing the gene expression of stem-like cells in diseased tissues with normal stem cells |
| Entrez ID | Symbol | Replicates | Species | Organ | Tissue | Adj P-value | Log2FC | Malignancy |
| 7982 | ST7 | LZE7T | Human | Esophagus | ESCC | 1.96e-05 | 2.23e-01 | 0.0667 |
| 7982 | ST7 | P1T-E | Human | Esophagus | ESCC | 2.41e-02 | 2.34e-01 | 0.0875 |
| 7982 | ST7 | P2T-E | Human | Esophagus | ESCC | 8.04e-14 | 1.20e-01 | 0.1177 |
| 7982 | ST7 | P4T-E | Human | Esophagus | ESCC | 7.45e-07 | 1.55e-01 | 0.1323 |
| 7982 | ST7 | P5T-E | Human | Esophagus | ESCC | 1.10e-16 | 8.19e-02 | 0.1327 |
| 7982 | ST7 | P8T-E | Human | Esophagus | ESCC | 1.92e-03 | 1.16e-01 | 0.0889 |
| 7982 | ST7 | P9T-E | Human | Esophagus | ESCC | 1.17e-03 | 8.79e-02 | 0.1131 |
| 7982 | ST7 | P10T-E | Human | Esophagus | ESCC | 3.20e-10 | 1.56e-01 | 0.116 |
| 7982 | ST7 | P11T-E | Human | Esophagus | ESCC | 1.99e-03 | 2.47e-01 | 0.1426 |
| 7982 | ST7 | P12T-E | Human | Esophagus | ESCC | 5.13e-11 | 2.22e-01 | 0.1122 |
| 7982 | ST7 | P15T-E | Human | Esophagus | ESCC | 1.90e-06 | 1.59e-01 | 0.1149 |
| 7982 | ST7 | P16T-E | Human | Esophagus | ESCC | 6.08e-09 | 1.03e-01 | 0.1153 |
| 7982 | ST7 | P20T-E | Human | Esophagus | ESCC | 1.37e-23 | 5.38e-01 | 0.1124 |
| 7982 | ST7 | P21T-E | Human | Esophagus | ESCC | 2.49e-09 | 1.29e-01 | 0.1617 |
| 7982 | ST7 | P22T-E | Human | Esophagus | ESCC | 2.90e-12 | 5.82e-02 | 0.1236 |
| 7982 | ST7 | P23T-E | Human | Esophagus | ESCC | 4.77e-13 | 1.67e-01 | 0.108 |
| 7982 | ST7 | P24T-E | Human | Esophagus | ESCC | 3.80e-06 | 4.81e-02 | 0.1287 |
| 7982 | ST7 | P26T-E | Human | Esophagus | ESCC | 3.60e-14 | 1.95e-01 | 0.1276 |
| 7982 | ST7 | P27T-E | Human | Esophagus | ESCC | 2.54e-11 | 1.33e-01 | 0.1055 |
| 7982 | ST7 | P28T-E | Human | Esophagus | ESCC | 5.51e-12 | 9.43e-02 | 0.1149 |
| Page: 1 2 3 |
| Tissue | Expression Dynamics | Abbreviation |
| Esophagus | 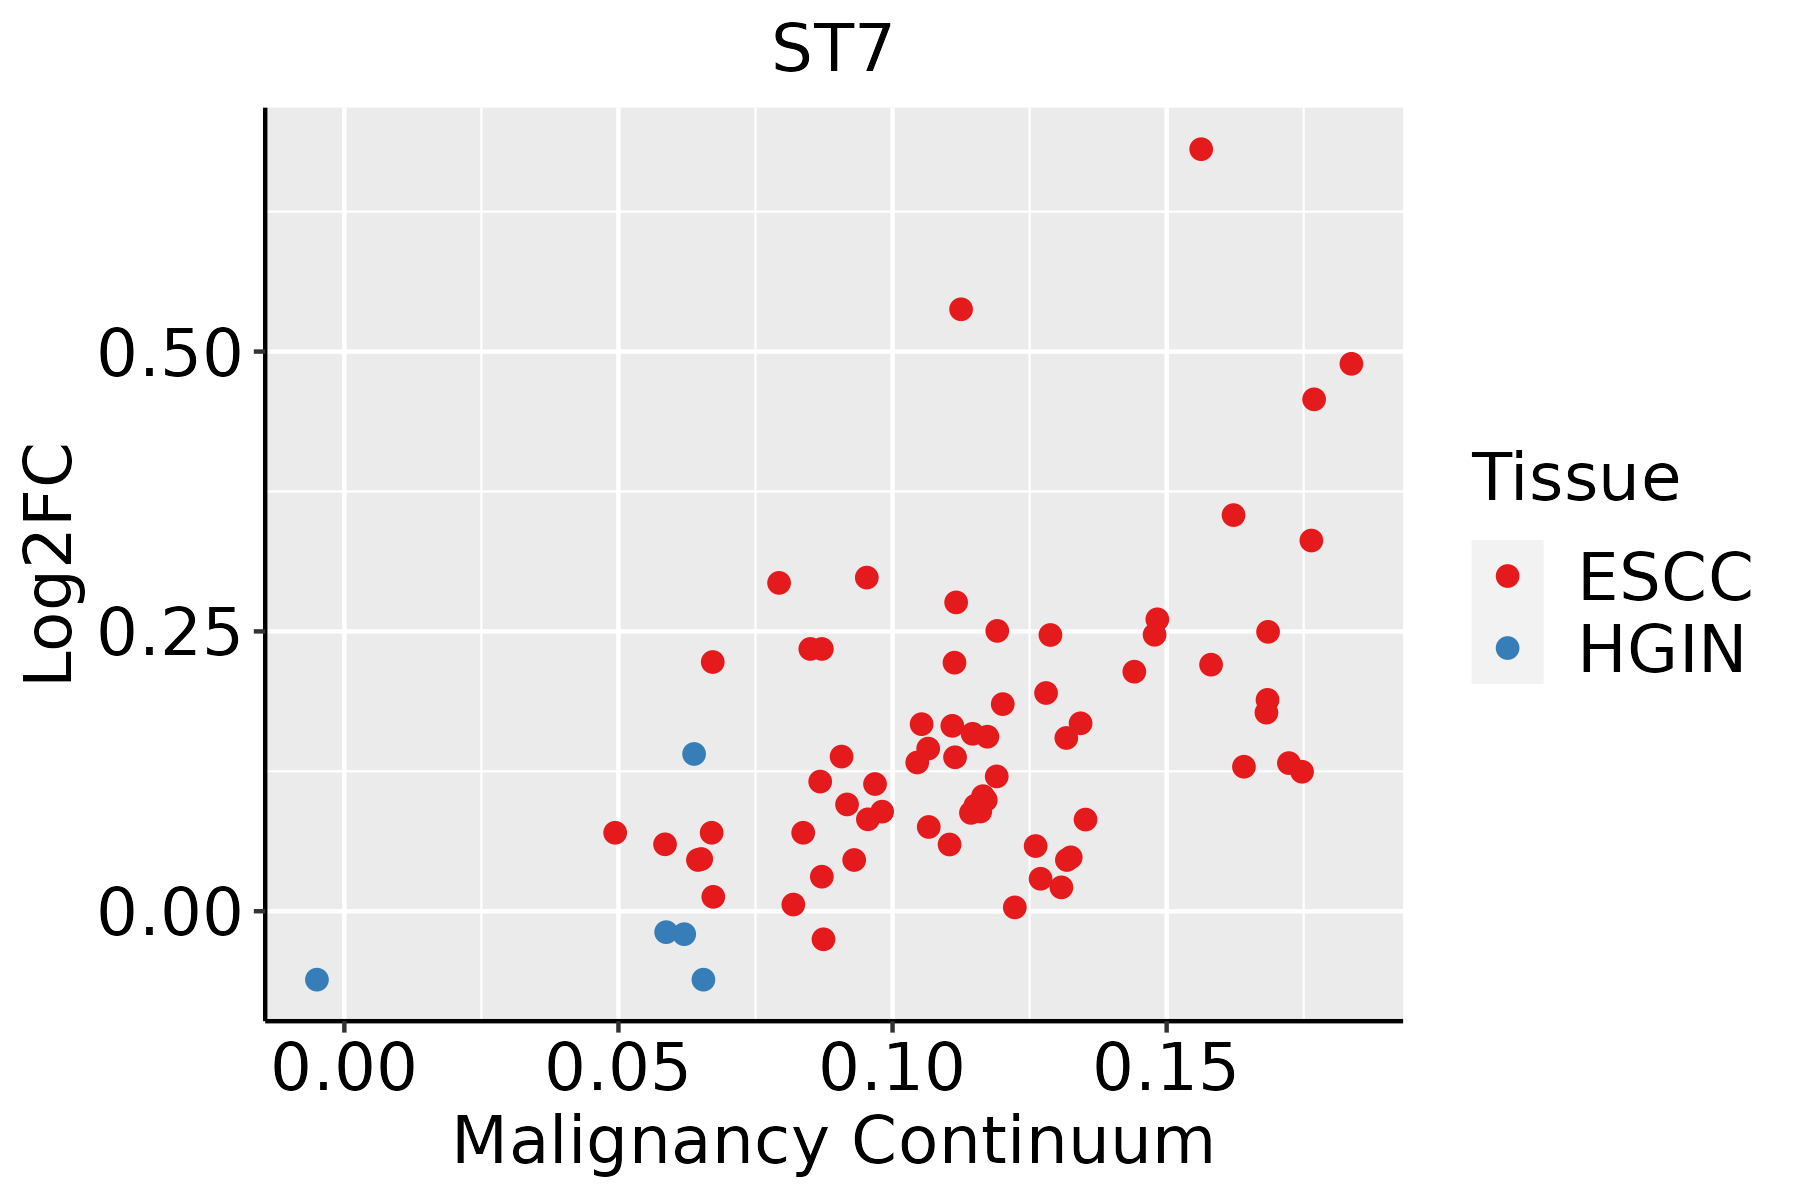 | ESCC: Esophageal squamous cell carcinoma |
| HGIN: High-grade intraepithelial neoplasias | ||
| LGIN: Low-grade intraepithelial neoplasias | ||
| Liver | 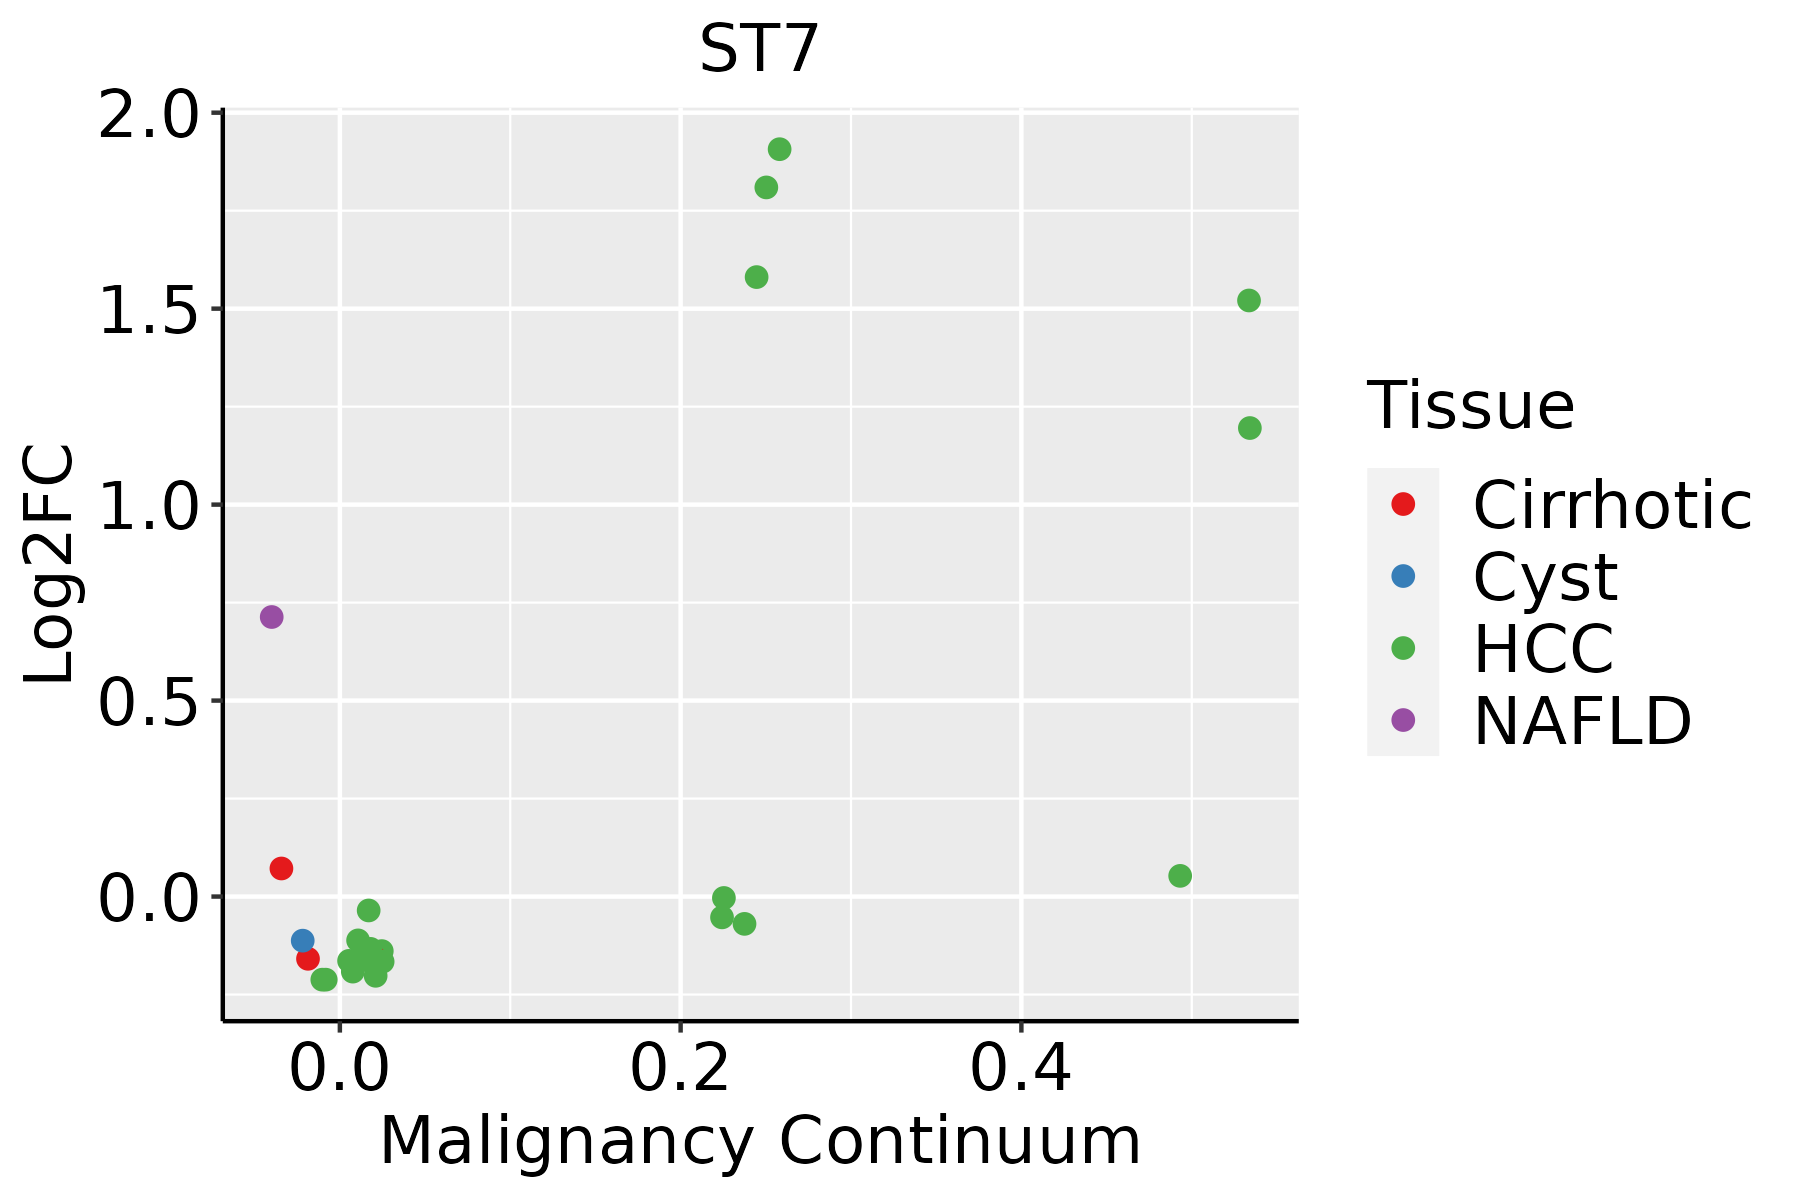 | HCC: Hepatocellular carcinoma |
| NAFLD: Non-alcoholic fatty liver disease |
| ∗log2FC in expression of this searched gene in stem-like cells from each diseased tissue sample relative to stem-like cells in normal samples in each tissue plotted against the malignancy continuum. Samples are colored based on if they are from different disease stage. |
Top |
Malignant transformation related pathway analysis |
| Find out the enriched GO biological processes and KEGG pathways involved in transition from healthy to precancer to cancer |
| Tissue | Disease Stage | Enriched GO biological Processes |
| Colorectum | AD |  |
| Colorectum | SER |  |
| Colorectum | MSS |  |
| Colorectum | MSI-H |  |
| Colorectum | FAP |  |
| ∗Top 15 enriched GO BP terms are showed in the bar plot of each disease state in each tissue. Each row represents a significant GO biological process which is colored according to the -log10(p.adjust). |
| Page: 1 2 3 4 5 6 7 8 9 |
| GO ID | Tissue | Disease Stage | Description | Gene Ratio | Bg Ratio | pvalue | p.adjust | Count |
| GO:2000116111 | Esophagus | ESCC | regulation of cysteine-type endopeptidase activity | 158/8552 | 235/18723 | 1.67e-11 | 5.90e-10 | 158 |
| GO:005160418 | Esophagus | ESCC | protein maturation | 189/8552 | 294/18723 | 7.64e-11 | 2.39e-09 | 189 |
| GO:0016049110 | Esophagus | ESCC | cell growth | 289/8552 | 482/18723 | 1.29e-10 | 3.77e-09 | 289 |
| GO:0052547111 | Esophagus | ESCC | regulation of peptidase activity | 275/8552 | 461/18723 | 7.54e-10 | 1.88e-08 | 275 |
| GO:000155819 | Esophagus | ESCC | regulation of cell growth | 248/8552 | 414/18723 | 2.97e-09 | 6.45e-08 | 248 |
| GO:0052548111 | Esophagus | ESCC | regulation of endopeptidase activity | 253/8552 | 432/18723 | 3.68e-08 | 6.78e-07 | 253 |
| GO:2000117110 | Esophagus | ESCC | negative regulation of cysteine-type endopeptidase activity | 63/8552 | 86/18723 | 1.84e-07 | 2.88e-06 | 63 |
| GO:00091002 | Esophagus | ESCC | glycoprotein metabolic process | 226/8552 | 387/18723 | 2.64e-07 | 3.94e-06 | 226 |
| GO:00067906 | Esophagus | ESCC | sulfur compound metabolic process | 201/8552 | 339/18723 | 2.64e-07 | 3.94e-06 | 201 |
| GO:00442725 | Esophagus | ESCC | sulfur compound biosynthetic process | 96/8552 | 148/18723 | 1.86e-06 | 2.16e-05 | 96 |
| GO:00459267 | Esophagus | ESCC | negative regulation of growth | 148/8552 | 249/18723 | 7.88e-06 | 7.73e-05 | 148 |
| GO:001648514 | Esophagus | ESCC | protein processing | 134/8552 | 225/18723 | 1.81e-05 | 1.60e-04 | 134 |
| GO:00425524 | Esophagus | ESCC | myelination | 85/8552 | 134/18723 | 2.51e-05 | 2.13e-04 | 85 |
| GO:00091012 | Esophagus | ESCC | glycoprotein biosynthetic process | 181/8552 | 317/18723 | 2.54e-05 | 2.15e-04 | 181 |
| GO:00072724 | Esophagus | ESCC | ensheathment of neurons | 86/8552 | 136/18723 | 2.68e-05 | 2.24e-04 | 86 |
| GO:00083664 | Esophagus | ESCC | axon ensheathment | 86/8552 | 136/18723 | 2.68e-05 | 2.24e-04 | 86 |
| GO:00301984 | Esophagus | ESCC | extracellular matrix organization | 171/8552 | 301/18723 | 6.08e-05 | 4.67e-04 | 171 |
| GO:00430624 | Esophagus | ESCC | extracellular structure organization | 171/8552 | 302/18723 | 7.73e-05 | 5.76e-04 | 171 |
| GO:00452294 | Esophagus | ESCC | external encapsulating structure organization | 172/8552 | 304/18723 | 7.80e-05 | 5.80e-04 | 172 |
| GO:0045861111 | Esophagus | ESCC | negative regulation of proteolysis | 195/8552 | 351/18723 | 1.13e-04 | 7.85e-04 | 195 |
| Page: 1 2 3 4 |
| Pathway ID | Tissue | Disease Stage | Description | Gene Ratio | Bg Ratio | pvalue | p.adjust | qvalue | Count |
| Page: 1 |
Top |
Cell-cell communication analysis |
| Identification of potential cell-cell interactions between two cell types and their ligand-receptor pairs for different disease states |
| Ligand | Receptor | LRpair | Pathway | Tissue | Disease Stage |
| Page: 1 |
Top |
Single-cell gene regulatory network inference analysis |
| Find out the significant the regulons (TFs) and the target genes of each regulon across cell types for different disease states |
| TF | Cell Type | Tissue | Disease Stage | Target Gene | RSS | Regulon Activity |
| ∗The dot plots of a searched regulon are shown for all cell subpopulations in each disease state of each tissue based on the regulon specific score inferred using pySCENIC and by calculating the average expression. |
| Page: 1 |
Top |
Somatic mutation of malignant transformation related genes |
| Annotation of somatic variants for genes involved in malignant transformation |
| Hugo Symbol | Variant Class | Variant Classification | dbSNP RS | HGVSc | HGVSp | HGVSp Short | SWISSPROT | BIOTYPE | SIFT | PolyPhen | Tumor Sample Barcode | Tissue | Histology | Sex | Age | Stage | Therapy Types | Drugs | Outcome |
| ST7 | SNV | Missense_Mutation | c.824N>G | p.Gln275Arg | p.Q275R | Q9NRC1 | protein_coding | tolerated(0.08) | benign(0.029) | TCGA-BH-A18G-01 | Breast | breast invasive carcinoma | Female | >=65 | I/II | Unknown | Unknown | SD | |
| ST7 | deletion | Frame_Shift_Del | novel | c.1465_1466delNN | p.Arg489LeufsTer17 | p.R489Lfs*17 | protein_coding | TCGA-A8-A09C-01 | Breast | breast invasive carcinoma | Female | >=65 | I/II | Unknown | Unknown | SD | |||
| ST7 | deletion | In_Frame_Del | novel | c.1439_1441delNNN | p.Ala480_Leu481delinsVal | p.A480_L481delinsV | protein_coding | TCGA-B6-A0IE-01 | Breast | breast invasive carcinoma | Female | <65 | III/IV | Unknown | Unknown | PD | |||
| ST7 | SNV | Missense_Mutation | c.1549C>A | p.Leu517Ile | p.L517I | Q9NRC1 | protein_coding | tolerated(0.1) | benign(0.158) | TCGA-AA-3977-01 | Colorectum | colon adenocarcinoma | Male | >=65 | I/II | Unknown | Unknown | SD | |
| ST7 | SNV | Missense_Mutation | rs772278439 | c.1411C>T | p.Arg471Trp | p.R471W | Q9NRC1 | protein_coding | deleterious(0) | probably_damaging(1) | TCGA-AD-6889-01 | Colorectum | colon adenocarcinoma | Male | >=65 | I/II | Chemotherapy | xeloda | PD |
| ST7 | SNV | Missense_Mutation | novel | c.1544N>G | p.Asp515Gly | p.D515G | protein_coding | benign(0) | TCGA-AD-6895-01 | Colorectum | colon adenocarcinoma | Male | >=65 | III/IV | Unknown | Unknown | SD | ||
| ST7 | SNV | Missense_Mutation | rs528877219 | c.410N>A | p.Arg137Gln | p.R137Q | Q9NRC1 | protein_coding | deleterious(0.04) | probably_damaging(0.999) | TCGA-AZ-4315-01 | Colorectum | colon adenocarcinoma | Male | <65 | I/II | Unknown | Unknown | SD |
| ST7 | SNV | Missense_Mutation | novel | c.1660C>T | p.Pro554Ser | p.P554S | protein_coding | deleterious(0.04) | benign(0.139) | TCGA-CA-6717-01 | Colorectum | colon adenocarcinoma | Male | <65 | I/II | Chemotherapy | oxaliplatin | CR | |
| ST7 | SNV | Missense_Mutation | c.1685A>G | p.Lys562Arg | p.K562R | Q9NRC1 | protein_coding | tolerated_low_confidence(0.26) | benign(0.018) | TCGA-D5-6928-01 | Colorectum | colon adenocarcinoma | Male | >=65 | I/II | Unknown | Unknown | SD | |
| ST7 | SNV | Missense_Mutation | c.1310N>T | p.Gly437Val | p.G437V | Q9NRC1 | protein_coding | deleterious(0.01) | probably_damaging(1) | TCGA-F4-6569-01 | Colorectum | colon adenocarcinoma | Male | <65 | I/II | Ancillary | leucovorin | CR |
| Page: 1 2 3 4 5 6 7 |
Top |
Related drugs of malignant transformation related genes |
| Identification of chemicals and drugs interact with genes involved in malignant transfromation |
| (DGIdb 4.0) |
| Entrez ID | Symbol | Category | Interaction Types | Drug Claim Name | Drug Name | PMIDs |
| Page: 1 |

Copyright 2023-Present -The University of Texas Health Science Center at Houston |