
|
|||||
|
 | |
| |
| |
| |
| |
| |
|
Gene: ST6GALNAC6 |
Gene summary for ST6GALNAC6 |
| Gene information | Species | Human | Gene symbol | ST6GALNAC6 | Gene ID | 30815 |
| Gene name | ST6 N-acetylgalactosaminide alpha-2,6-sialyltransferase 6 | |
| Gene Alias | SIAT7-F | |
| Cytomap | 9q34.11 | |
| Gene Type | protein-coding | GO ID | GO:0001573 | UniProtAcc | Q969X2 |
Top |
Malignant transformation analysis |
| Identification of the aberrant gene expression in precancerous and cancerous lesions by comparing the gene expression of stem-like cells in diseased tissues with normal stem cells |
| Entrez ID | Symbol | Replicates | Species | Organ | Tissue | Adj P-value | Log2FC | Malignancy |
| 30815 | ST6GALNAC6 | HTA11_2487_2000001011 | Human | Colorectum | SER | 1.16e-13 | 4.47e-01 | -0.1808 |
| 30815 | ST6GALNAC6 | HTA11_78_2000001011 | Human | Colorectum | AD | 4.96e-02 | 1.22e-01 | -0.1088 |
| 30815 | ST6GALNAC6 | HTA11_347_2000001011 | Human | Colorectum | AD | 3.13e-33 | 6.81e-01 | -0.1954 |
| 30815 | ST6GALNAC6 | HTA11_411_2000001011 | Human | Colorectum | SER | 9.56e-24 | 1.15e+00 | -0.2602 |
| 30815 | ST6GALNAC6 | HTA11_2112_2000001011 | Human | Colorectum | SER | 3.65e-22 | 1.00e+00 | -0.2196 |
| 30815 | ST6GALNAC6 | HTA11_696_2000001011 | Human | Colorectum | AD | 3.28e-34 | 6.36e-01 | -0.1464 |
| 30815 | ST6GALNAC6 | HTA11_866_2000001011 | Human | Colorectum | AD | 8.62e-04 | 1.27e-01 | -0.1001 |
| 30815 | ST6GALNAC6 | HTA11_2992_2000001011 | Human | Colorectum | SER | 2.03e-15 | 8.80e-01 | -0.1706 |
| 30815 | ST6GALNAC6 | HTA11_5212_2000001011 | Human | Colorectum | AD | 1.08e-24 | 1.03e+00 | -0.2061 |
| 30815 | ST6GALNAC6 | HTA11_5216_2000001011 | Human | Colorectum | SER | 3.03e-06 | 4.66e-01 | -0.1462 |
| 30815 | ST6GALNAC6 | HTA11_546_2000001011 | Human | Colorectum | AD | 4.17e-02 | 1.52e-01 | -0.0842 |
| 30815 | ST6GALNAC6 | LZE20T | Human | Esophagus | ESCC | 1.06e-05 | 2.47e-01 | 0.0662 |
| 30815 | ST6GALNAC6 | LZE24T | Human | Esophagus | ESCC | 6.80e-06 | 2.02e-01 | 0.0596 |
| 30815 | ST6GALNAC6 | P2T-E | Human | Esophagus | ESCC | 1.23e-28 | 4.45e-01 | 0.1177 |
| 30815 | ST6GALNAC6 | P4T-E | Human | Esophagus | ESCC | 1.30e-11 | 1.72e-01 | 0.1323 |
| 30815 | ST6GALNAC6 | P5T-E | Human | Esophagus | ESCC | 4.45e-04 | 1.22e-01 | 0.1327 |
| 30815 | ST6GALNAC6 | P8T-E | Human | Esophagus | ESCC | 1.33e-57 | 9.53e-01 | 0.0889 |
| 30815 | ST6GALNAC6 | P9T-E | Human | Esophagus | ESCC | 2.18e-02 | 1.25e-01 | 0.1131 |
| 30815 | ST6GALNAC6 | P10T-E | Human | Esophagus | ESCC | 2.05e-12 | 2.29e-01 | 0.116 |
| 30815 | ST6GALNAC6 | P11T-E | Human | Esophagus | ESCC | 8.80e-07 | 2.84e-01 | 0.1426 |
| Page: 1 2 3 4 |
| Tissue | Expression Dynamics | Abbreviation |
| Colorectum (GSE201348) | 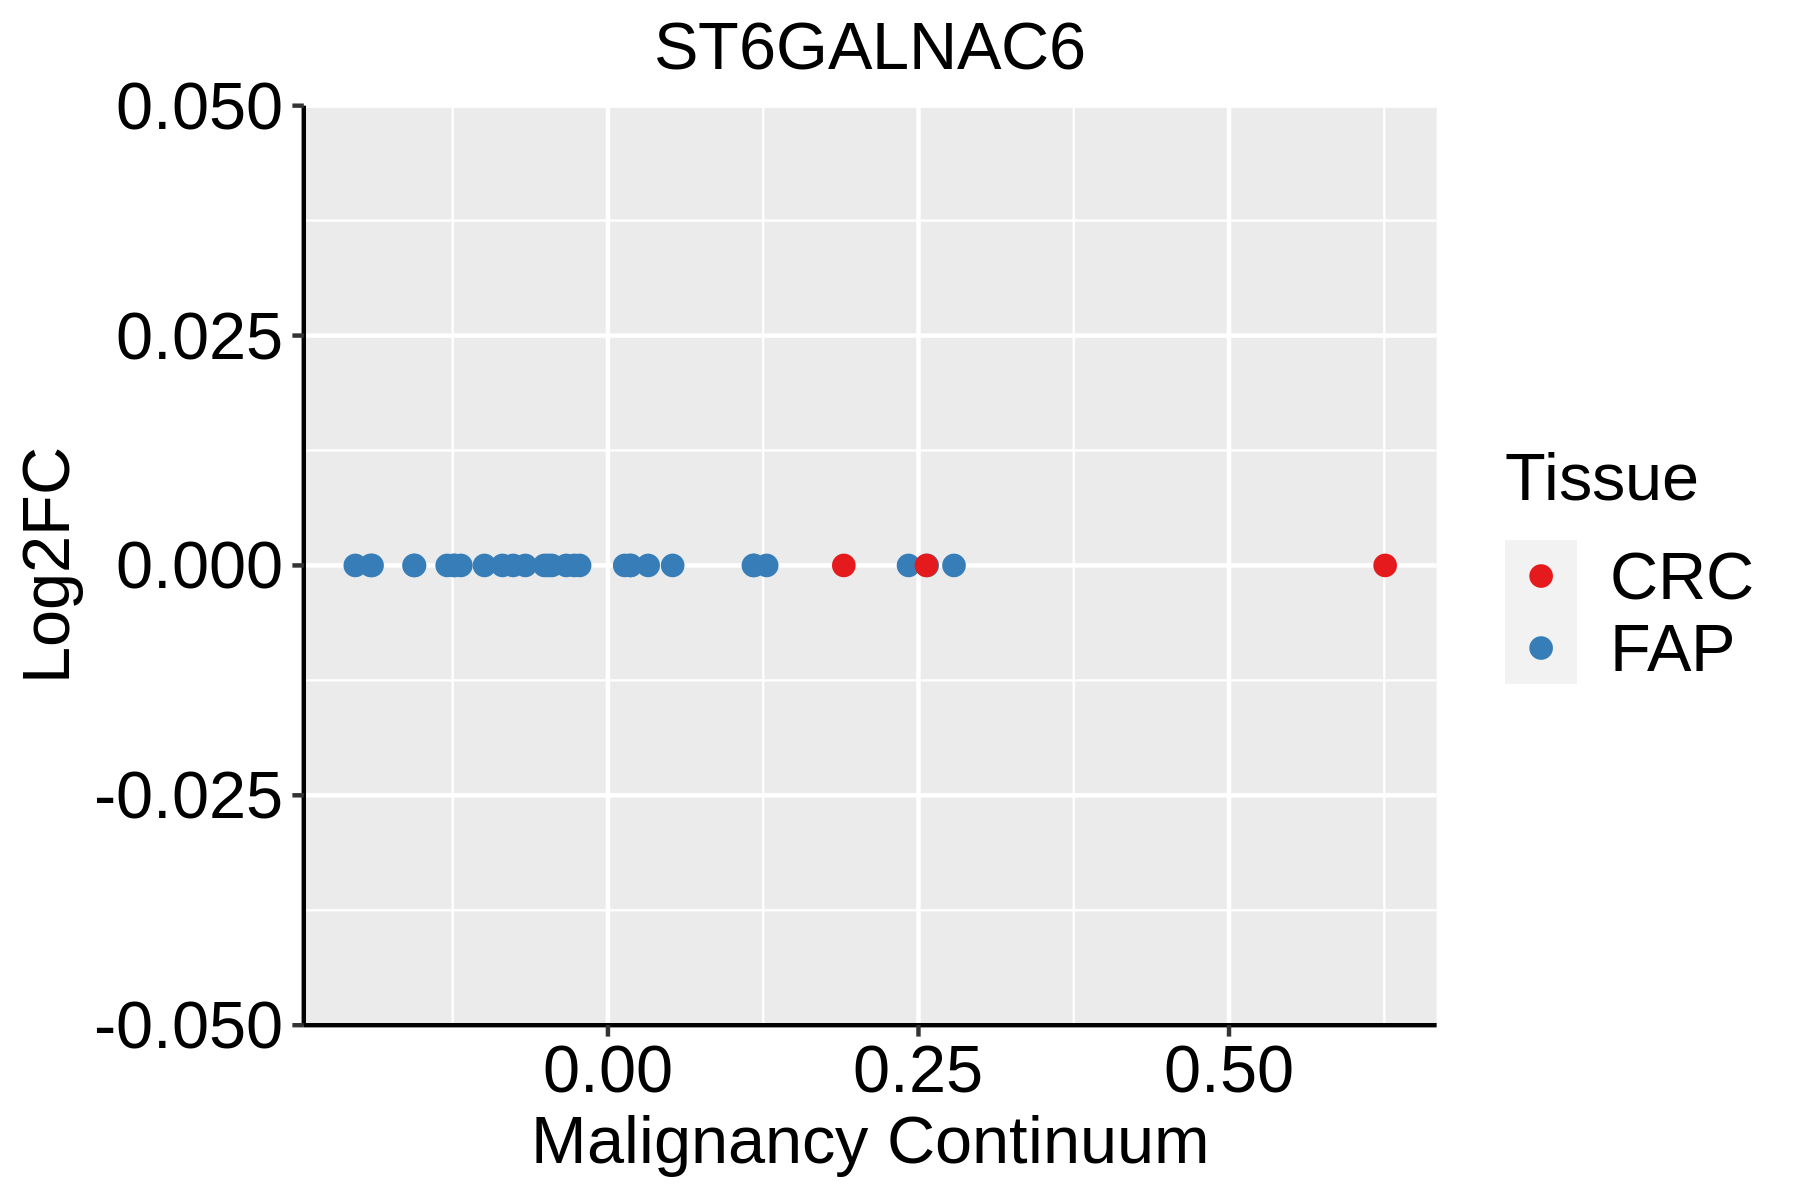 | FAP: Familial adenomatous polyposis |
| CRC: Colorectal cancer | ||
| Colorectum (HTA11) | 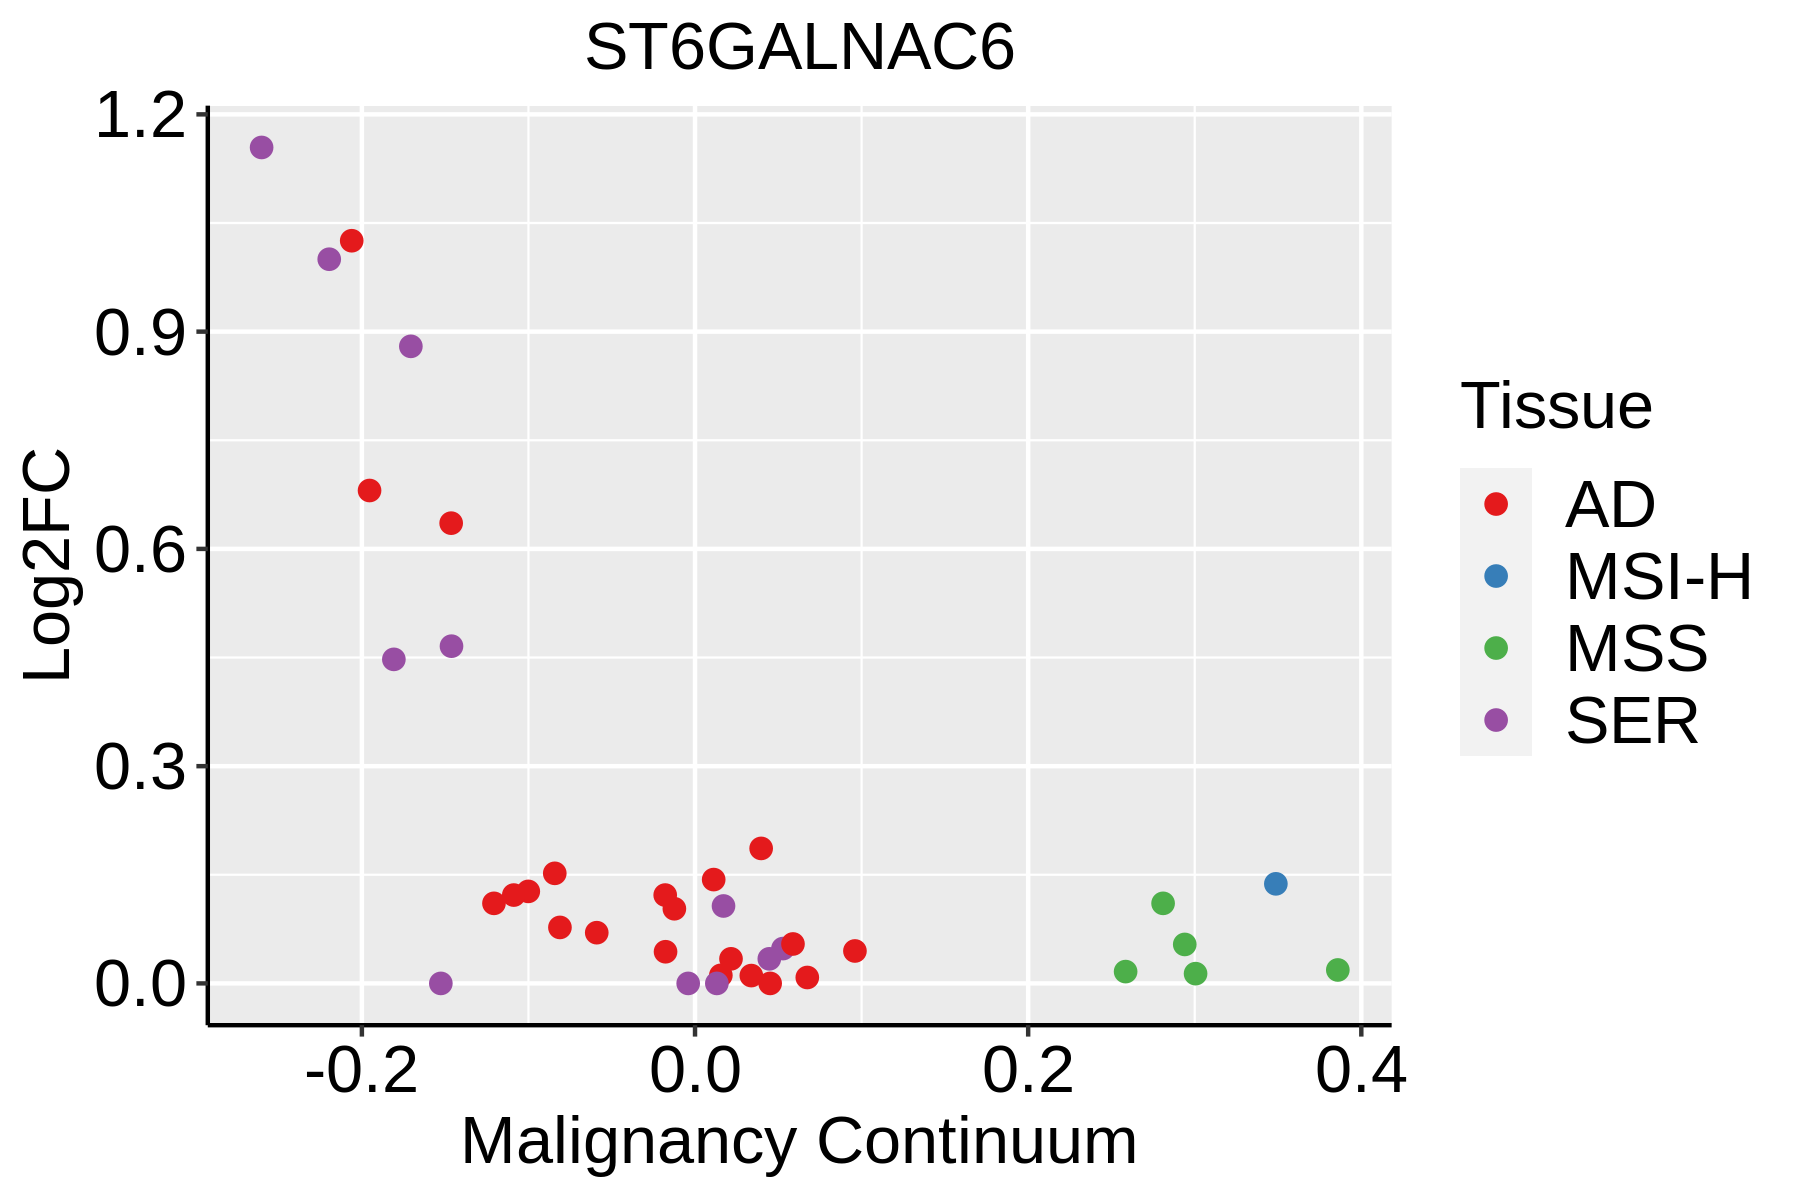 | AD: Adenomas |
| SER: Sessile serrated lesions | ||
| MSI-H: Microsatellite-high colorectal cancer | ||
| MSS: Microsatellite stable colorectal cancer | ||
| Esophagus | 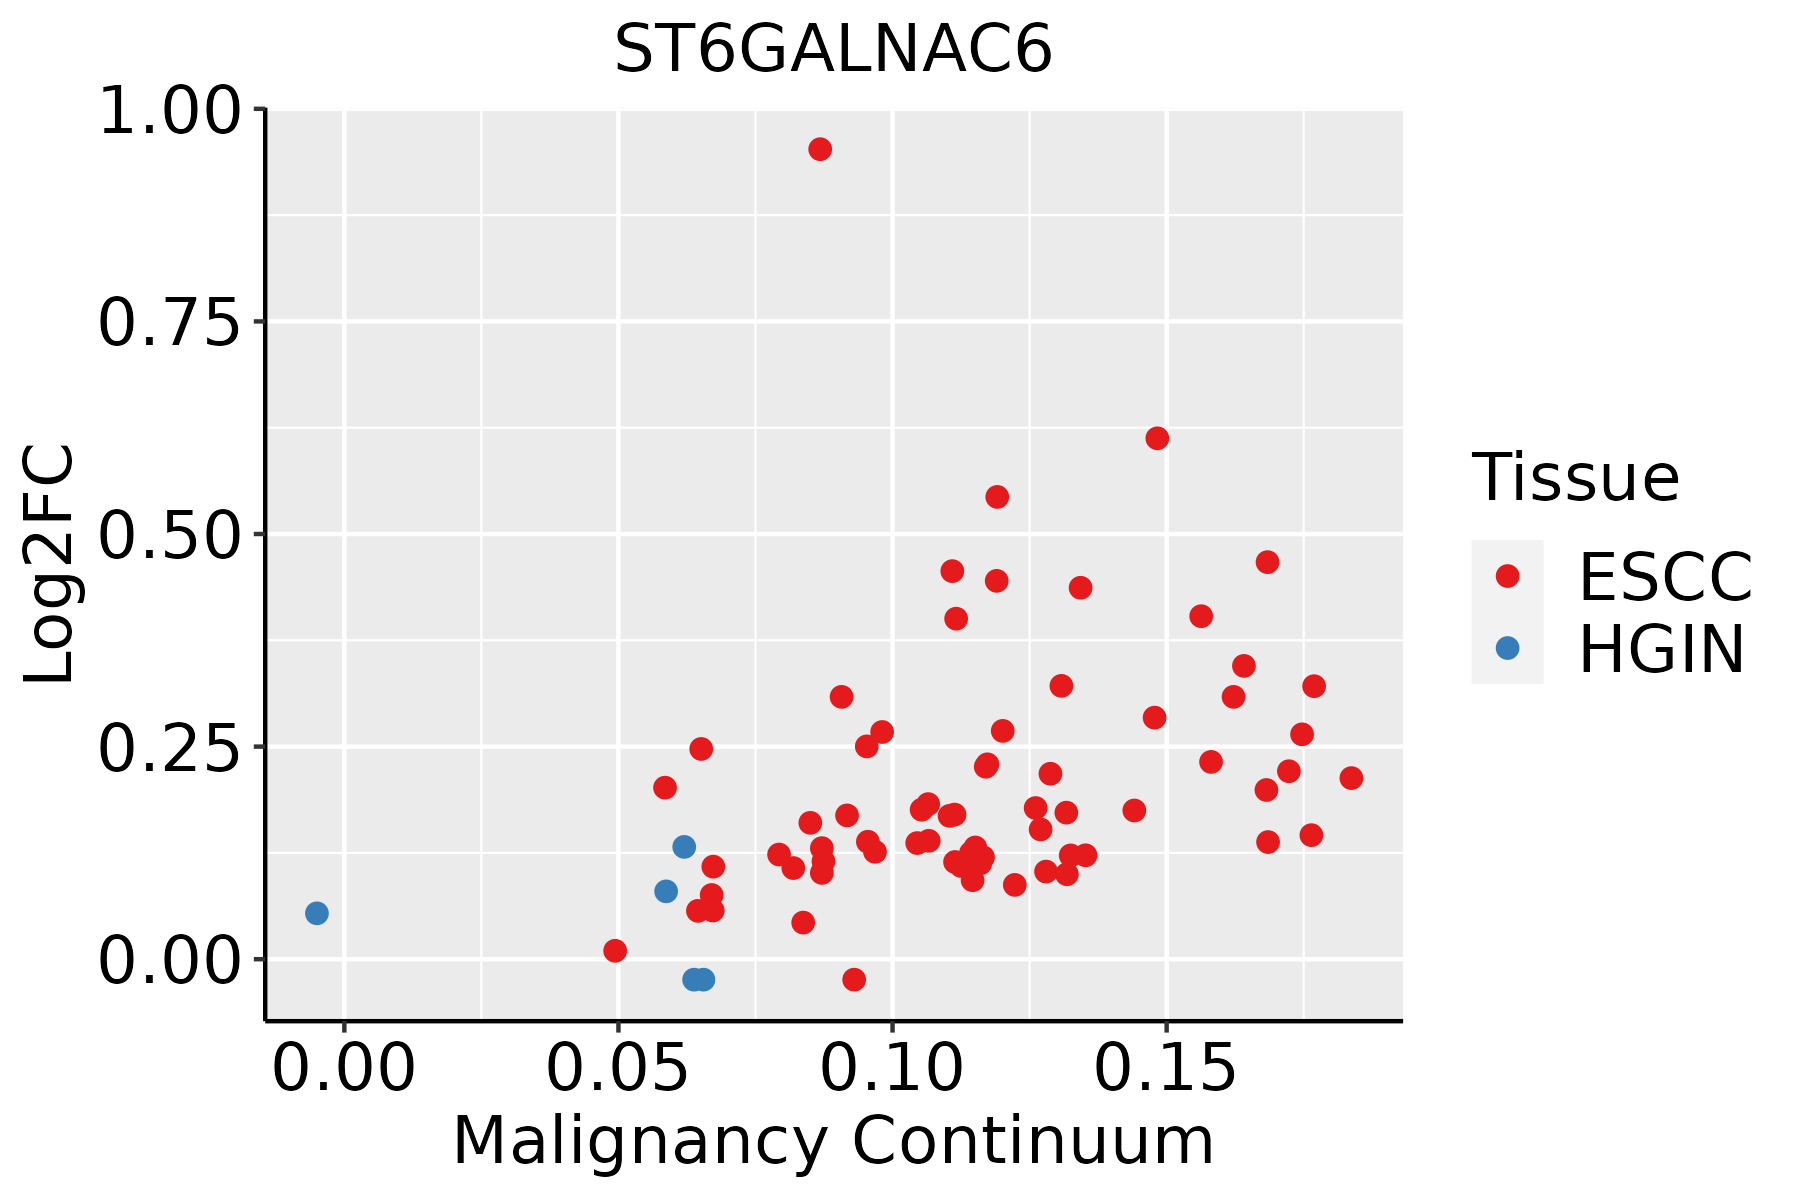 | ESCC: Esophageal squamous cell carcinoma |
| HGIN: High-grade intraepithelial neoplasias | ||
| LGIN: Low-grade intraepithelial neoplasias | ||
| Oral Cavity | 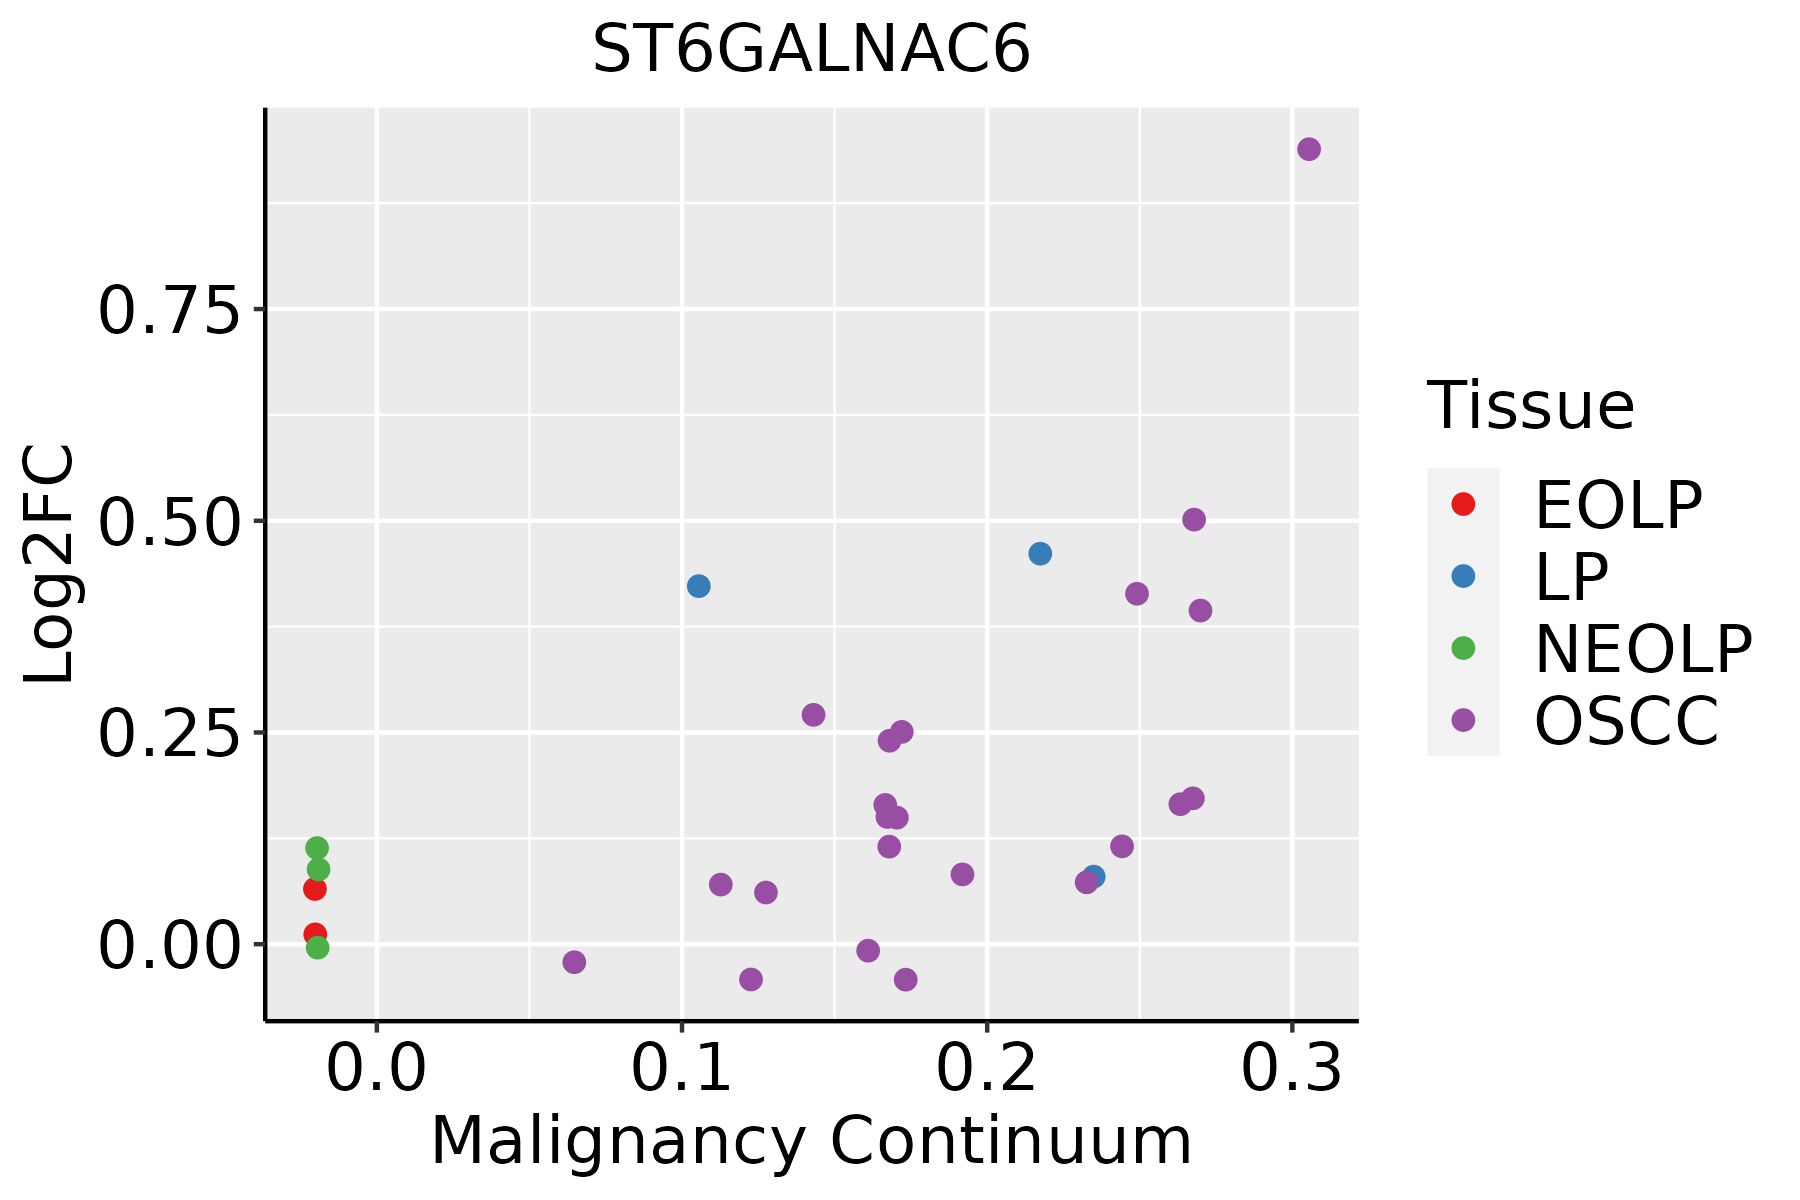 | EOLP: Erosive Oral lichen planus |
| LP: leukoplakia | ||
| NEOLP: Non-erosive oral lichen planus | ||
| OSCC: Oral squamous cell carcinoma |
| ∗log2FC in expression of this searched gene in stem-like cells from each diseased tissue sample relative to stem-like cells in normal samples in each tissue plotted against the malignancy continuum. Samples are colored based on if they are from different disease stage. |
Top |
Malignant transformation related pathway analysis |
| Find out the enriched GO biological processes and KEGG pathways involved in transition from healthy to precancer to cancer |
| Tissue | Disease Stage | Enriched GO biological Processes |
| Colorectum | AD |  |
| Colorectum | SER |  |
| Colorectum | MSS |  |
| Colorectum | MSI-H |  |
| Colorectum | FAP |  |
| ∗Top 15 enriched GO BP terms are showed in the bar plot of each disease state in each tissue. Each row represents a significant GO biological process which is colored according to the -log10(p.adjust). |
| Page: 1 2 3 4 5 6 7 8 9 |
| GO ID | Tissue | Disease Stage | Description | Gene Ratio | Bg Ratio | pvalue | p.adjust | Count |
| GO:0006486 | Colorectum | AD | protein glycosylation | 64/3918 | 226/18723 | 4.86e-03 | 3.27e-02 | 64 |
| GO:0043413 | Colorectum | AD | macromolecule glycosylation | 64/3918 | 226/18723 | 4.86e-03 | 3.27e-02 | 64 |
| GO:0070085 | Colorectum | AD | glycosylation | 67/3918 | 240/18723 | 5.78e-03 | 3.67e-02 | 67 |
| GO:00066433 | Esophagus | ESCC | membrane lipid metabolic process | 130/8552 | 203/18723 | 9.29e-08 | 1.54e-06 | 130 |
| GO:00091002 | Esophagus | ESCC | glycoprotein metabolic process | 226/8552 | 387/18723 | 2.64e-07 | 3.94e-06 | 226 |
| GO:00700854 | Esophagus | ESCC | glycosylation | 144/8552 | 240/18723 | 5.12e-06 | 5.38e-05 | 144 |
| GO:00464673 | Esophagus | ESCC | membrane lipid biosynthetic process | 91/8552 | 142/18723 | 7.19e-06 | 7.19e-05 | 91 |
| GO:00064865 | Esophagus | ESCC | protein glycosylation | 135/8552 | 226/18723 | 1.36e-05 | 1.24e-04 | 135 |
| GO:00434135 | Esophagus | ESCC | macromolecule glycosylation | 135/8552 | 226/18723 | 1.36e-05 | 1.24e-04 | 135 |
| GO:00091012 | Esophagus | ESCC | glycoprotein biosynthetic process | 181/8552 | 317/18723 | 2.54e-05 | 2.15e-04 | 181 |
| GO:00066652 | Esophagus | ESCC | sphingolipid metabolic process | 96/8552 | 155/18723 | 3.21e-05 | 2.66e-04 | 96 |
| GO:00160514 | Esophagus | ESCC | carbohydrate biosynthetic process | 117/8552 | 202/18723 | 2.96e-04 | 1.79e-03 | 117 |
| GO:00066642 | Esophagus | ESCC | glycolipid metabolic process | 63/8552 | 100/18723 | 3.55e-04 | 2.06e-03 | 63 |
| GO:19035092 | Esophagus | ESCC | liposaccharide metabolic process | 63/8552 | 101/18723 | 5.25e-04 | 2.90e-03 | 63 |
| GO:00301481 | Esophagus | ESCC | sphingolipid biosynthetic process | 62/8552 | 103/18723 | 2.10e-03 | 9.38e-03 | 62 |
| GO:00066721 | Esophagus | ESCC | ceramide metabolic process | 61/8552 | 102/18723 | 2.82e-03 | 1.19e-02 | 61 |
| GO:0009247 | Esophagus | ESCC | glycolipid biosynthetic process | 42/8552 | 68/18723 | 5.48e-03 | 2.05e-02 | 42 |
| GO:0046513 | Esophagus | ESCC | ceramide biosynthetic process | 40/8552 | 65/18723 | 7.25e-03 | 2.63e-02 | 40 |
| GO:00066432 | Oral cavity | OSCC | membrane lipid metabolic process | 111/7305 | 203/18723 | 4.02e-06 | 4.69e-05 | 111 |
| GO:00066651 | Oral cavity | OSCC | sphingolipid metabolic process | 84/7305 | 155/18723 | 8.64e-05 | 6.61e-04 | 84 |
| Page: 1 2 |
| Pathway ID | Tissue | Disease Stage | Description | Gene Ratio | Bg Ratio | pvalue | p.adjust | qvalue | Count |
| Page: 1 |
Top |
Cell-cell communication analysis |
| Identification of potential cell-cell interactions between two cell types and their ligand-receptor pairs for different disease states |
| Ligand | Receptor | LRpair | Pathway | Tissue | Disease Stage |
| Page: 1 |
Top |
Single-cell gene regulatory network inference analysis |
| Find out the significant the regulons (TFs) and the target genes of each regulon across cell types for different disease states |
| TF | Cell Type | Tissue | Disease Stage | Target Gene | RSS | Regulon Activity |
| ∗The dot plots of a searched regulon are shown for all cell subpopulations in each disease state of each tissue based on the regulon specific score inferred using pySCENIC and by calculating the average expression. |
| Page: 1 |
Top |
Somatic mutation of malignant transformation related genes |
| Annotation of somatic variants for genes involved in malignant transformation |
| Hugo Symbol | Variant Class | Variant Classification | dbSNP RS | HGVSc | HGVSp | HGVSp Short | SWISSPROT | BIOTYPE | SIFT | PolyPhen | Tumor Sample Barcode | Tissue | Histology | Sex | Age | Stage | Therapy Types | Drugs | Outcome |
| ST6GALNAC6 | SNV | Missense_Mutation | novel | c.1033G>C | p.Gly345Arg | p.G345R | Q969X2 | protein_coding | benign(0.003) | TCGA-AR-A251-01 | Breast | breast invasive carcinoma | Female | <65 | III/IV | Chemotherapy | doxorubicin | SD | |
| ST6GALNAC6 | SNV | Missense_Mutation | novel | c.371N>T | p.Pro124Leu | p.P124L | Q969X2 | protein_coding | benign(0.03) | TCGA-B6-A400-01 | Breast | breast invasive carcinoma | Female | <65 | III/IV | Unknown | Unknown | SD | |
| ST6GALNAC6 | SNV | Missense_Mutation | novel | c.1046N>T | p.Ser349Phe | p.S349F | Q969X2 | protein_coding | benign(0) | TCGA-BH-A2L8-01 | Breast | breast invasive carcinoma | Female | <65 | I/II | Chemotherapy | cytoxan | CR | |
| ST6GALNAC6 | SNV | Missense_Mutation | c.949C>T | p.Arg317Cys | p.R317C | Q969X2 | protein_coding | benign(0.34) | TCGA-E2-A1BD-01 | Breast | breast invasive carcinoma | Female | <65 | I/II | Hormone Therapy | arimidex | SD | ||
| ST6GALNAC6 | insertion | In_Frame_Ins | novel | c.572_573insTTTTGGAGC | p.Lys191delinsAsnPheGlyAla | p.K191delinsNFGA | Q969X2 | protein_coding | TCGA-A8-A07P-01 | Breast | breast invasive carcinoma | Female | >=65 | I/II | Chemotherapy | 5-fluorouracil | SD | ||
| ST6GALNAC6 | insertion | Nonsense_Mutation | novel | c.570_571insTACATATTTTGTTAGATTTATACCTAAATATTTAAAA | p.Lys191TyrfsTer5 | p.K191Yfs*5 | Q969X2 | protein_coding | TCGA-A8-A07P-01 | Breast | breast invasive carcinoma | Female | >=65 | I/II | Chemotherapy | 5-fluorouracil | SD | ||
| ST6GALNAC6 | SNV | Missense_Mutation | rs748307110 | c.919N>A | p.Ala307Thr | p.A307T | Q969X2 | protein_coding | benign(0.374) | TCGA-2W-A8YY-01 | Cervix | cervical & endocervical cancer | Female | <65 | I/II | Chemotherapy | cisplatin | CR | |
| ST6GALNAC6 | SNV | Missense_Mutation | rs759946472 | c.820N>A | p.Ala274Thr | p.A274T | Q969X2 | protein_coding | benign(0.195) | TCGA-A6-6140-01 | Colorectum | colon adenocarcinoma | Male | <65 | I/II | Chemotherapy | oxaliplatin | SD | |
| ST6GALNAC6 | SNV | Missense_Mutation | rs779271369 | c.652N>A | p.Gly218Ser | p.G218S | Q969X2 | protein_coding | benign(0.022) | TCGA-AA-3864-01 | Colorectum | colon adenocarcinoma | Male | >=65 | I/II | Unknown | Unknown | SD | |
| ST6GALNAC6 | SNV | Missense_Mutation | rs138204383 | c.463N>A | p.Val155Ile | p.V155I | Q969X2 | protein_coding | benign(0.062) | TCGA-AA-3949-01 | Colorectum | colon adenocarcinoma | Female | >=65 | III/IV | Unknown | Unknown | SD |
| Page: 1 2 3 4 |
Top |
Related drugs of malignant transformation related genes |
| Identification of chemicals and drugs interact with genes involved in malignant transfromation |
| (DGIdb 4.0) |
| Entrez ID | Symbol | Category | Interaction Types | Drug Claim Name | Drug Name | PMIDs |
| Page: 1 |

Copyright 2023-Present -The University of Texas Health Science Center at Houston |