
|
|||||
|
 | |
| |
| |
| |
| |
| |
|
Gene: ST6GALNAC1 |
Gene summary for ST6GALNAC1 |
| Gene information | Species | Human | Gene symbol | ST6GALNAC1 | Gene ID | 55808 |
| Gene name | ST6 N-acetylgalactosaminide alpha-2,6-sialyltransferase 1 | |
| Gene Alias | HSY11339 | |
| Cytomap | 17q25.1 | |
| Gene Type | protein-coding | GO ID | GO:0005975 | UniProtAcc | Q9NSC7 |
Top |
Malignant transformation analysis |
| Identification of the aberrant gene expression in precancerous and cancerous lesions by comparing the gene expression of stem-like cells in diseased tissues with normal stem cells |
| Entrez ID | Symbol | Replicates | Species | Organ | Tissue | Adj P-value | Log2FC | Malignancy |
| 55808 | ST6GALNAC1 | CA_HPV_1 | Human | Cervix | CC | 3.63e-03 | -1.39e-01 | 0.0264 |
| 55808 | ST6GALNAC1 | H2 | Human | Cervix | HSIL_HPV | 1.60e-29 | 6.38e-01 | 0.0632 |
| 55808 | ST6GALNAC1 | T2 | Human | Cervix | CC | 2.87e-07 | 5.26e-01 | 0.0709 |
| 55808 | ST6GALNAC1 | HTA11_2487_2000001011 | Human | Colorectum | SER | 1.98e-05 | 6.56e-01 | -0.1808 |
| 55808 | ST6GALNAC1 | HTA11_78_2000001011 | Human | Colorectum | AD | 2.13e-16 | 1.16e+00 | -0.1088 |
| 55808 | ST6GALNAC1 | HTA11_347_2000001011 | Human | Colorectum | AD | 2.92e-21 | 1.12e+00 | -0.1954 |
| 55808 | ST6GALNAC1 | HTA11_411_2000001011 | Human | Colorectum | SER | 4.14e-05 | 1.50e+00 | -0.2602 |
| 55808 | ST6GALNAC1 | HTA11_2112_2000001011 | Human | Colorectum | SER | 7.29e-03 | 9.62e-01 | -0.2196 |
| 55808 | ST6GALNAC1 | HTA11_696_2000001011 | Human | Colorectum | AD | 2.80e-25 | 1.41e+00 | -0.1464 |
| 55808 | ST6GALNAC1 | HTA11_866_2000001011 | Human | Colorectum | AD | 1.32e-12 | 8.18e-01 | -0.1001 |
| 55808 | ST6GALNAC1 | HTA11_5216_2000001011 | Human | Colorectum | SER | 3.88e-02 | 7.39e-01 | -0.1462 |
| 55808 | ST6GALNAC1 | HTA11_7862_2000001011 | Human | Colorectum | AD | 2.64e-03 | 5.68e-01 | -0.0179 |
| 55808 | ST6GALNAC1 | HTA11_6801_2000001011 | Human | Colorectum | SER | 1.81e-02 | 6.92e-01 | 0.0171 |
| 55808 | ST6GALNAC1 | HTA11_7696_3000711011 | Human | Colorectum | AD | 6.07e-05 | 1.36e-01 | 0.0674 |
| 55808 | ST6GALNAC1 | HTA11_99999965104_69814 | Human | Colorectum | MSS | 1.75e-02 | 4.94e-01 | 0.281 |
| 55808 | ST6GALNAC1 | HTA11_99999974143_84620 | Human | Colorectum | MSS | 6.14e-08 | -3.22e-01 | 0.3005 |
| 55808 | ST6GALNAC1 | A015-C-203 | Human | Colorectum | FAP | 4.16e-03 | -1.05e-01 | -0.1294 |
| 55808 | ST6GALNAC1 | A002-C-201 | Human | Colorectum | FAP | 3.16e-02 | -6.52e-02 | 0.0324 |
| 55808 | ST6GALNAC1 | A002-C-205 | Human | Colorectum | FAP | 1.76e-04 | 1.39e-02 | -0.1236 |
| 55808 | ST6GALNAC1 | A015-C-006 | Human | Colorectum | FAP | 1.61e-02 | -2.26e-02 | -0.0994 |
| Page: 1 2 3 4 |
| Tissue | Expression Dynamics | Abbreviation |
| Cervix | 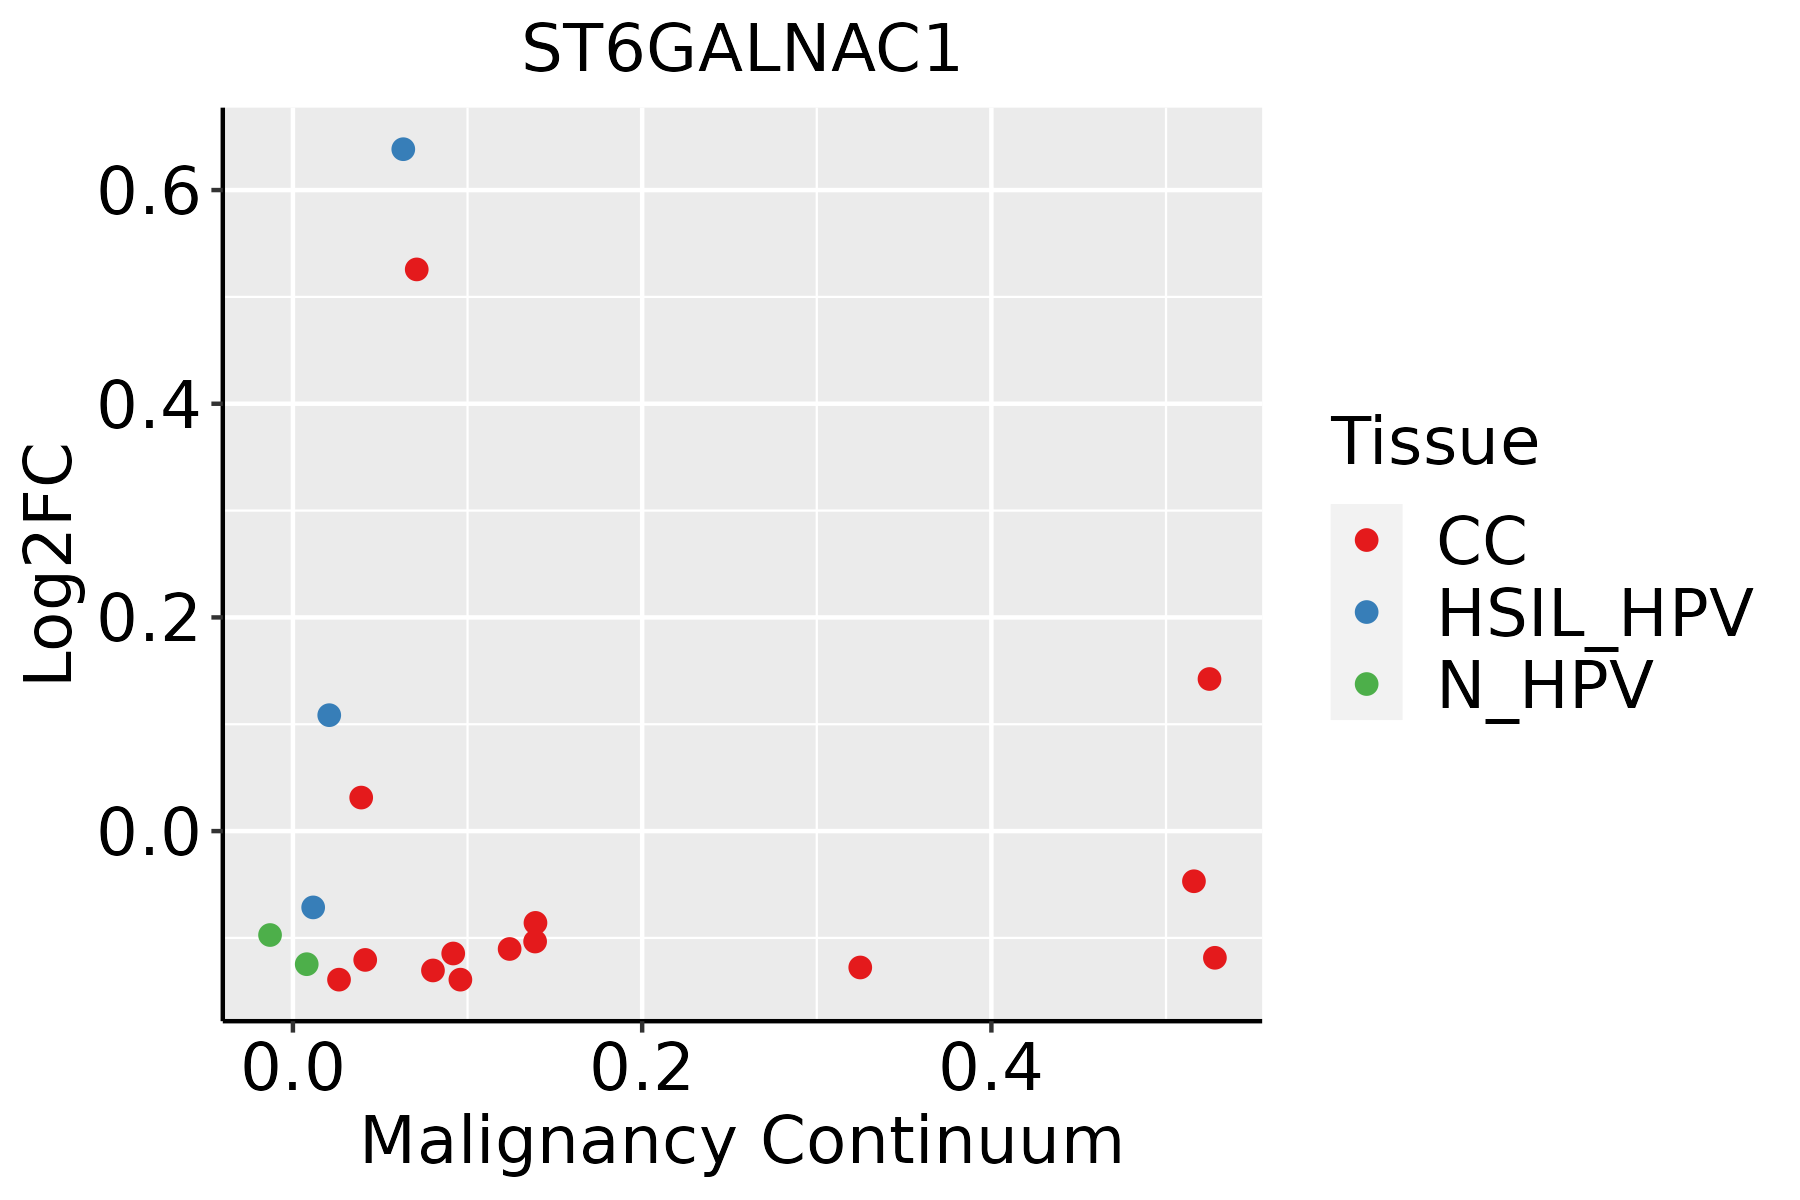 | CC: Cervix cancer |
| HSIL_HPV: HPV-infected high-grade squamous intraepithelial lesions | ||
| N_HPV: HPV-infected normal cervix | ||
| Colorectum (GSE201348) |  | FAP: Familial adenomatous polyposis |
| CRC: Colorectal cancer | ||
| Colorectum (HTA11) |  | AD: Adenomas |
| SER: Sessile serrated lesions | ||
| MSI-H: Microsatellite-high colorectal cancer | ||
| MSS: Microsatellite stable colorectal cancer | ||
| Esophagus |  | ESCC: Esophageal squamous cell carcinoma |
| HGIN: High-grade intraepithelial neoplasias | ||
| LGIN: Low-grade intraepithelial neoplasias | ||
| Oral Cavity | 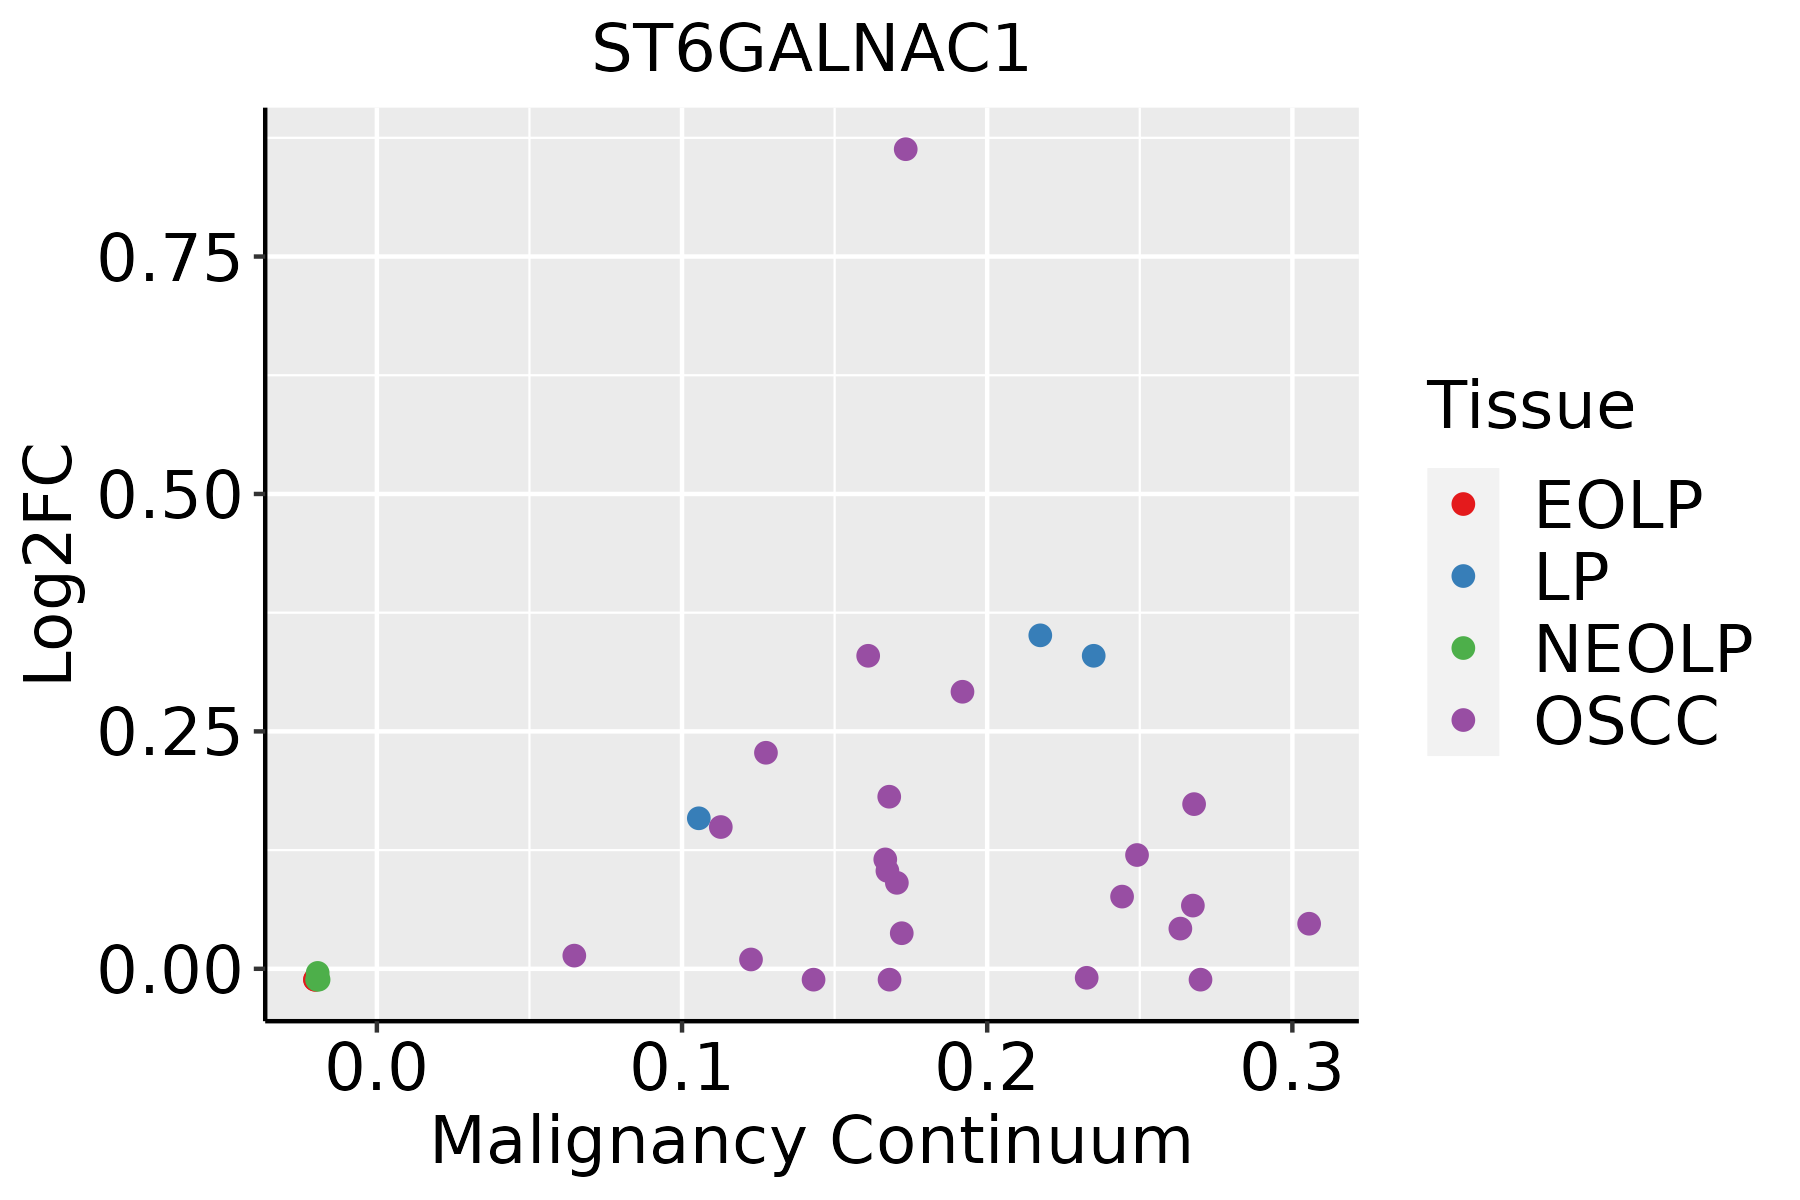 | EOLP: Erosive Oral lichen planus |
| LP: leukoplakia | ||
| NEOLP: Non-erosive oral lichen planus | ||
| OSCC: Oral squamous cell carcinoma |
| ∗log2FC in expression of this searched gene in stem-like cells from each diseased tissue sample relative to stem-like cells in normal samples in each tissue plotted against the malignancy continuum. Samples are colored based on if they are from different disease stage. |
Top |
Malignant transformation related pathway analysis |
| Find out the enriched GO biological processes and KEGG pathways involved in transition from healthy to precancer to cancer |
| Tissue | Disease Stage | Enriched GO biological Processes |
| Colorectum | AD |  |
| Colorectum | SER |  |
| Colorectum | MSS |  |
| Colorectum | MSI-H |  |
| Colorectum | FAP |  |
| ∗Top 15 enriched GO BP terms are showed in the bar plot of each disease state in each tissue. Each row represents a significant GO biological process which is colored according to the -log10(p.adjust). |
| Page: 1 2 3 4 5 6 7 8 9 |
| GO ID | Tissue | Disease Stage | Description | Gene Ratio | Bg Ratio | pvalue | p.adjust | Count |
| GO:0006486 | Colorectum | AD | protein glycosylation | 64/3918 | 226/18723 | 4.86e-03 | 3.27e-02 | 64 |
| GO:0043413 | Colorectum | AD | macromolecule glycosylation | 64/3918 | 226/18723 | 4.86e-03 | 3.27e-02 | 64 |
| GO:0070085 | Colorectum | AD | glycosylation | 67/3918 | 240/18723 | 5.78e-03 | 3.67e-02 | 67 |
| GO:00064861 | Colorectum | FAP | protein glycosylation | 48/2622 | 226/18723 | 1.85e-03 | 1.57e-02 | 48 |
| GO:00434131 | Colorectum | FAP | macromolecule glycosylation | 48/2622 | 226/18723 | 1.85e-03 | 1.57e-02 | 48 |
| GO:00700851 | Colorectum | FAP | glycosylation | 50/2622 | 240/18723 | 2.30e-03 | 1.85e-02 | 50 |
| GO:0009101 | Colorectum | FAP | glycoprotein biosynthetic process | 63/2622 | 317/18723 | 2.31e-03 | 1.86e-02 | 63 |
| GO:00091002 | Esophagus | ESCC | glycoprotein metabolic process | 226/8552 | 387/18723 | 2.64e-07 | 3.94e-06 | 226 |
| GO:00700854 | Esophagus | ESCC | glycosylation | 144/8552 | 240/18723 | 5.12e-06 | 5.38e-05 | 144 |
| GO:00064865 | Esophagus | ESCC | protein glycosylation | 135/8552 | 226/18723 | 1.36e-05 | 1.24e-04 | 135 |
| GO:00434135 | Esophagus | ESCC | macromolecule glycosylation | 135/8552 | 226/18723 | 1.36e-05 | 1.24e-04 | 135 |
| GO:00091012 | Esophagus | ESCC | glycoprotein biosynthetic process | 181/8552 | 317/18723 | 2.54e-05 | 2.15e-04 | 181 |
| GO:00160514 | Esophagus | ESCC | carbohydrate biosynthetic process | 117/8552 | 202/18723 | 2.96e-04 | 1.79e-03 | 117 |
| GO:00091001 | Oral cavity | OSCC | glycoprotein metabolic process | 185/7305 | 387/18723 | 2.37e-04 | 1.54e-03 | 185 |
| GO:00091011 | Oral cavity | OSCC | glycoprotein biosynthetic process | 151/7305 | 317/18723 | 1.01e-03 | 5.26e-03 | 151 |
| GO:00064864 | Oral cavity | OSCC | protein glycosylation | 111/7305 | 226/18723 | 1.22e-03 | 6.10e-03 | 111 |
| GO:00434134 | Oral cavity | OSCC | macromolecule glycosylation | 111/7305 | 226/18723 | 1.22e-03 | 6.10e-03 | 111 |
| GO:00700853 | Oral cavity | OSCC | glycosylation | 117/7305 | 240/18723 | 1.29e-03 | 6.42e-03 | 117 |
| GO:00160513 | Oral cavity | OSCC | carbohydrate biosynthetic process | 97/7305 | 202/18723 | 5.50e-03 | 2.13e-02 | 97 |
| GO:007008511 | Oral cavity | LP | glycosylation | 77/4623 | 240/18723 | 5.60e-03 | 3.38e-02 | 77 |
| Page: 1 2 |
| Pathway ID | Tissue | Disease Stage | Description | Gene Ratio | Bg Ratio | pvalue | p.adjust | qvalue | Count |
| Page: 1 |
Top |
Cell-cell communication analysis |
| Identification of potential cell-cell interactions between two cell types and their ligand-receptor pairs for different disease states |
| Ligand | Receptor | LRpair | Pathway | Tissue | Disease Stage |
| Page: 1 |
Top |
Single-cell gene regulatory network inference analysis |
| Find out the significant the regulons (TFs) and the target genes of each regulon across cell types for different disease states |
| TF | Cell Type | Tissue | Disease Stage | Target Gene | RSS | Regulon Activity |
| ∗The dot plots of a searched regulon are shown for all cell subpopulations in each disease state of each tissue based on the regulon specific score inferred using pySCENIC and by calculating the average expression. |
| Page: 1 |
Top |
Somatic mutation of malignant transformation related genes |
| Annotation of somatic variants for genes involved in malignant transformation |
| Hugo Symbol | Variant Class | Variant Classification | dbSNP RS | HGVSc | HGVSp | HGVSp Short | SWISSPROT | BIOTYPE | SIFT | PolyPhen | Tumor Sample Barcode | Tissue | Histology | Sex | Age | Stage | Therapy Types | Drugs | Outcome |
| ST6GALNAC1 | SNV | Missense_Mutation | c.955G>C | p.Glu319Gln | p.E319Q | Q9NSC7 | protein_coding | possibly_damaging(0.868) | TCGA-A2-A0CT-01 | Breast | breast invasive carcinoma | Female | >=65 | I/II | Chemotherapy | cytoxan | SD | ||
| ST6GALNAC1 | SNV | Missense_Mutation | c.1661N>G | p.Tyr554Cys | p.Y554C | Q9NSC7 | protein_coding | probably_damaging(0.91) | TCGA-A8-A06O-01 | Breast | breast invasive carcinoma | Female | <65 | I/II | Hormone Therapy | letrozole | SD | ||
| ST6GALNAC1 | SNV | Missense_Mutation | novel | c.1001N>C | p.Leu334Ser | p.L334S | Q9NSC7 | protein_coding | benign(0.164) | TCGA-AR-A0TY-01 | Breast | breast invasive carcinoma | Female | <65 | I/II | Unspecific | Paclitaxel | PD | |
| ST6GALNAC1 | SNV | Missense_Mutation | c.936N>C | p.Gln312His | p.Q312H | Q9NSC7 | protein_coding | possibly_damaging(0.748) | TCGA-BH-A18P-01 | Breast | breast invasive carcinoma | Female | <65 | I/II | Unknown | Unknown | PD | ||
| ST6GALNAC1 | SNV | Missense_Mutation | c.1072N>A | p.Gly358Arg | p.G358R | Q9NSC7 | protein_coding | benign(0.125) | TCGA-E9-A244-01 | Breast | breast invasive carcinoma | Female | <65 | I/II | Chemotherapy | cyclophosphamide | SD | ||
| ST6GALNAC1 | insertion | Nonsense_Mutation | novel | c.1204_1205insTGAGCCTCACCGAGTGTTACTCGAGTCCAAAGTAG | p.Gln402LeufsTer12 | p.Q402Lfs*12 | Q9NSC7 | protein_coding | TCGA-B6-A0IM-01 | Breast | breast invasive carcinoma | Female | >=65 | I/II | Unknown | Unknown | SD | ||
| ST6GALNAC1 | SNV | Missense_Mutation | rs376555341 | c.1438N>T | p.Arg480Trp | p.R480W | Q9NSC7 | protein_coding | benign(0.025) | TCGA-2W-A8YY-01 | Cervix | cervical & endocervical cancer | Female | <65 | I/II | Chemotherapy | cisplatin | CR | |
| ST6GALNAC1 | SNV | Missense_Mutation | rs151127625 | c.1490N>A | p.Arg497Gln | p.R497Q | Q9NSC7 | protein_coding | probably_damaging(0.999) | TCGA-EK-A2PG-01 | Cervix | cervical & endocervical cancer | Female | >=65 | I/II | Unknown | Unknown | SD | |
| ST6GALNAC1 | SNV | Missense_Mutation | c.161G>T | p.Arg54Met | p.R54M | Q9NSC7 | protein_coding | possibly_damaging(0.778) | TCGA-AD-A5EJ-01 | Colorectum | colon adenocarcinoma | Female | >=65 | I/II | Unknown | Unknown | SD | ||
| ST6GALNAC1 | SNV | Missense_Mutation | novel | c.1377G>T | p.Met459Ile | p.M459I | Q9NSC7 | protein_coding | benign(0.113) | TCGA-CA-6718-01 | Colorectum | colon adenocarcinoma | Male | <65 | I/II | Unknown | Unknown | PD |
| Page: 1 2 3 4 5 |
Top |
Related drugs of malignant transformation related genes |
| Identification of chemicals and drugs interact with genes involved in malignant transfromation |
| (DGIdb 4.0) |
| Entrez ID | Symbol | Category | Interaction Types | Drug Claim Name | Drug Name | PMIDs |
| Page: 1 |

Copyright 2023-Present -The University of Texas Health Science Center at Houston |