
|
|||||
|
 | |
| |
| |
| |
| |
| |
|
Gene: ST6GAL1 |
Gene summary for ST6GAL1 |
| Gene information | Species | Human | Gene symbol | ST6GAL1 | Gene ID | 6480 |
| Gene name | ST6 beta-galactoside alpha-2,6-sialyltransferase 1 | |
| Gene Alias | SIAT1 | |
| Cytomap | 3q27.3 | |
| Gene Type | protein-coding | GO ID | GO:0002376 | UniProtAcc | P15907 |
Top |
Malignant transformation analysis |
| Identification of the aberrant gene expression in precancerous and cancerous lesions by comparing the gene expression of stem-like cells in diseased tissues with normal stem cells |
| Entrez ID | Symbol | Replicates | Species | Organ | Tissue | Adj P-value | Log2FC | Malignancy |
| 6480 | ST6GAL1 | CA_HPV_1 | Human | Cervix | CC | 4.04e-03 | -2.59e-01 | 0.0264 |
| 6480 | ST6GAL1 | N_HPV_1 | Human | Cervix | N_HPV | 1.61e-03 | -2.34e-01 | 0.0079 |
| 6480 | ST6GAL1 | CCI_3 | Human | Cervix | CC | 1.92e-08 | 9.90e-01 | 0.516 |
| 6480 | ST6GAL1 | L1 | Human | Cervix | CC | 9.62e-05 | -3.17e-01 | 0.0802 |
| 6480 | ST6GAL1 | HTA11_866_3004761011 | Human | Colorectum | AD | 5.46e-03 | 4.61e-01 | 0.096 |
| 6480 | ST6GAL1 | HTA11_6818_2000001021 | Human | Colorectum | AD | 4.21e-03 | 5.33e-01 | 0.0588 |
| 6480 | ST6GAL1 | HTA11_99999970781_79442 | Human | Colorectum | MSS | 9.68e-09 | 5.76e-01 | 0.294 |
| 6480 | ST6GAL1 | HTA11_99999971662_82457 | Human | Colorectum | MSS | 4.85e-09 | 7.25e-01 | 0.3859 |
| 6480 | ST6GAL1 | A015-C-203 | Human | Colorectum | FAP | 1.07e-16 | -1.77e-01 | -0.1294 |
| 6480 | ST6GAL1 | A015-C-204 | Human | Colorectum | FAP | 7.47e-03 | -1.83e-01 | -0.0228 |
| 6480 | ST6GAL1 | A002-C-201 | Human | Colorectum | FAP | 3.69e-07 | -2.12e-01 | 0.0324 |
| 6480 | ST6GAL1 | A001-C-108 | Human | Colorectum | FAP | 4.30e-06 | 5.23e-02 | -0.0272 |
| 6480 | ST6GAL1 | A002-C-021 | Human | Colorectum | FAP | 4.85e-06 | 3.69e-01 | 0.1171 |
| 6480 | ST6GAL1 | A002-C-205 | Human | Colorectum | FAP | 5.99e-11 | -2.15e-01 | -0.1236 |
| 6480 | ST6GAL1 | A015-C-006 | Human | Colorectum | FAP | 7.98e-11 | -3.97e-01 | -0.0994 |
| 6480 | ST6GAL1 | A015-C-106 | Human | Colorectum | FAP | 2.82e-03 | -7.45e-02 | -0.0511 |
| 6480 | ST6GAL1 | A002-C-114 | Human | Colorectum | FAP | 1.76e-12 | -4.15e-01 | -0.1561 |
| 6480 | ST6GAL1 | A015-C-104 | Human | Colorectum | FAP | 5.10e-15 | -2.71e-01 | -0.1899 |
| 6480 | ST6GAL1 | A001-C-014 | Human | Colorectum | FAP | 1.62e-04 | 6.37e-02 | 0.0135 |
| 6480 | ST6GAL1 | A002-C-016 | Human | Colorectum | FAP | 4.96e-10 | -2.18e-01 | 0.0521 |
| Page: 1 2 3 4 5 6 |
| Tissue | Expression Dynamics | Abbreviation |
| Cervix |  | CC: Cervix cancer |
| HSIL_HPV: HPV-infected high-grade squamous intraepithelial lesions | ||
| N_HPV: HPV-infected normal cervix | ||
| Colorectum (GSE201348) |  | FAP: Familial adenomatous polyposis |
| CRC: Colorectal cancer | ||
| Colorectum (HTA11) |  | AD: Adenomas |
| SER: Sessile serrated lesions | ||
| MSI-H: Microsatellite-high colorectal cancer | ||
| MSS: Microsatellite stable colorectal cancer | ||
| Endometrium |  | AEH: Atypical endometrial hyperplasia |
| EEC: Endometrioid Cancer | ||
| Esophagus | 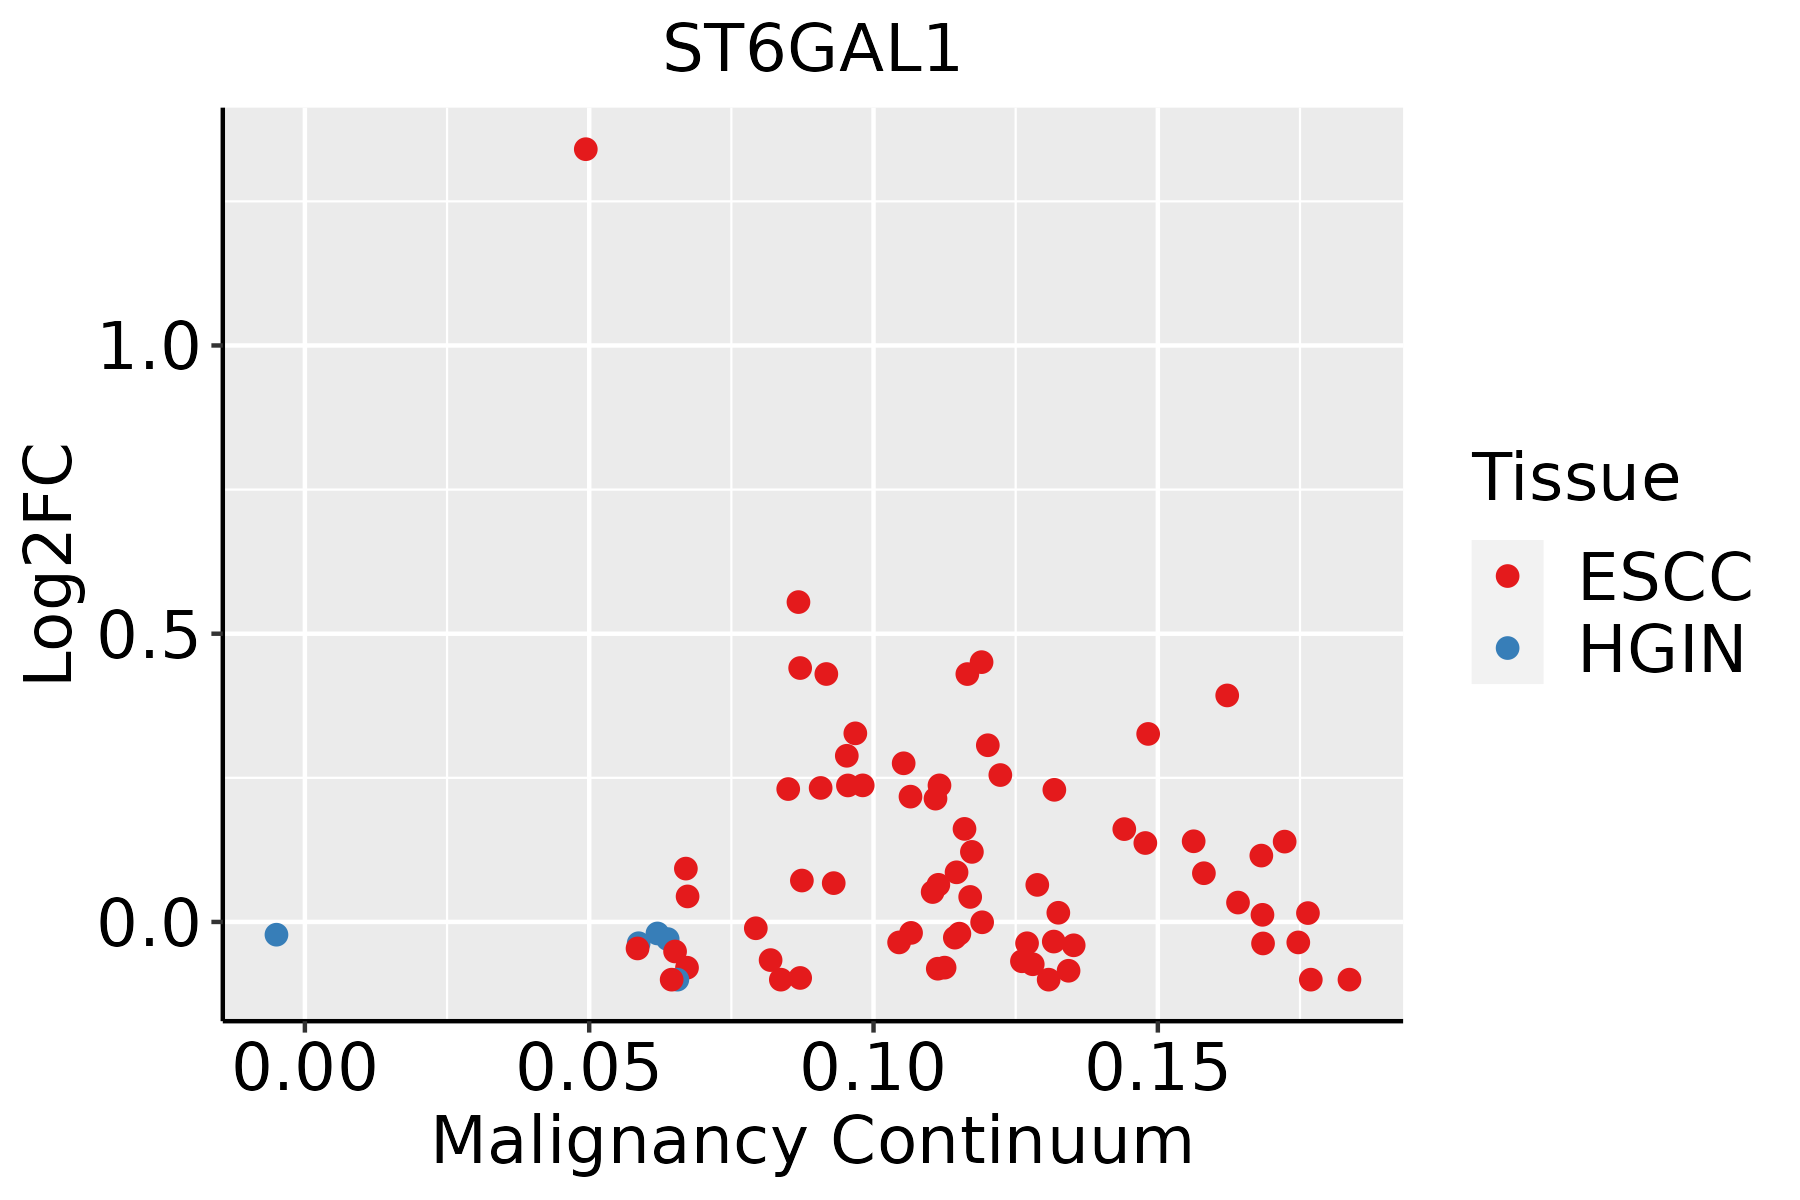 | ESCC: Esophageal squamous cell carcinoma |
| HGIN: High-grade intraepithelial neoplasias | ||
| LGIN: Low-grade intraepithelial neoplasias | ||
| Liver | 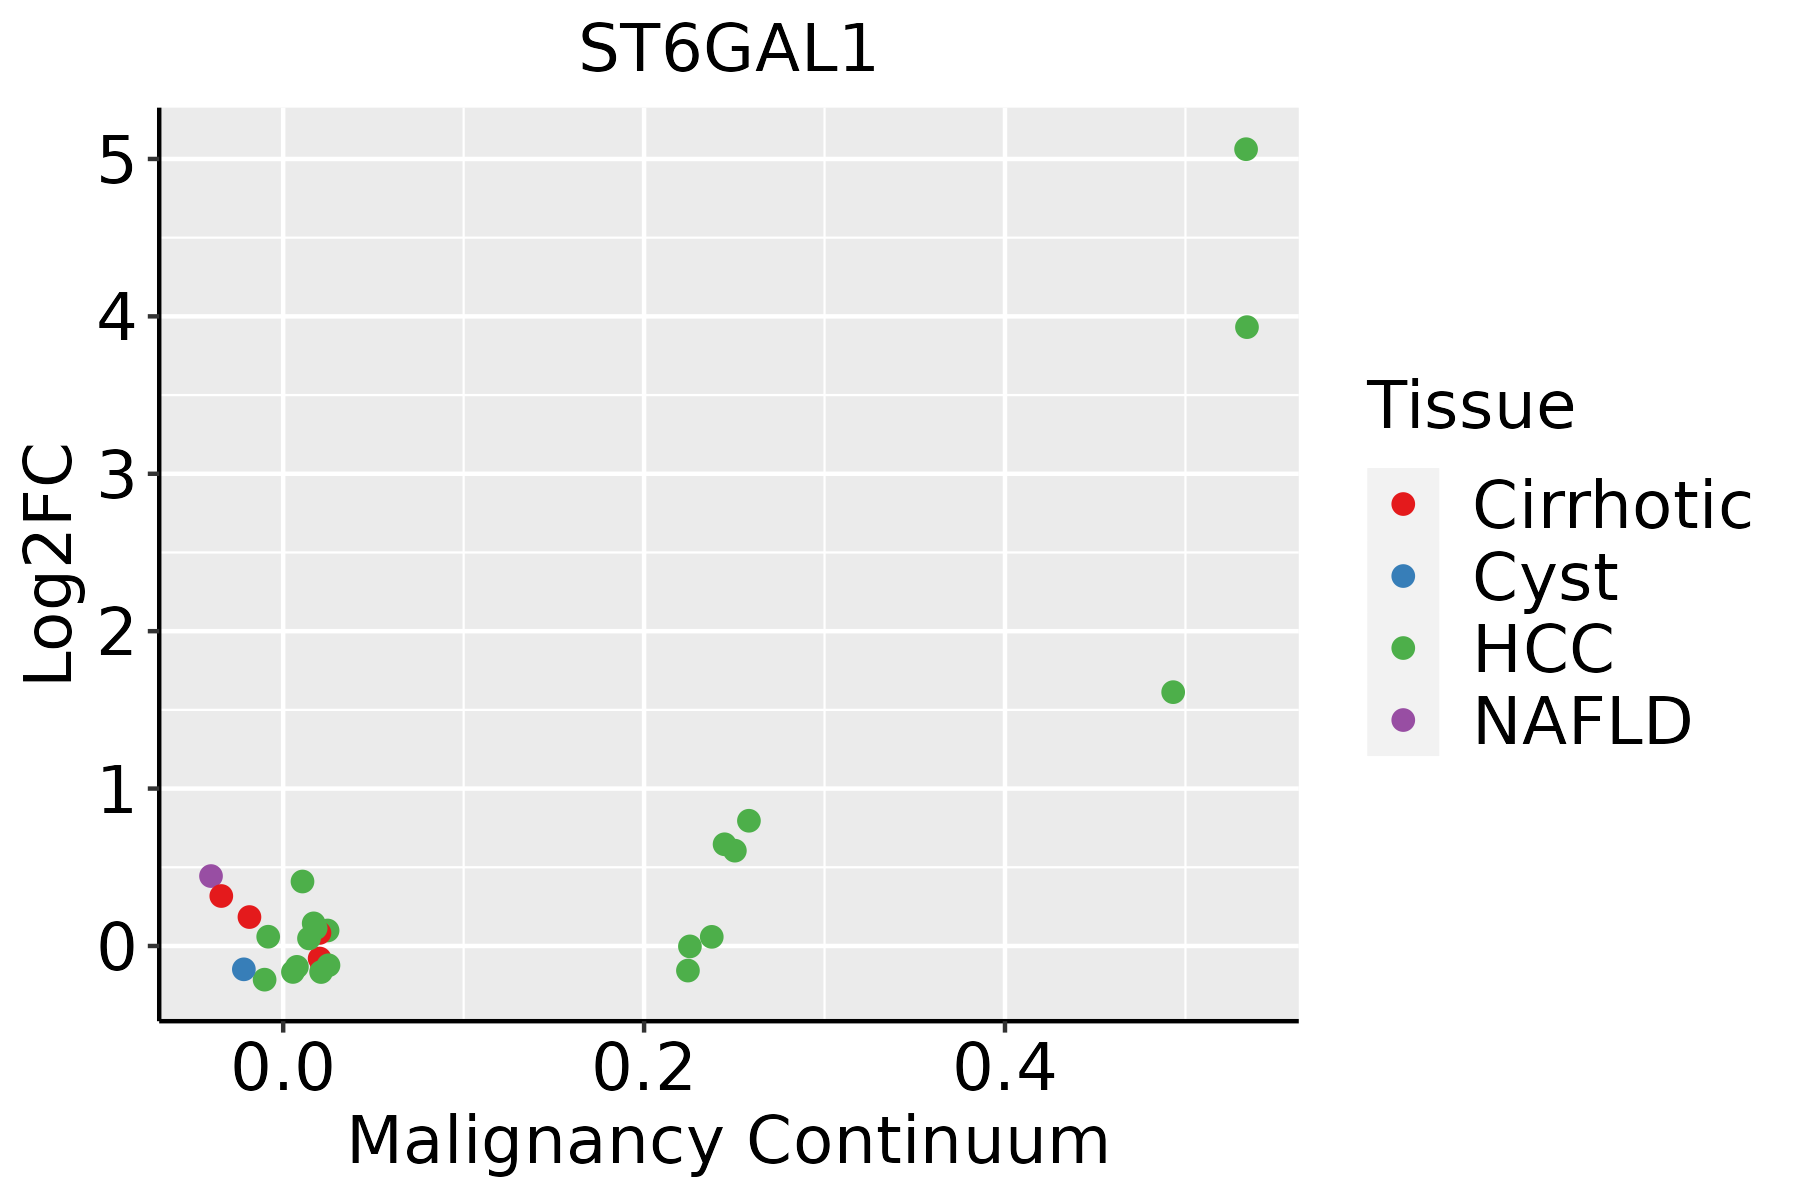 | HCC: Hepatocellular carcinoma |
| NAFLD: Non-alcoholic fatty liver disease | ||
| Lung |  | AAH: Atypical adenomatous hyperplasia |
| AIS: Adenocarcinoma in situ | ||
| IAC: Invasive lung adenocarcinoma | ||
| MIA: Minimally invasive adenocarcinoma | ||
| Oral Cavity | 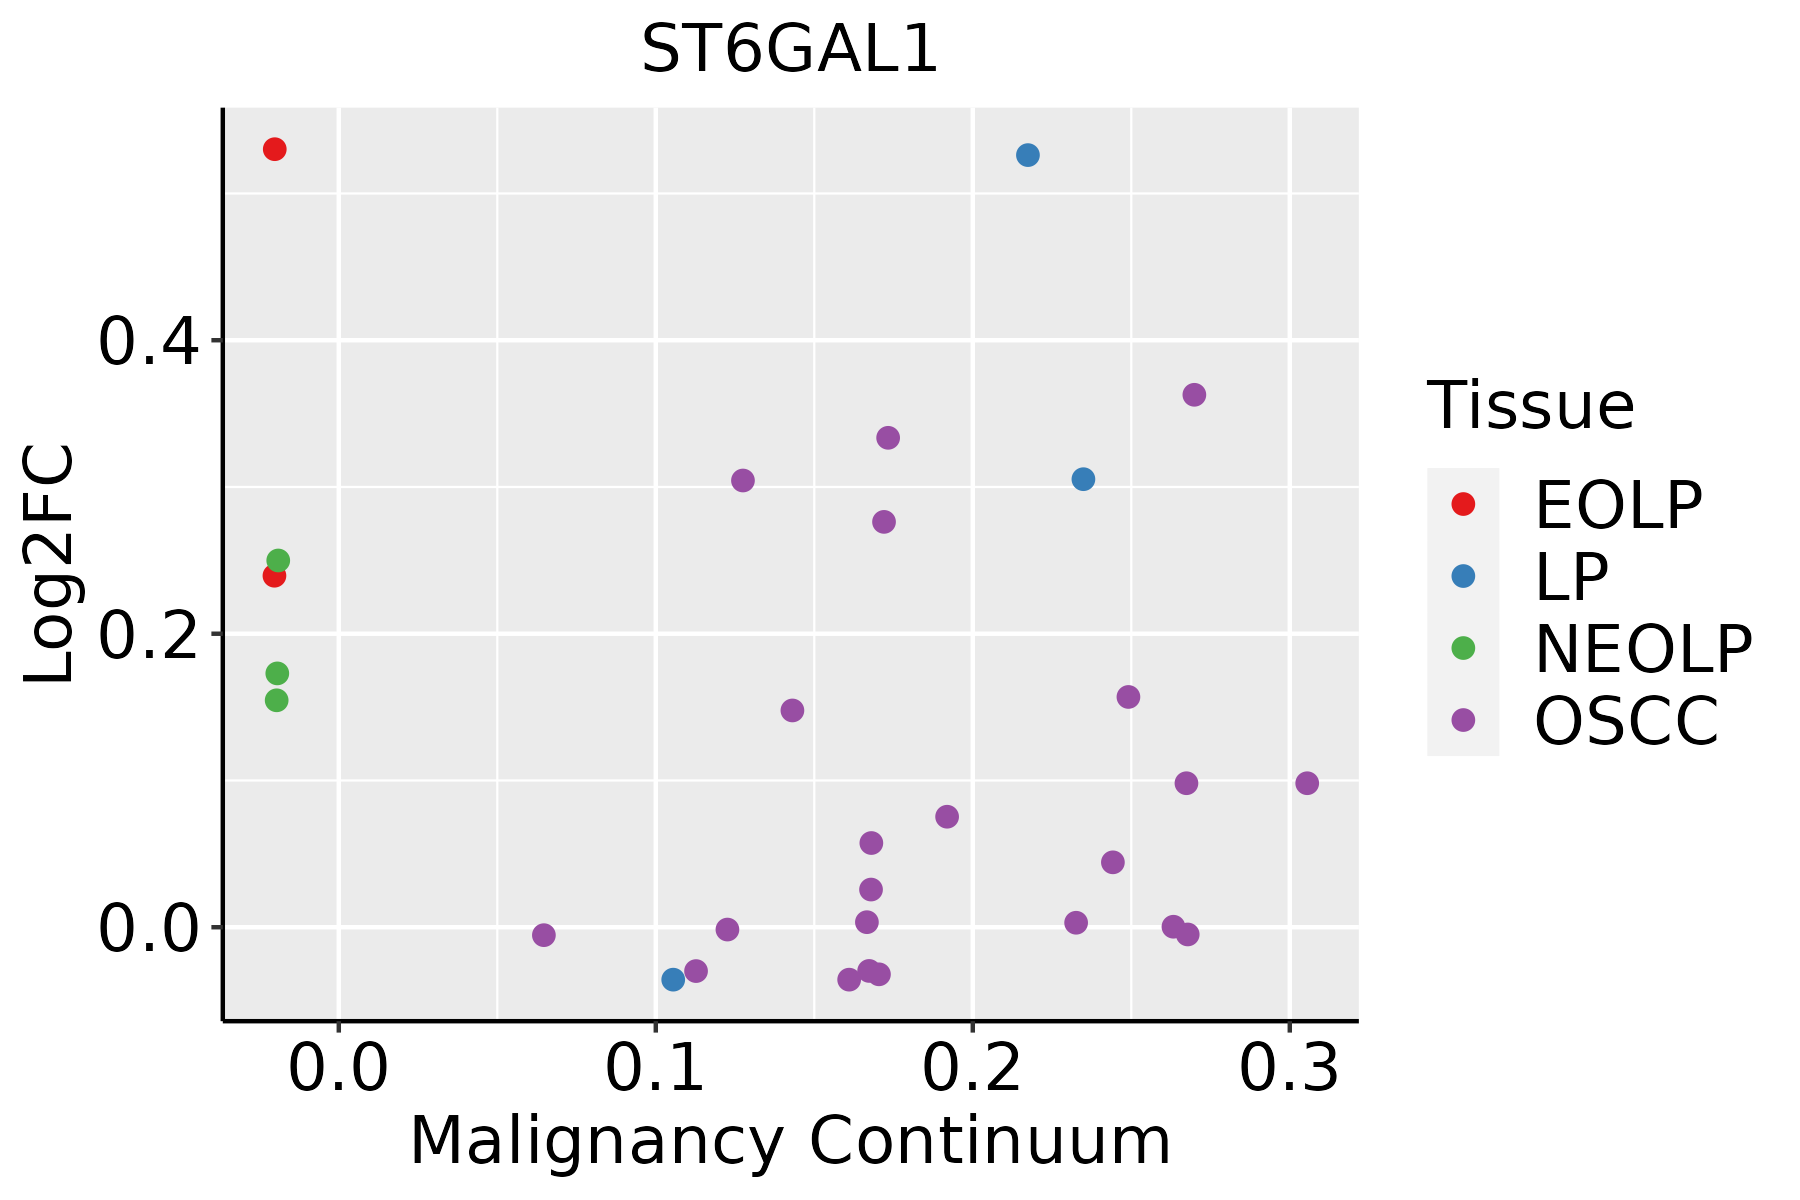 | EOLP: Erosive Oral lichen planus |
| LP: leukoplakia | ||
| NEOLP: Non-erosive oral lichen planus | ||
| OSCC: Oral squamous cell carcinoma | ||
| Prostate |  | BPH: Benign Prostatic Hyperplasia |
| ∗log2FC in expression of this searched gene in stem-like cells from each diseased tissue sample relative to stem-like cells in normal samples in each tissue plotted against the malignancy continuum. Samples are colored based on if they are from different disease stage. |
Top |
Malignant transformation related pathway analysis |
| Find out the enriched GO biological processes and KEGG pathways involved in transition from healthy to precancer to cancer |
| Tissue | Disease Stage | Enriched GO biological Processes |
| Colorectum | AD |  |
| Colorectum | SER |  |
| Colorectum | MSS |  |
| Colorectum | MSI-H |  |
| Colorectum | FAP |  |
| ∗Top 15 enriched GO BP terms are showed in the bar plot of each disease state in each tissue. Each row represents a significant GO biological process which is colored according to the -log10(p.adjust). |
| Page: 1 2 3 4 5 6 7 8 9 |
| GO ID | Tissue | Disease Stage | Description | Gene Ratio | Bg Ratio | pvalue | p.adjust | Count |
| GO:001603210 | Cervix | CC | viral process | 109/2311 | 415/18723 | 5.40e-15 | 6.46e-12 | 109 |
| GO:00190807 | Cervix | CC | viral gene expression | 21/2311 | 94/18723 | 4.68e-03 | 2.82e-02 | 21 |
| GO:00069597 | Cervix | CC | humoral immune response | 54/2311 | 317/18723 | 8.57e-03 | 4.42e-02 | 54 |
| GO:000695921 | Cervix | N_HPV | humoral immune response | 31/534 | 317/18723 | 2.53e-09 | 7.88e-07 | 31 |
| GO:001603225 | Cervix | N_HPV | viral process | 33/534 | 415/18723 | 1.23e-07 | 1.15e-05 | 33 |
| GO:001908012 | Cervix | N_HPV | viral gene expression | 9/534 | 94/18723 | 1.45e-03 | 1.54e-02 | 9 |
| GO:0016032 | Colorectum | AD | viral process | 168/3918 | 415/18723 | 4.67e-20 | 3.66e-17 | 168 |
| GO:0019080 | Colorectum | AD | viral gene expression | 42/3918 | 94/18723 | 1.90e-07 | 8.02e-06 | 42 |
| GO:0018279 | Colorectum | AD | protein N-linked glycosylation via asparagine | 15/3918 | 23/18723 | 5.47e-06 | 1.40e-04 | 15 |
| GO:0019082 | Colorectum | AD | viral protein processing | 17/3918 | 29/18723 | 1.04e-05 | 2.40e-04 | 17 |
| GO:0018196 | Colorectum | AD | peptidyl-asparagine modification | 15/3918 | 24/18723 | 1.18e-05 | 2.62e-04 | 15 |
| GO:0006487 | Colorectum | AD | protein N-linked glycosylation | 25/3918 | 65/18723 | 9.12e-04 | 8.71e-03 | 25 |
| GO:0006486 | Colorectum | AD | protein glycosylation | 64/3918 | 226/18723 | 4.86e-03 | 3.27e-02 | 64 |
| GO:0043413 | Colorectum | AD | macromolecule glycosylation | 64/3918 | 226/18723 | 4.86e-03 | 3.27e-02 | 64 |
| GO:0070085 | Colorectum | AD | glycosylation | 67/3918 | 240/18723 | 5.78e-03 | 3.67e-02 | 67 |
| GO:00160322 | Colorectum | MSS | viral process | 157/3467 | 415/18723 | 7.94e-21 | 6.19e-18 | 157 |
| GO:00190802 | Colorectum | MSS | viral gene expression | 41/3467 | 94/18723 | 1.74e-08 | 9.85e-07 | 41 |
| GO:00190821 | Colorectum | MSS | viral protein processing | 17/3467 | 29/18723 | 1.81e-06 | 5.70e-05 | 17 |
| GO:00182792 | Colorectum | MSS | protein N-linked glycosylation via asparagine | 13/3467 | 23/18723 | 5.21e-05 | 9.31e-04 | 13 |
| GO:00181962 | Colorectum | MSS | peptidyl-asparagine modification | 13/3467 | 24/18723 | 9.44e-05 | 1.49e-03 | 13 |
| Page: 1 2 3 4 5 6 |
| Pathway ID | Tissue | Disease Stage | Description | Gene Ratio | Bg Ratio | pvalue | p.adjust | qvalue | Count |
| hsa005102 | Colorectum | MSS | N-Glycan biosynthesis | 20/1875 | 53/8465 | 7.17e-03 | 2.83e-02 | 1.73e-02 | 20 |
| hsa005103 | Colorectum | MSS | N-Glycan biosynthesis | 20/1875 | 53/8465 | 7.17e-03 | 2.83e-02 | 1.73e-02 | 20 |
| hsa0051023 | Esophagus | ESCC | N-Glycan biosynthesis | 39/4205 | 53/8465 | 3.26e-04 | 1.15e-03 | 5.89e-04 | 39 |
| hsa0051033 | Esophagus | ESCC | N-Glycan biosynthesis | 39/4205 | 53/8465 | 3.26e-04 | 1.15e-03 | 5.89e-04 | 39 |
| hsa005104 | Liver | Cirrhotic | N-Glycan biosynthesis | 32/2530 | 53/8465 | 3.82e-06 | 4.10e-05 | 2.53e-05 | 32 |
| hsa0051011 | Liver | Cirrhotic | N-Glycan biosynthesis | 32/2530 | 53/8465 | 3.82e-06 | 4.10e-05 | 2.53e-05 | 32 |
| hsa0051021 | Liver | HCC | N-Glycan biosynthesis | 40/4020 | 53/8465 | 2.95e-05 | 1.87e-04 | 1.04e-04 | 40 |
| hsa0051031 | Liver | HCC | N-Glycan biosynthesis | 40/4020 | 53/8465 | 2.95e-05 | 1.87e-04 | 1.04e-04 | 40 |
| hsa0051022 | Oral cavity | LP | N-Glycan biosynthesis | 31/2418 | 53/8465 | 4.86e-06 | 4.14e-05 | 2.67e-05 | 31 |
| hsa0051032 | Oral cavity | LP | N-Glycan biosynthesis | 31/2418 | 53/8465 | 4.86e-06 | 4.14e-05 | 2.67e-05 | 31 |
| Page: 1 |
Top |
Cell-cell communication analysis |
| Identification of potential cell-cell interactions between two cell types and their ligand-receptor pairs for different disease states |
| Ligand | Receptor | LRpair | Pathway | Tissue | Disease Stage |
| Page: 1 |
Top |
Single-cell gene regulatory network inference analysis |
| Find out the significant the regulons (TFs) and the target genes of each regulon across cell types for different disease states |
| TF | Cell Type | Tissue | Disease Stage | Target Gene | RSS | Regulon Activity |
| ∗The dot plots of a searched regulon are shown for all cell subpopulations in each disease state of each tissue based on the regulon specific score inferred using pySCENIC and by calculating the average expression. |
| Page: 1 |
Top |
Somatic mutation of malignant transformation related genes |
| Annotation of somatic variants for genes involved in malignant transformation |
| Hugo Symbol | Variant Class | Variant Classification | dbSNP RS | HGVSc | HGVSp | HGVSp Short | SWISSPROT | BIOTYPE | SIFT | PolyPhen | Tumor Sample Barcode | Tissue | Histology | Sex | Age | Stage | Therapy Types | Drugs | Outcome |
| ST6GAL1 | SNV | Missense_Mutation | c.1123N>A | p.Glu375Lys | p.E375K | P15907 | protein_coding | probably_damaging(1) | TCGA-AC-A23H-01 | Breast | breast invasive carcinoma | Female | >=65 | I/II | Unknown | Unknown | PD | ||
| ST6GAL1 | SNV | Missense_Mutation | c.499N>T | p.Gly167Cys | p.G167C | P15907 | protein_coding | probably_damaging(0.932) | TCGA-AN-A0AK-01 | Breast | breast invasive carcinoma | Female | >=65 | I/II | Unknown | Unknown | SD | ||
| ST6GAL1 | insertion | Frame_Shift_Ins | novel | c.485_486insACTGCTGTCCACGTTCAAAGCCCAAATTGAGT | p.Ser163LeufsTer42 | p.S163Lfs*42 | P15907 | protein_coding | TCGA-A8-A07P-01 | Breast | breast invasive carcinoma | Female | >=65 | I/II | Chemotherapy | 5-fluorouracil | SD | ||
| ST6GAL1 | insertion | Frame_Shift_Ins | novel | c.944_945insTCAGAAAATGAGGGCC | p.Glu315AspfsTer27 | p.E315Dfs*27 | P15907 | protein_coding | TCGA-BH-A0HK-01 | Breast | breast invasive carcinoma | Female | >=65 | I/II | Hormone Therapy | arimidex | SD | ||
| ST6GAL1 | SNV | Missense_Mutation | c.52C>T | p.Leu18Phe | p.L18F | P15907 | protein_coding | benign(0.01) | TCGA-EK-A2IP-01 | Cervix | cervical & endocervical cancer | Female | <65 | I/II | Unknown | Unknown | SD | ||
| ST6GAL1 | SNV | Missense_Mutation | c.1004N>A | p.Cys335Tyr | p.C335Y | P15907 | protein_coding | probably_damaging(1) | TCGA-IR-A3LH-01 | Cervix | cervical & endocervical cancer | Female | <65 | I/II | Chemotherapy | cisplatin | CR | ||
| ST6GAL1 | SNV | Missense_Mutation | novel | c.90G>C | p.Lys30Asn | p.K30N | P15907 | protein_coding | possibly_damaging(0.654) | TCGA-VS-A94X-01 | Cervix | cervical & endocervical cancer | Female | <65 | I/II | Chemotherapy | cisplatin | PD | |
| ST6GAL1 | SNV | Missense_Mutation | novel | c.164N>T | p.Ala55Val | p.A55V | P15907 | protein_coding | benign(0.036) | TCGA-VS-A94Z-01 | Cervix | cervical & endocervical cancer | Female | <65 | I/II | Chemotherapy | cisplatin | CR | |
| ST6GAL1 | SNV | Missense_Mutation | rs138824619 | c.421N>T | p.Arg141Cys | p.R141C | P15907 | protein_coding | possibly_damaging(0.601) | TCGA-VS-A9U6-01 | Cervix | cervical & endocervical cancer | Female | <65 | I/II | Chemotherapy | cisplatin | PD | |
| ST6GAL1 | SNV | Missense_Mutation | novel | c.188N>C | p.Val63Ala | p.V63A | P15907 | protein_coding | benign(0) | TCGA-AA-3663-01 | Colorectum | colon adenocarcinoma | Male | <65 | I/II | Unknown | Unknown | SD |
| Page: 1 2 3 4 5 |
Top |
Related drugs of malignant transformation related genes |
| Identification of chemicals and drugs interact with genes involved in malignant transfromation |
| (DGIdb 4.0) |
| Entrez ID | Symbol | Category | Interaction Types | Drug Claim Name | Drug Name | PMIDs |
| 6480 | ST6GAL1 | DRUGGABLE GENOME | flucloxacillin | FLOXACILLIN | 19483685 |
| Page: 1 |

Copyright 2023-Present -The University of Texas Health Science Center at Houston |