
|
|||||
|
 | |
| |
| |
| |
| |
| |
|
Gene: ST5 |
Gene summary for ST5 |
| Gene information | Species | Human | Gene symbol | ST5 | Gene ID | 6764 |
| Gene name | DENN domain containing 2B | |
| Gene Alias | HTS1 | |
| Cytomap | 11p15.4 | |
| Gene Type | protein-coding | GO ID | GO:0000165 | UniProtAcc | P78524 |
Top |
Malignant transformation analysis |
| Identification of the aberrant gene expression in precancerous and cancerous lesions by comparing the gene expression of stem-like cells in diseased tissues with normal stem cells |
| Entrez ID | Symbol | Replicates | Species | Organ | Tissue | Adj P-value | Log2FC | Malignancy |
| 6764 | ST5 | CCI_1 | Human | Cervix | CC | 1.49e-06 | 3.79e-01 | 0.528 |
| 6764 | ST5 | CCI_2 | Human | Cervix | CC | 1.84e-19 | 1.47e+00 | 0.5249 |
| 6764 | ST5 | CCI_3 | Human | Cervix | CC | 1.69e-22 | 1.08e+00 | 0.516 |
| 6764 | ST5 | CCII_1 | Human | Cervix | CC | 6.81e-14 | 3.89e-01 | 0.3249 |
| 6764 | ST5 | Tumor | Human | Cervix | CC | 3.62e-22 | 3.56e-01 | 0.1241 |
| 6764 | ST5 | sample3 | Human | Cervix | CC | 8.56e-25 | 3.48e-01 | 0.1387 |
| 6764 | ST5 | H2 | Human | Cervix | HSIL_HPV | 1.95e-07 | 2.05e-01 | 0.0632 |
| 6764 | ST5 | T1 | Human | Cervix | CC | 1.64e-07 | 2.17e-01 | 0.0918 |
| 6764 | ST5 | T3 | Human | Cervix | CC | 8.06e-30 | 3.80e-01 | 0.1389 |
| 6764 | ST5 | HTA11_3410_2000001011 | Human | Colorectum | AD | 3.12e-20 | -5.54e-01 | 0.0155 |
| 6764 | ST5 | HTA11_2487_2000001011 | Human | Colorectum | SER | 1.15e-11 | -5.54e-01 | -0.1808 |
| 6764 | ST5 | HTA11_1938_2000001011 | Human | Colorectum | AD | 1.20e-08 | -5.54e-01 | -0.0811 |
| 6764 | ST5 | HTA11_78_2000001011 | Human | Colorectum | AD | 6.98e-14 | -5.54e-01 | -0.1088 |
| 6764 | ST5 | HTA11_347_2000001011 | Human | Colorectum | AD | 8.95e-22 | -5.54e-01 | -0.1954 |
| 6764 | ST5 | HTA11_3361_2000001011 | Human | Colorectum | AD | 5.14e-09 | -5.54e-01 | -0.1207 |
| 6764 | ST5 | HTA11_83_2000001011 | Human | Colorectum | SER | 5.03e-07 | -5.54e-01 | -0.1526 |
| 6764 | ST5 | HTA11_696_2000001011 | Human | Colorectum | AD | 5.24e-29 | -5.54e-01 | -0.1464 |
| 6764 | ST5 | HTA11_866_2000001011 | Human | Colorectum | AD | 5.24e-29 | -5.54e-01 | -0.1001 |
| 6764 | ST5 | HTA11_1391_2000001011 | Human | Colorectum | AD | 2.93e-16 | -5.54e-01 | -0.059 |
| 6764 | ST5 | HTA11_2992_2000001011 | Human | Colorectum | SER | 1.24e-02 | -5.54e-01 | -0.1706 |
| Page: 1 2 3 4 5 6 7 8 9 10 |
| Tissue | Expression Dynamics | Abbreviation |
| Cervix |  | CC: Cervix cancer |
| HSIL_HPV: HPV-infected high-grade squamous intraepithelial lesions | ||
| N_HPV: HPV-infected normal cervix | ||
| Colorectum (GSE201348) |  | FAP: Familial adenomatous polyposis |
| CRC: Colorectal cancer | ||
| Colorectum (HTA11) |  | AD: Adenomas |
| SER: Sessile serrated lesions | ||
| MSI-H: Microsatellite-high colorectal cancer | ||
| MSS: Microsatellite stable colorectal cancer | ||
| Esophagus |  | ESCC: Esophageal squamous cell carcinoma |
| HGIN: High-grade intraepithelial neoplasias | ||
| LGIN: Low-grade intraepithelial neoplasias | ||
| Liver |  | HCC: Hepatocellular carcinoma |
| NAFLD: Non-alcoholic fatty liver disease | ||
| Lung | 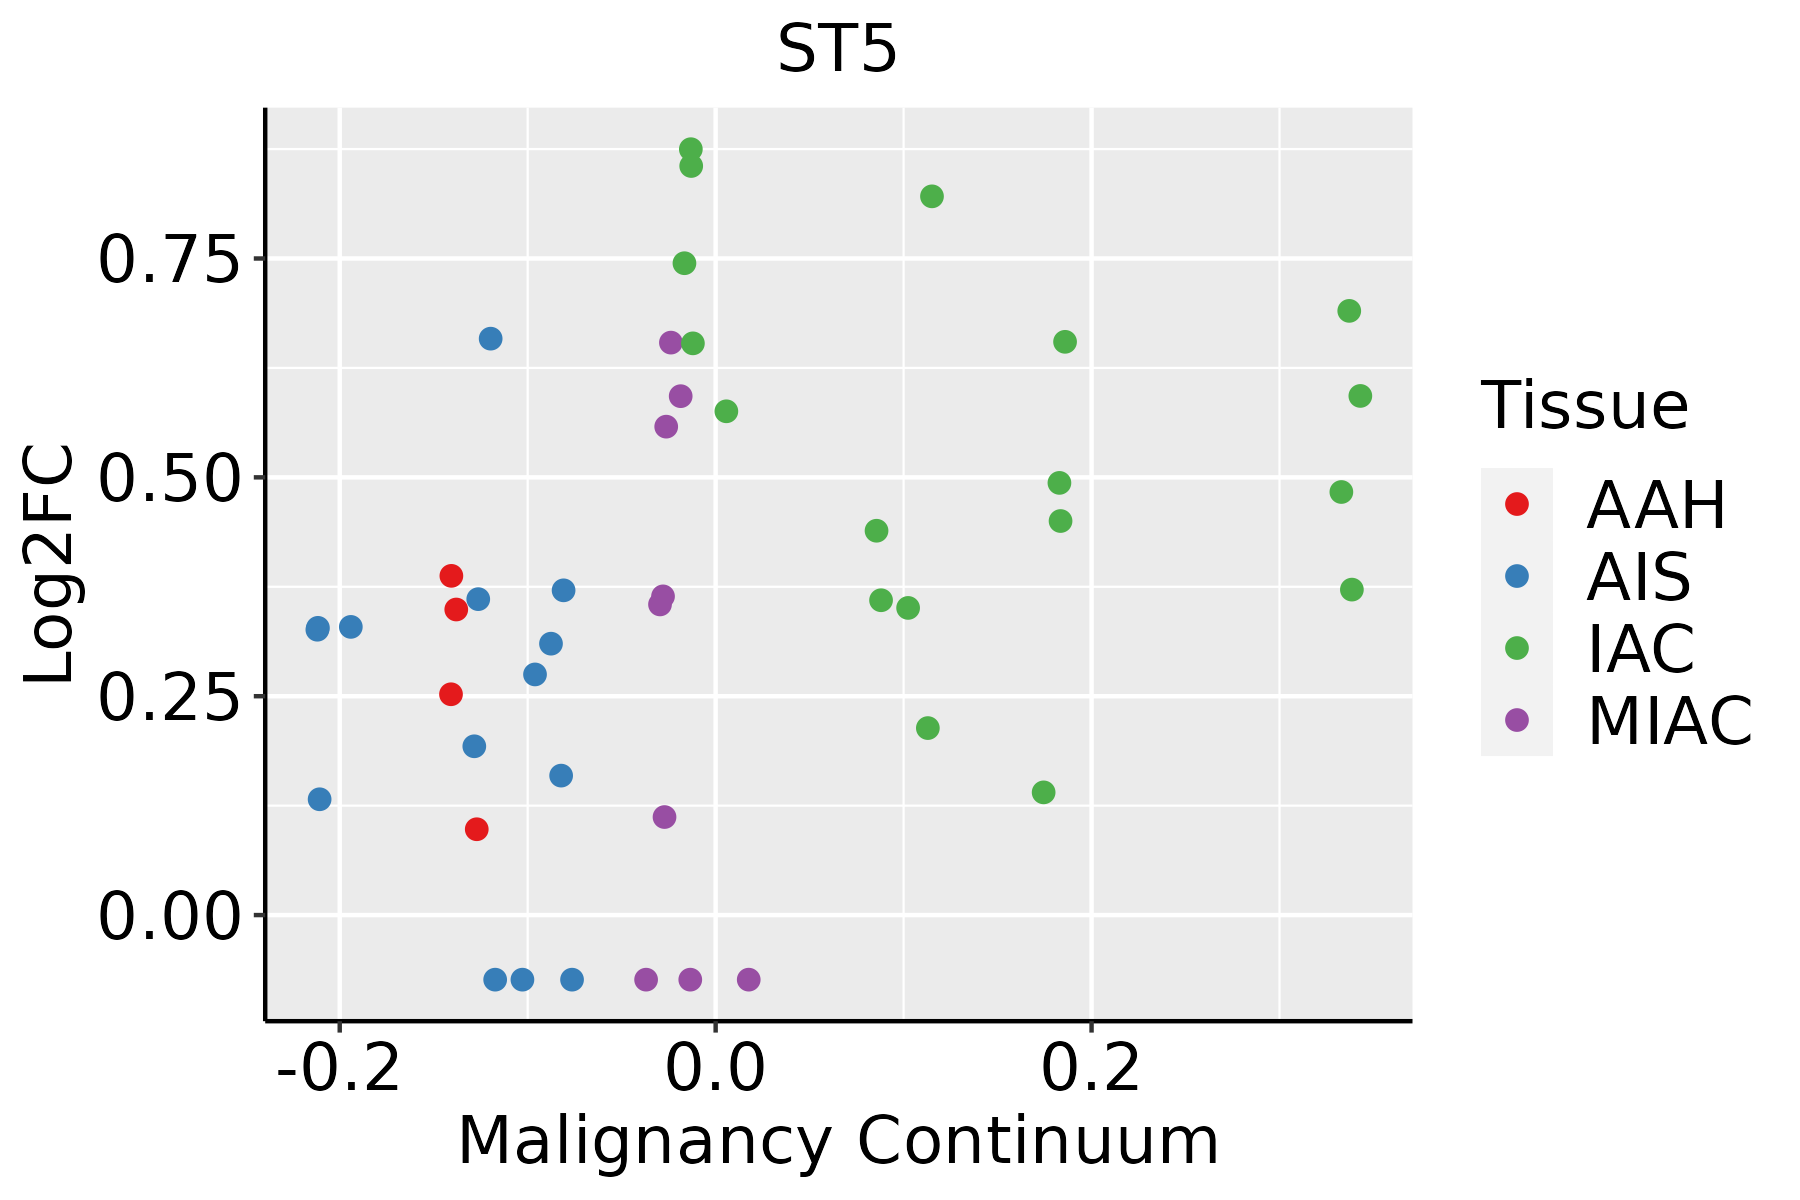 | AAH: Atypical adenomatous hyperplasia |
| AIS: Adenocarcinoma in situ | ||
| IAC: Invasive lung adenocarcinoma | ||
| MIA: Minimally invasive adenocarcinoma | ||
| Oral Cavity | 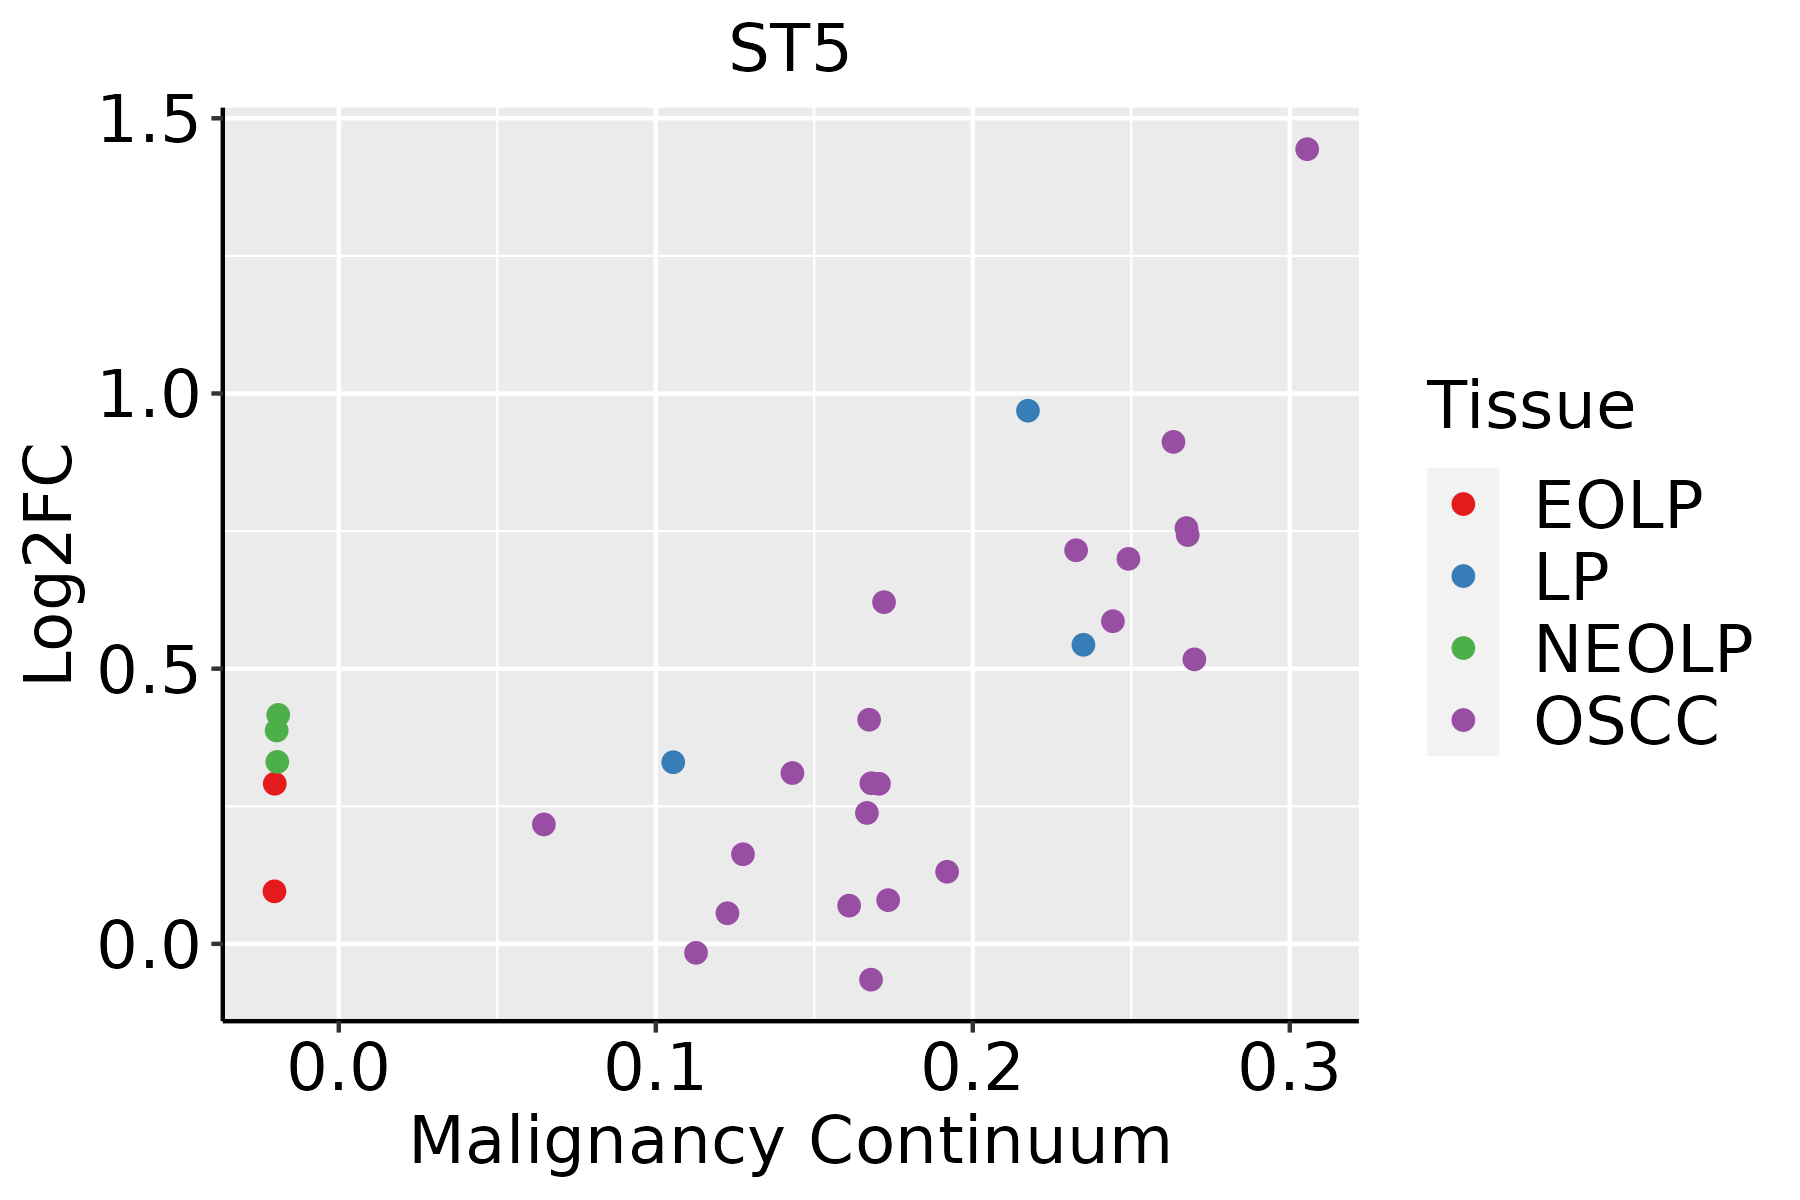 | EOLP: Erosive Oral lichen planus |
| LP: leukoplakia | ||
| NEOLP: Non-erosive oral lichen planus | ||
| OSCC: Oral squamous cell carcinoma | ||
| Skin |  | AK: Actinic keratosis |
| cSCC: Cutaneous squamous cell carcinoma | ||
| SCCIS:squamous cell carcinoma in situ | ||
| Thyroid |  | ATC: Anaplastic thyroid cancer |
| HT: Hashimoto's thyroiditis | ||
| PTC: Papillary thyroid cancer |
| ∗log2FC in expression of this searched gene in stem-like cells from each diseased tissue sample relative to stem-like cells in normal samples in each tissue plotted against the malignancy continuum. Samples are colored based on if they are from different disease stage. |
Top |
Malignant transformation related pathway analysis |
| Find out the enriched GO biological processes and KEGG pathways involved in transition from healthy to precancer to cancer |
| Tissue | Disease Stage | Enriched GO biological Processes |
| Colorectum | AD |  |
| Colorectum | SER |  |
| Colorectum | MSS |  |
| Colorectum | MSI-H |  |
| Colorectum | FAP |  |
| ∗Top 15 enriched GO BP terms are showed in the bar plot of each disease state in each tissue. Each row represents a significant GO biological process which is colored according to the -log10(p.adjust). |
| Page: 1 2 3 4 5 6 7 8 9 |
| GO ID | Tissue | Disease Stage | Description | Gene Ratio | Bg Ratio | pvalue | p.adjust | Count |
| GO:005254714 | Breast | IDC | regulation of peptidase activity | 96/1434 | 461/18723 | 7.58e-20 | 6.15e-17 | 96 |
| GO:005254814 | Breast | IDC | regulation of endopeptidase activity | 88/1434 | 432/18723 | 1.20e-17 | 4.85e-15 | 88 |
| GO:004586114 | Breast | IDC | negative regulation of proteolysis | 70/1434 | 351/18723 | 8.21e-14 | 2.22e-11 | 70 |
| GO:005134613 | Breast | IDC | negative regulation of hydrolase activity | 71/1434 | 379/18723 | 1.33e-12 | 2.90e-10 | 71 |
| GO:001046613 | Breast | IDC | negative regulation of peptidase activity | 56/1434 | 262/18723 | 1.39e-12 | 2.92e-10 | 56 |
| GO:001095112 | Breast | IDC | negative regulation of endopeptidase activity | 52/1434 | 252/18723 | 3.53e-11 | 5.57e-09 | 52 |
| GO:00067903 | Stomach | GC | sulfur compound metabolic process | 35/1159 | 339/18723 | 2.10e-03 | 2.10e-02 | 35 |
| Page: 1 |
| Pathway ID | Tissue | Disease Stage | Description | Gene Ratio | Bg Ratio | pvalue | p.adjust | qvalue | Count |
| Page: 1 |
Top |
Cell-cell communication analysis |
| Identification of potential cell-cell interactions between two cell types and their ligand-receptor pairs for different disease states |
| Ligand | Receptor | LRpair | Pathway | Tissue | Disease Stage |
| Page: 1 |
Top |
Single-cell gene regulatory network inference analysis |
| Find out the significant the regulons (TFs) and the target genes of each regulon across cell types for different disease states |
| TF | Cell Type | Tissue | Disease Stage | Target Gene | RSS | Regulon Activity |
| ∗The dot plots of a searched regulon are shown for all cell subpopulations in each disease state of each tissue based on the regulon specific score inferred using pySCENIC and by calculating the average expression. |
| Page: 1 |
Top |
Somatic mutation of malignant transformation related genes |
| Annotation of somatic variants for genes involved in malignant transformation |
| Hugo Symbol | Variant Class | Variant Classification | dbSNP RS | HGVSc | HGVSp | HGVSp Short | SWISSPROT | BIOTYPE | SIFT | PolyPhen | Tumor Sample Barcode | Tissue | Histology | Sex | Age | Stage | Therapy Types | Drugs | Outcome |
| ST5 | SNV | Missense_Mutation | c.2345G>A | p.Arg782His | p.R782H | P78524 | protein_coding | deleterious(0.01) | probably_damaging(0.993) | TCGA-A8-A0A9-01 | Breast | breast invasive carcinoma | Female | >=65 | I/II | Hormone Therapy | anastrozole | SD | |
| ST5 | SNV | Missense_Mutation | novel | c.2801N>A | p.Pro934Gln | p.P934Q | P78524 | protein_coding | deleterious(0) | probably_damaging(1) | TCGA-AC-A8OQ-01 | Breast | breast invasive carcinoma | Female | >=65 | I/II | Unknown | Unknown | SD |
| ST5 | SNV | Missense_Mutation | novel | c.170A>C | p.Tyr57Ser | p.Y57S | P78524 | protein_coding | tolerated_low_confidence(0.19) | benign(0) | TCGA-AO-A0J9-01 | Breast | breast invasive carcinoma | Female | <65 | III/IV | Chemotherapy | cyclophosphamide | PD |
| ST5 | SNV | Missense_Mutation | novel | c.2704N>T | p.Val902Leu | p.V902L | P78524 | protein_coding | tolerated(0.05) | benign(0.006) | TCGA-B6-A0I8-01 | Breast | breast invasive carcinoma | Female | <65 | I/II | Unknown | Unknown | PD |
| ST5 | SNV | Missense_Mutation | rs145873502 | c.2450N>A | p.Arg817His | p.R817H | P78524 | protein_coding | deleterious(0) | possibly_damaging(0.804) | TCGA-BH-A0BQ-01 | Breast | breast invasive carcinoma | Female | <65 | I/II | Unknown | Unknown | PD |
| ST5 | SNV | Missense_Mutation | novel | c.2425N>C | p.Ser809Pro | p.S809P | P78524 | protein_coding | deleterious(0) | possibly_damaging(0.857) | TCGA-BH-A1F0-01 | Breast | breast invasive carcinoma | Female | >=65 | I/II | Unknown | Unknown | PD |
| ST5 | SNV | Missense_Mutation | novel | c.380N>A | p.Gly127Glu | p.G127E | P78524 | protein_coding | tolerated_low_confidence(0.1) | benign(0) | TCGA-D8-A3Z6-01 | Breast | breast invasive carcinoma | Female | <65 | III/IV | Chemotherapy | cyclophosphane | SD |
| ST5 | SNV | Missense_Mutation | c.282N>G | p.Phe94Leu | p.F94L | P78524 | protein_coding | tolerated_low_confidence(1) | benign(0) | TCGA-GM-A2D9-01 | Breast | breast invasive carcinoma | Female | >=65 | I/II | Hormone Therapy | arimidex | SD | |
| ST5 | insertion | Nonsense_Mutation | novel | c.1330_1331insACAATGCCCGCTGCCAGAGATTTTAGAAC | p.Ser444TyrfsTer9 | p.S444Yfs*9 | P78524 | protein_coding | TCGA-BH-A0HK-01 | Breast | breast invasive carcinoma | Female | >=65 | I/II | Hormone Therapy | arimidex | SD | ||
| ST5 | deletion | Frame_Shift_Del | novel | c.2849delN | p.Gly950AlafsTer10 | p.G950Afs*10 | P78524 | protein_coding | TCGA-D8-A27V-01 | Breast | breast invasive carcinoma | Female | <65 | I/II | Hormone Therapy | tamoxiphen | SD |
| Page: 1 2 3 4 5 6 7 8 9 10 11 12 13 14 |
Top |
Related drugs of malignant transformation related genes |
| Identification of chemicals and drugs interact with genes involved in malignant transfromation |
| (DGIdb 4.0) |
| Entrez ID | Symbol | Category | Interaction Types | Drug Claim Name | Drug Name | PMIDs |
| Page: 1 |

Copyright 2023-Present -The University of Texas Health Science Center at Houston |