
|
|||||
|
 | |
| |
| |
| |
| |
| |
|
Gene: ST3GAL4 |
Gene summary for ST3GAL4 |
| Gene information | Species | Human | Gene symbol | ST3GAL4 | Gene ID | 6484 |
| Gene name | ST3 beta-galactoside alpha-2,3-sialyltransferase 4 | |
| Gene Alias | CGS23 | |
| Cytomap | 11q24.2 | |
| Gene Type | protein-coding | GO ID | GO:0002376 | UniProtAcc | Q11206 |
Top |
Malignant transformation analysis |
| Identification of the aberrant gene expression in precancerous and cancerous lesions by comparing the gene expression of stem-like cells in diseased tissues with normal stem cells |
| Entrez ID | Symbol | Replicates | Species | Organ | Tissue | Adj P-value | Log2FC | Malignancy |
| 6484 | ST3GAL4 | LZE4T | Human | Esophagus | ESCC | 2.50e-05 | 1.58e-01 | 0.0811 |
| 6484 | ST3GAL4 | LZE5T | Human | Esophagus | ESCC | 6.94e-03 | 2.86e-01 | 0.0514 |
| 6484 | ST3GAL4 | LZE24T | Human | Esophagus | ESCC | 2.78e-04 | 7.44e-02 | 0.0596 |
| 6484 | ST3GAL4 | P2T-E | Human | Esophagus | ESCC | 2.86e-79 | 1.40e+00 | 0.1177 |
| 6484 | ST3GAL4 | P4T-E | Human | Esophagus | ESCC | 1.07e-10 | 2.77e-01 | 0.1323 |
| 6484 | ST3GAL4 | P5T-E | Human | Esophagus | ESCC | 9.67e-05 | 6.86e-02 | 0.1327 |
| 6484 | ST3GAL4 | P8T-E | Human | Esophagus | ESCC | 1.91e-23 | 5.28e-01 | 0.0889 |
| 6484 | ST3GAL4 | P9T-E | Human | Esophagus | ESCC | 4.59e-07 | 2.76e-01 | 0.1131 |
| 6484 | ST3GAL4 | P10T-E | Human | Esophagus | ESCC | 2.85e-13 | 2.39e-01 | 0.116 |
| 6484 | ST3GAL4 | P11T-E | Human | Esophagus | ESCC | 1.91e-31 | 9.88e-01 | 0.1426 |
| 6484 | ST3GAL4 | P12T-E | Human | Esophagus | ESCC | 8.65e-12 | 3.96e-01 | 0.1122 |
| 6484 | ST3GAL4 | P15T-E | Human | Esophagus | ESCC | 1.05e-14 | 3.26e-01 | 0.1149 |
| 6484 | ST3GAL4 | P16T-E | Human | Esophagus | ESCC | 3.26e-47 | 1.17e+00 | 0.1153 |
| 6484 | ST3GAL4 | P17T-E | Human | Esophagus | ESCC | 5.84e-04 | 3.79e-01 | 0.1278 |
| 6484 | ST3GAL4 | P19T-E | Human | Esophagus | ESCC | 1.38e-09 | 8.57e-01 | 0.1662 |
| 6484 | ST3GAL4 | P21T-E | Human | Esophagus | ESCC | 3.00e-36 | 9.39e-01 | 0.1617 |
| 6484 | ST3GAL4 | P22T-E | Human | Esophagus | ESCC | 5.95e-08 | 1.57e-01 | 0.1236 |
| 6484 | ST3GAL4 | P24T-E | Human | Esophagus | ESCC | 9.75e-18 | 4.32e-01 | 0.1287 |
| 6484 | ST3GAL4 | P26T-E | Human | Esophagus | ESCC | 9.48e-15 | 2.04e-01 | 0.1276 |
| 6484 | ST3GAL4 | P27T-E | Human | Esophagus | ESCC | 5.30e-14 | 4.61e-01 | 0.1055 |
| Page: 1 2 3 4 |
| Tissue | Expression Dynamics | Abbreviation |
| Esophagus |  | ESCC: Esophageal squamous cell carcinoma |
| HGIN: High-grade intraepithelial neoplasias | ||
| LGIN: Low-grade intraepithelial neoplasias | ||
| Liver |  | HCC: Hepatocellular carcinoma |
| NAFLD: Non-alcoholic fatty liver disease | ||
| Oral Cavity | 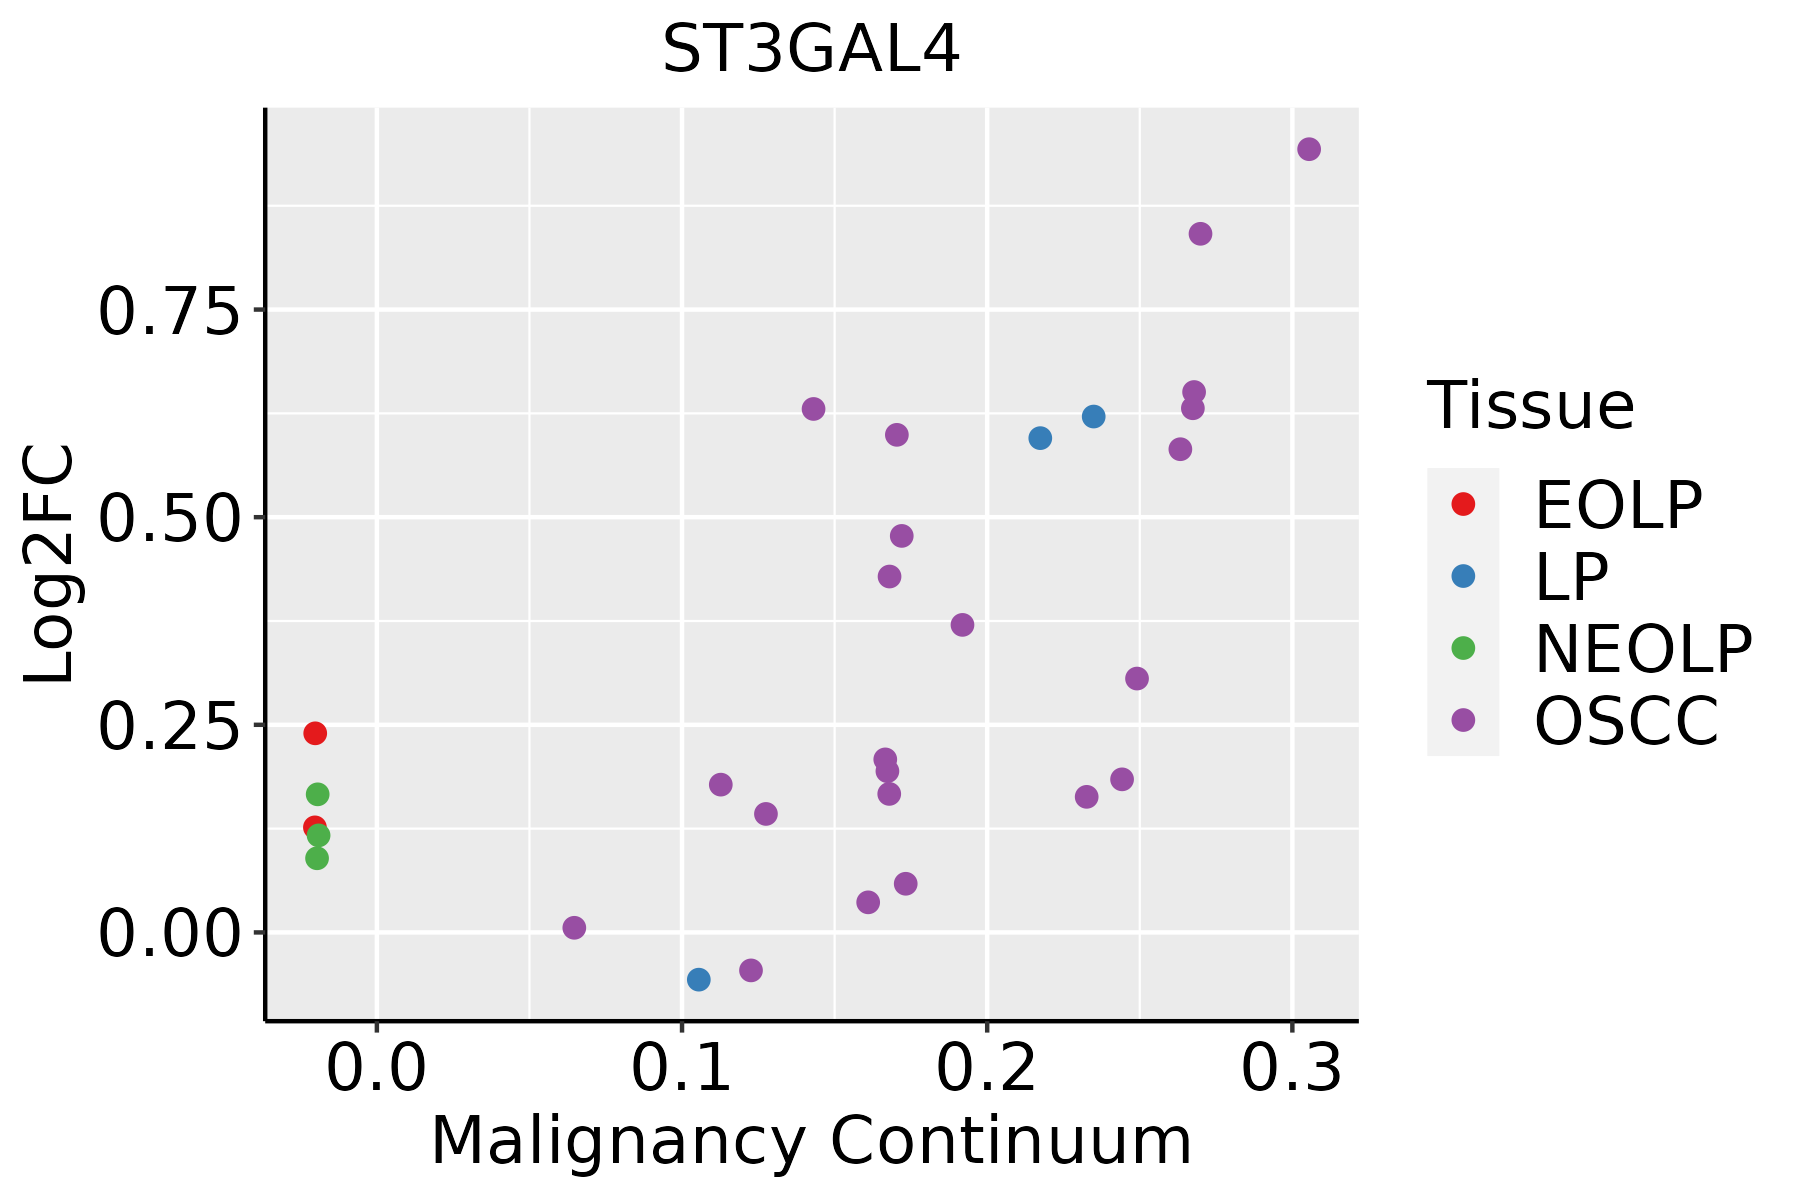 | EOLP: Erosive Oral lichen planus |
| LP: leukoplakia | ||
| NEOLP: Non-erosive oral lichen planus | ||
| OSCC: Oral squamous cell carcinoma | ||
| Thyroid | 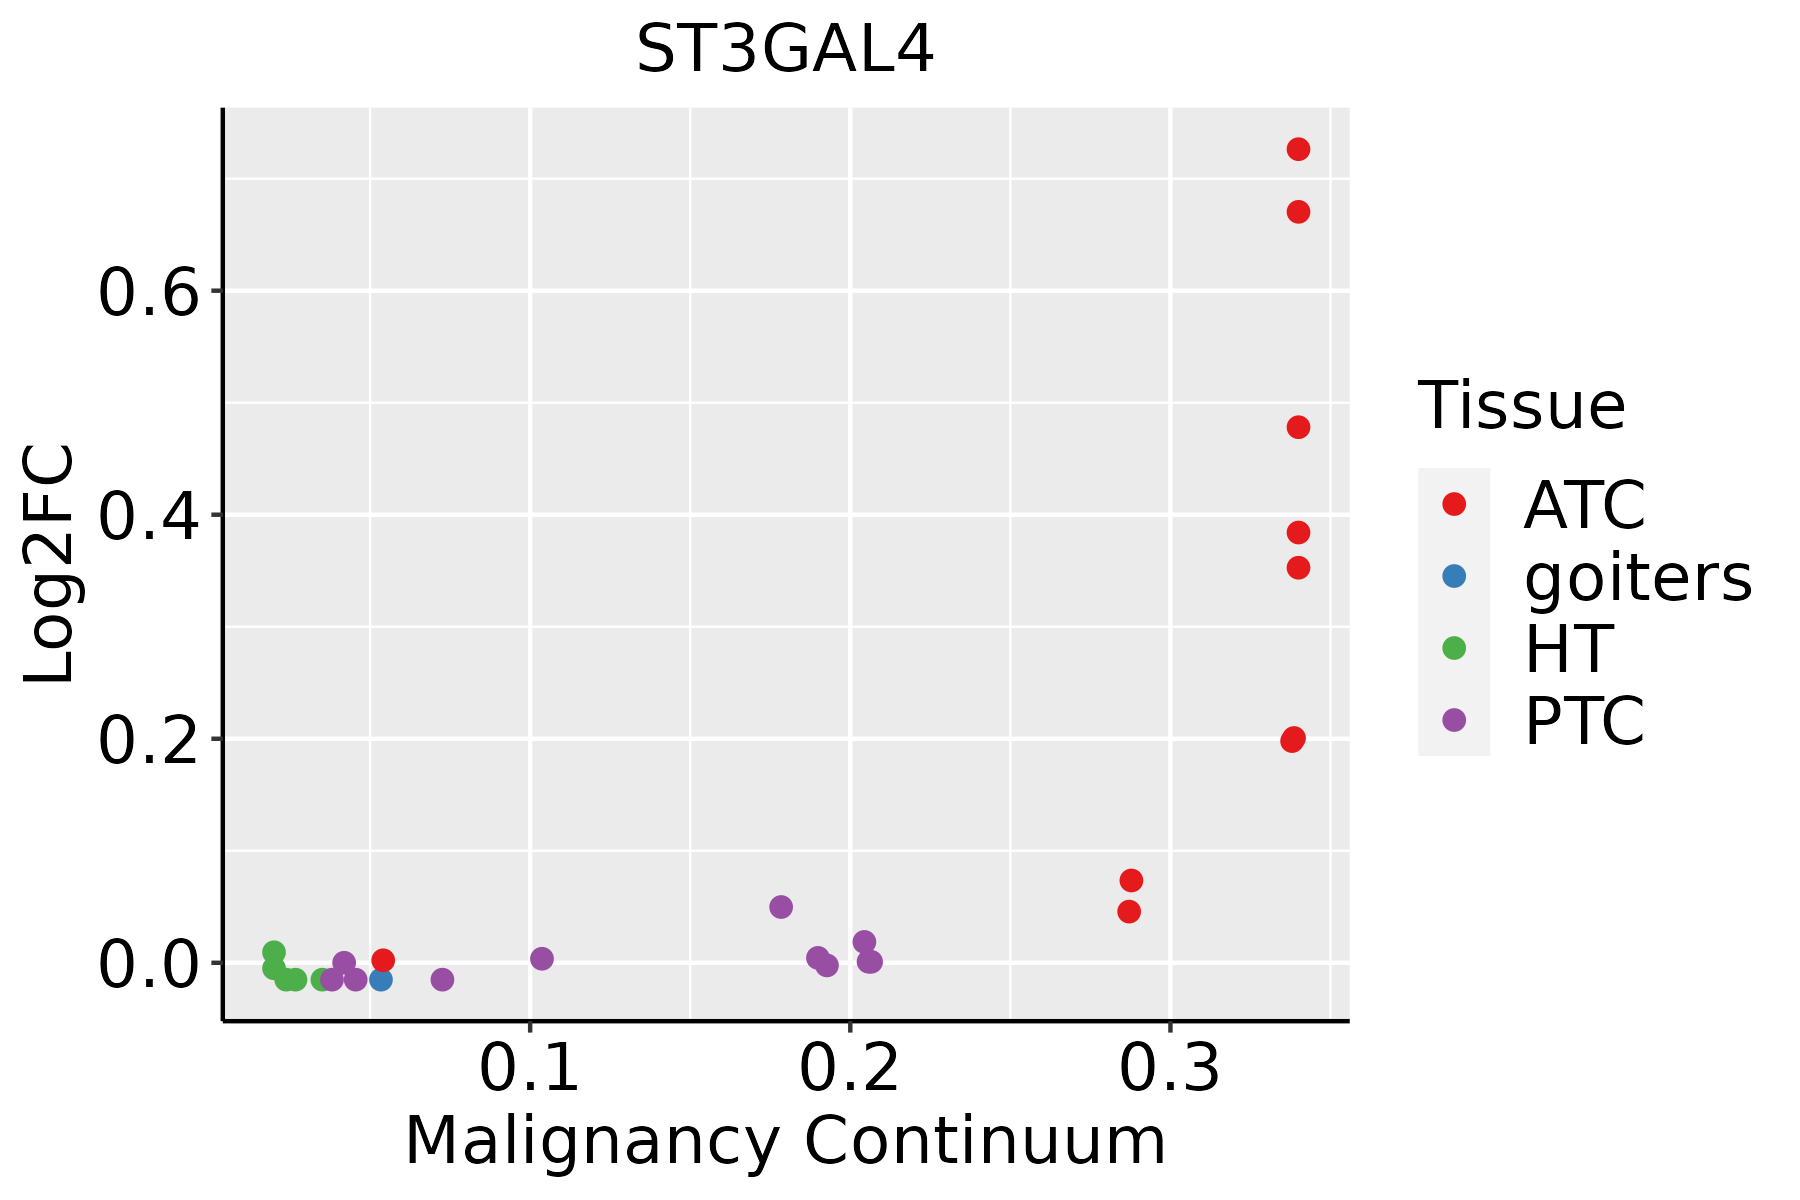 | ATC: Anaplastic thyroid cancer |
| HT: Hashimoto's thyroiditis | ||
| PTC: Papillary thyroid cancer |
| ∗log2FC in expression of this searched gene in stem-like cells from each diseased tissue sample relative to stem-like cells in normal samples in each tissue plotted against the malignancy continuum. Samples are colored based on if they are from different disease stage. |
Top |
Malignant transformation related pathway analysis |
| Find out the enriched GO biological processes and KEGG pathways involved in transition from healthy to precancer to cancer |
| Tissue | Disease Stage | Enriched GO biological Processes |
| Colorectum | AD |  |
| Colorectum | SER |  |
| Colorectum | MSS |  |
| Colorectum | MSI-H |  |
| Colorectum | FAP |  |
| ∗Top 15 enriched GO BP terms are showed in the bar plot of each disease state in each tissue. Each row represents a significant GO biological process which is colored according to the -log10(p.adjust). |
| Page: 1 2 3 4 5 6 7 8 9 |
| GO ID | Tissue | Disease Stage | Description | Gene Ratio | Bg Ratio | pvalue | p.adjust | Count |
| GO:0016032111 | Esophagus | ESCC | viral process | 301/8552 | 415/18723 | 3.34e-29 | 1.32e-26 | 301 |
| GO:001908017 | Esophagus | ESCC | viral gene expression | 80/8552 | 94/18723 | 2.04e-15 | 1.28e-13 | 80 |
| GO:004578527 | Esophagus | ESCC | positive regulation of cell adhesion | 255/8552 | 437/18723 | 5.07e-08 | 9.11e-07 | 255 |
| GO:00066433 | Esophagus | ESCC | membrane lipid metabolic process | 130/8552 | 203/18723 | 9.29e-08 | 1.54e-06 | 130 |
| GO:00091002 | Esophagus | ESCC | glycoprotein metabolic process | 226/8552 | 387/18723 | 2.64e-07 | 3.94e-06 | 226 |
| GO:00067906 | Esophagus | ESCC | sulfur compound metabolic process | 201/8552 | 339/18723 | 2.64e-07 | 3.94e-06 | 201 |
| GO:004206027 | Esophagus | ESCC | wound healing | 243/8552 | 422/18723 | 4.62e-07 | 6.25e-06 | 243 |
| GO:00442725 | Esophagus | ESCC | sulfur compound biosynthetic process | 96/8552 | 148/18723 | 1.86e-06 | 2.16e-05 | 96 |
| GO:00700854 | Esophagus | ESCC | glycosylation | 144/8552 | 240/18723 | 5.12e-06 | 5.38e-05 | 144 |
| GO:00464673 | Esophagus | ESCC | membrane lipid biosynthetic process | 91/8552 | 142/18723 | 7.19e-06 | 7.19e-05 | 91 |
| GO:00064865 | Esophagus | ESCC | protein glycosylation | 135/8552 | 226/18723 | 1.36e-05 | 1.24e-04 | 135 |
| GO:00434135 | Esophagus | ESCC | macromolecule glycosylation | 135/8552 | 226/18723 | 1.36e-05 | 1.24e-04 | 135 |
| GO:00091012 | Esophagus | ESCC | glycoprotein biosynthetic process | 181/8552 | 317/18723 | 2.54e-05 | 2.15e-04 | 181 |
| GO:00190826 | Esophagus | ESCC | viral protein processing | 24/8552 | 29/18723 | 4.50e-05 | 3.55e-04 | 24 |
| GO:00160514 | Esophagus | ESCC | carbohydrate biosynthetic process | 117/8552 | 202/18723 | 2.96e-04 | 1.79e-03 | 117 |
| GO:00066642 | Esophagus | ESCC | glycolipid metabolic process | 63/8552 | 100/18723 | 3.55e-04 | 2.06e-03 | 63 |
| GO:19035092 | Esophagus | ESCC | liposaccharide metabolic process | 63/8552 | 101/18723 | 5.25e-04 | 2.90e-03 | 63 |
| GO:002240720 | Esophagus | ESCC | regulation of cell-cell adhesion | 239/8552 | 448/18723 | 5.88e-04 | 3.19e-03 | 239 |
| GO:002240919 | Esophagus | ESCC | positive regulation of cell-cell adhesion | 155/8552 | 284/18723 | 1.50e-03 | 7.06e-03 | 155 |
| GO:00302586 | Esophagus | ESCC | lipid modification | 116/8552 | 212/18723 | 4.90e-03 | 1.89e-02 | 116 |
| Page: 1 2 3 4 5 6 7 8 9 |
| Pathway ID | Tissue | Disease Stage | Description | Gene Ratio | Bg Ratio | pvalue | p.adjust | qvalue | Count |
| Page: 1 |
Top |
Cell-cell communication analysis |
| Identification of potential cell-cell interactions between two cell types and their ligand-receptor pairs for different disease states |
| Ligand | Receptor | LRpair | Pathway | Tissue | Disease Stage |
| Page: 1 |
Top |
Single-cell gene regulatory network inference analysis |
| Find out the significant the regulons (TFs) and the target genes of each regulon across cell types for different disease states |
| TF | Cell Type | Tissue | Disease Stage | Target Gene | RSS | Regulon Activity |
| ∗The dot plots of a searched regulon are shown for all cell subpopulations in each disease state of each tissue based on the regulon specific score inferred using pySCENIC and by calculating the average expression. |
| Page: 1 |
Top |
Somatic mutation of malignant transformation related genes |
| Annotation of somatic variants for genes involved in malignant transformation |
| Hugo Symbol | Variant Class | Variant Classification | dbSNP RS | HGVSc | HGVSp | HGVSp Short | SWISSPROT | BIOTYPE | SIFT | PolyPhen | Tumor Sample Barcode | Tissue | Histology | Sex | Age | Stage | Therapy Types | Drugs | Outcome |
| ST3GAL4 | SNV | Missense_Mutation | c.972N>A | p.Met324Ile | p.M324I | Q11206 | protein_coding | tolerated(0.21) | benign(0) | TCGA-D8-A13Z-01 | Breast | breast invasive carcinoma | Female | <65 | I/II | Chemotherapy | doxorubicine | SD | |
| ST3GAL4 | SNV | Missense_Mutation | c.601N>C | p.Glu201Gln | p.E201Q | Q11206 | protein_coding | tolerated(0.26) | possibly_damaging(0.636) | TCGA-D8-A27M-01 | Breast | breast invasive carcinoma | Female | <65 | I/II | Chemotherapy | methotrexate+5 | SD | |
| ST3GAL4 | insertion | In_Frame_Ins | novel | c.872_873insAGTAGCTGG | p.Gln291_Thr292insValAlaGly | p.Q291_T292insVAG | Q11206 | protein_coding | TCGA-AO-A0J5-01 | Breast | breast invasive carcinoma | Female | <65 | III/IV | Other, specify in notesBisphosphonate | zoledronic | PD | ||
| ST3GAL4 | insertion | Frame_Shift_Ins | novel | c.874_875insTTACAGGCATGTACCACCACACCTGG | p.Thr292IlefsTer100 | p.T292Ifs*100 | Q11206 | protein_coding | TCGA-AO-A0J5-01 | Breast | breast invasive carcinoma | Female | <65 | III/IV | Other, specify in notesBisphosphonate | zoledronic | PD | ||
| ST3GAL4 | deletion | Frame_Shift_Del | c.496delN | p.Arg166ValfsTer14 | p.R166Vfs*14 | Q11206 | protein_coding | TCGA-D8-A27V-01 | Breast | breast invasive carcinoma | Female | <65 | I/II | Hormone Therapy | tamoxiphen | SD | |||
| ST3GAL4 | deletion | Frame_Shift_Del | c.851delC | p.Pro284GlnfsTer99 | p.P284Qfs*99 | Q11206 | protein_coding | TCGA-EW-A2FV-01 | Breast | breast invasive carcinoma | Female | <65 | III/IV | Chemotherapy | docetaxel | SD | |||
| ST3GAL4 | SNV | Missense_Mutation | novel | c.839N>A | p.Gly280Asp | p.G280D | Q11206 | protein_coding | deleterious(0) | probably_damaging(1) | TCGA-2W-A8YY-01 | Cervix | cervical & endocervical cancer | Female | <65 | I/II | Chemotherapy | cisplatin | CR |
| ST3GAL4 | SNV | Missense_Mutation | rs767229905 | c.958N>T | p.Arg320Trp | p.R320W | Q11206 | protein_coding | deleterious(0) | probably_damaging(0.986) | TCGA-A6-6142-01 | Colorectum | colon adenocarcinoma | Female | <65 | I/II | Chemotherapy | fluorouracil | PD |
| ST3GAL4 | SNV | Missense_Mutation | rs371057579 | c.191N>A | p.Arg64Gln | p.R64Q | Q11206 | protein_coding | tolerated(0.12) | benign(0.104) | TCGA-A5-A7WJ-01 | Endometrium | uterine corpus endometrioid carcinoma | Female | <65 | I/II | Unknown | Unknown | SD |
| ST3GAL4 | SNV | Missense_Mutation | novel | c.779N>G | p.Thr260Ser | p.T260S | Q11206 | protein_coding | deleterious(0.01) | probably_damaging(0.963) | TCGA-AJ-A23O-01 | Endometrium | uterine corpus endometrioid carcinoma | Female | >=65 | I/II | Unknown | Unknown | SD |
| Page: 1 2 3 4 |
Top |
Related drugs of malignant transformation related genes |
| Identification of chemicals and drugs interact with genes involved in malignant transfromation |
| (DGIdb 4.0) |
| Entrez ID | Symbol | Category | Interaction Types | Drug Claim Name | Drug Name | PMIDs |
| Page: 1 |

Copyright 2023-Present -The University of Texas Health Science Center at Houston |