
|
|||||
|
 | |
| |
| |
| |
| |
| |
|
Gene: ST3GAL3 |
Gene summary for ST3GAL3 |
| Gene information | Species | Human | Gene symbol | ST3GAL3 | Gene ID | 6487 |
| Gene name | ST3 beta-galactoside alpha-2,3-sialyltransferase 3 | |
| Gene Alias | DEE15 | |
| Cytomap | 1p34.1 | |
| Gene Type | protein-coding | GO ID | GO:0001573 | UniProtAcc | Q11203 |
Top |
Malignant transformation analysis |
| Identification of the aberrant gene expression in precancerous and cancerous lesions by comparing the gene expression of stem-like cells in diseased tissues with normal stem cells |
| Entrez ID | Symbol | Replicates | Species | Organ | Tissue | Adj P-value | Log2FC | Malignancy |
| 6487 | ST3GAL3 | LZE4T | Human | Esophagus | ESCC | 1.05e-06 | 1.68e-01 | 0.0811 |
| 6487 | ST3GAL3 | LZE7T | Human | Esophagus | ESCC | 4.41e-06 | 3.68e-01 | 0.0667 |
| 6487 | ST3GAL3 | LZE24T | Human | Esophagus | ESCC | 8.55e-07 | 1.77e-01 | 0.0596 |
| 6487 | ST3GAL3 | P2T-E | Human | Esophagus | ESCC | 2.20e-17 | 2.62e-01 | 0.1177 |
| 6487 | ST3GAL3 | P4T-E | Human | Esophagus | ESCC | 3.22e-10 | 1.48e-01 | 0.1323 |
| 6487 | ST3GAL3 | P5T-E | Human | Esophagus | ESCC | 3.97e-04 | 1.08e-01 | 0.1327 |
| 6487 | ST3GAL3 | P9T-E | Human | Esophagus | ESCC | 1.21e-07 | 1.93e-01 | 0.1131 |
| 6487 | ST3GAL3 | P10T-E | Human | Esophagus | ESCC | 2.13e-27 | 4.09e-01 | 0.116 |
| 6487 | ST3GAL3 | P11T-E | Human | Esophagus | ESCC | 3.50e-09 | 2.51e-01 | 0.1426 |
| 6487 | ST3GAL3 | P12T-E | Human | Esophagus | ESCC | 3.95e-30 | 5.01e-01 | 0.1122 |
| 6487 | ST3GAL3 | P15T-E | Human | Esophagus | ESCC | 3.45e-23 | 4.29e-01 | 0.1149 |
| 6487 | ST3GAL3 | P16T-E | Human | Esophagus | ESCC | 3.13e-09 | 1.52e-01 | 0.1153 |
| 6487 | ST3GAL3 | P17T-E | Human | Esophagus | ESCC | 6.98e-07 | 1.91e-01 | 0.1278 |
| 6487 | ST3GAL3 | P19T-E | Human | Esophagus | ESCC | 3.44e-05 | 2.67e-01 | 0.1662 |
| 6487 | ST3GAL3 | P20T-E | Human | Esophagus | ESCC | 6.41e-12 | 2.17e-01 | 0.1124 |
| 6487 | ST3GAL3 | P21T-E | Human | Esophagus | ESCC | 7.98e-13 | 2.46e-01 | 0.1617 |
| 6487 | ST3GAL3 | P22T-E | Human | Esophagus | ESCC | 9.56e-08 | 1.46e-01 | 0.1236 |
| 6487 | ST3GAL3 | P23T-E | Human | Esophagus | ESCC | 3.62e-11 | 2.13e-01 | 0.108 |
| 6487 | ST3GAL3 | P24T-E | Human | Esophagus | ESCC | 1.96e-05 | 1.21e-01 | 0.1287 |
| 6487 | ST3GAL3 | P26T-E | Human | Esophagus | ESCC | 4.24e-18 | 3.17e-01 | 0.1276 |
| Page: 1 2 3 4 |
| Tissue | Expression Dynamics | Abbreviation |
| Esophagus | 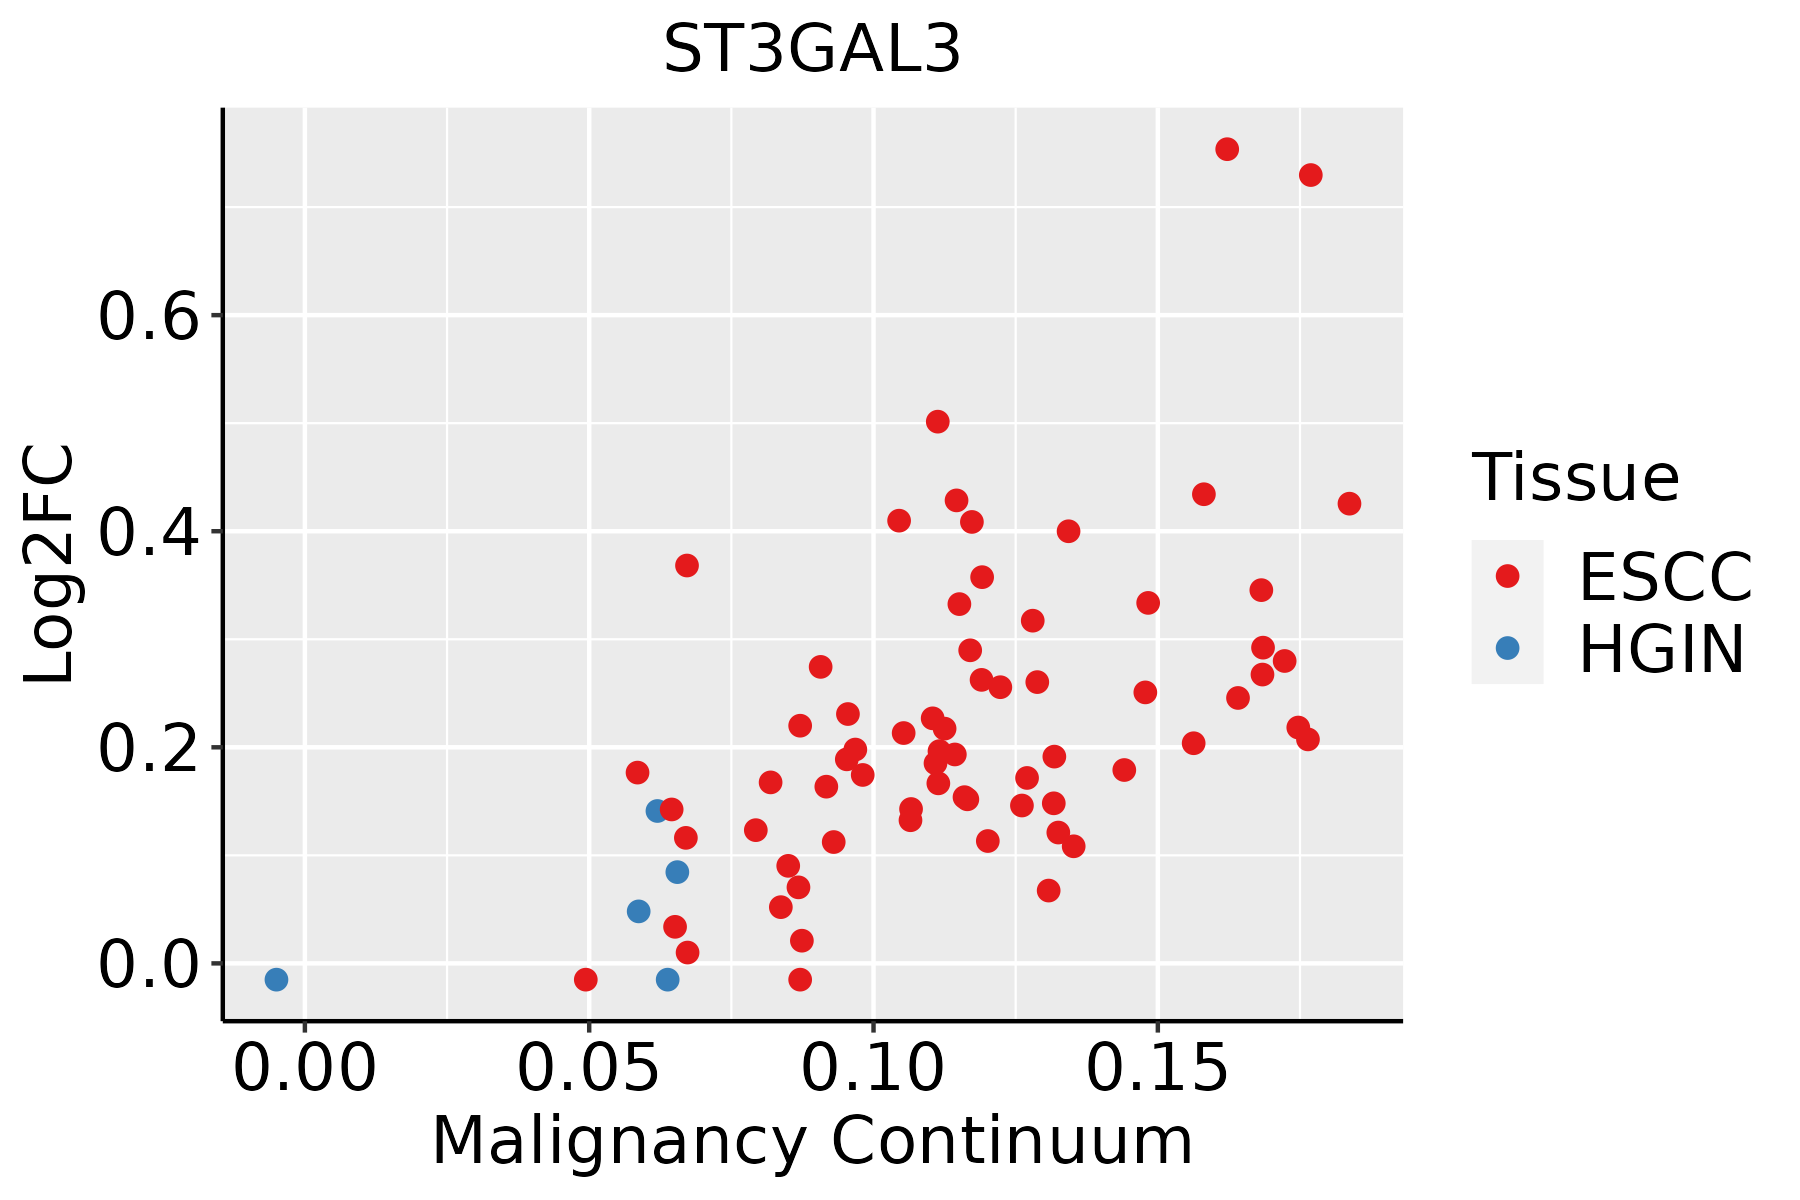 | ESCC: Esophageal squamous cell carcinoma |
| HGIN: High-grade intraepithelial neoplasias | ||
| LGIN: Low-grade intraepithelial neoplasias | ||
| Lung |  | AAH: Atypical adenomatous hyperplasia |
| AIS: Adenocarcinoma in situ | ||
| IAC: Invasive lung adenocarcinoma | ||
| MIA: Minimally invasive adenocarcinoma |
| ∗log2FC in expression of this searched gene in stem-like cells from each diseased tissue sample relative to stem-like cells in normal samples in each tissue plotted against the malignancy continuum. Samples are colored based on if they are from different disease stage. |
Top |
Malignant transformation related pathway analysis |
| Find out the enriched GO biological processes and KEGG pathways involved in transition from healthy to precancer to cancer |
| Tissue | Disease Stage | Enriched GO biological Processes |
| Colorectum | AD |  |
| Colorectum | SER |  |
| Colorectum | MSS |  |
| Colorectum | MSI-H |  |
| Colorectum | FAP |  |
| ∗Top 15 enriched GO BP terms are showed in the bar plot of each disease state in each tissue. Each row represents a significant GO biological process which is colored according to the -log10(p.adjust). |
| Page: 1 2 3 4 5 6 7 8 9 |
| GO ID | Tissue | Disease Stage | Description | Gene Ratio | Bg Ratio | pvalue | p.adjust | Count |
| GO:0016032111 | Esophagus | ESCC | viral process | 301/8552 | 415/18723 | 3.34e-29 | 1.32e-26 | 301 |
| GO:001908017 | Esophagus | ESCC | viral gene expression | 80/8552 | 94/18723 | 2.04e-15 | 1.28e-13 | 80 |
| GO:00066433 | Esophagus | ESCC | membrane lipid metabolic process | 130/8552 | 203/18723 | 9.29e-08 | 1.54e-06 | 130 |
| GO:00091002 | Esophagus | ESCC | glycoprotein metabolic process | 226/8552 | 387/18723 | 2.64e-07 | 3.94e-06 | 226 |
| GO:00067906 | Esophagus | ESCC | sulfur compound metabolic process | 201/8552 | 339/18723 | 2.64e-07 | 3.94e-06 | 201 |
| GO:00442725 | Esophagus | ESCC | sulfur compound biosynthetic process | 96/8552 | 148/18723 | 1.86e-06 | 2.16e-05 | 96 |
| GO:00700854 | Esophagus | ESCC | glycosylation | 144/8552 | 240/18723 | 5.12e-06 | 5.38e-05 | 144 |
| GO:00464673 | Esophagus | ESCC | membrane lipid biosynthetic process | 91/8552 | 142/18723 | 7.19e-06 | 7.19e-05 | 91 |
| GO:00064865 | Esophagus | ESCC | protein glycosylation | 135/8552 | 226/18723 | 1.36e-05 | 1.24e-04 | 135 |
| GO:00434135 | Esophagus | ESCC | macromolecule glycosylation | 135/8552 | 226/18723 | 1.36e-05 | 1.24e-04 | 135 |
| GO:00091012 | Esophagus | ESCC | glycoprotein biosynthetic process | 181/8552 | 317/18723 | 2.54e-05 | 2.15e-04 | 181 |
| GO:00066652 | Esophagus | ESCC | sphingolipid metabolic process | 96/8552 | 155/18723 | 3.21e-05 | 2.66e-04 | 96 |
| GO:00190826 | Esophagus | ESCC | viral protein processing | 24/8552 | 29/18723 | 4.50e-05 | 3.55e-04 | 24 |
| GO:00160514 | Esophagus | ESCC | carbohydrate biosynthetic process | 117/8552 | 202/18723 | 2.96e-04 | 1.79e-03 | 117 |
| GO:00066642 | Esophagus | ESCC | glycolipid metabolic process | 63/8552 | 100/18723 | 3.55e-04 | 2.06e-03 | 63 |
| GO:19035092 | Esophagus | ESCC | liposaccharide metabolic process | 63/8552 | 101/18723 | 5.25e-04 | 2.90e-03 | 63 |
| GO:00301481 | Esophagus | ESCC | sphingolipid biosynthetic process | 62/8552 | 103/18723 | 2.10e-03 | 9.38e-03 | 62 |
| GO:00066721 | Esophagus | ESCC | ceramide metabolic process | 61/8552 | 102/18723 | 2.82e-03 | 1.19e-02 | 61 |
| GO:0009247 | Esophagus | ESCC | glycolipid biosynthetic process | 42/8552 | 68/18723 | 5.48e-03 | 2.05e-02 | 42 |
| GO:0046513 | Esophagus | ESCC | ceramide biosynthetic process | 40/8552 | 65/18723 | 7.25e-03 | 2.63e-02 | 40 |
| Page: 1 2 |
| Pathway ID | Tissue | Disease Stage | Description | Gene Ratio | Bg Ratio | pvalue | p.adjust | qvalue | Count |
| hsa005136 | Esophagus | ESCC | Various types of N-glycan biosynthesis | 31/4205 | 42/8465 | 1.23e-03 | 3.78e-03 | 1.93e-03 | 31 |
| hsa0051313 | Esophagus | ESCC | Various types of N-glycan biosynthesis | 31/4205 | 42/8465 | 1.23e-03 | 3.78e-03 | 1.93e-03 | 31 |
| Page: 1 |
Top |
Cell-cell communication analysis |
| Identification of potential cell-cell interactions between two cell types and their ligand-receptor pairs for different disease states |
| Ligand | Receptor | LRpair | Pathway | Tissue | Disease Stage |
| Page: 1 |
Top |
Single-cell gene regulatory network inference analysis |
| Find out the significant the regulons (TFs) and the target genes of each regulon across cell types for different disease states |
| TF | Cell Type | Tissue | Disease Stage | Target Gene | RSS | Regulon Activity |
| ∗The dot plots of a searched regulon are shown for all cell subpopulations in each disease state of each tissue based on the regulon specific score inferred using pySCENIC and by calculating the average expression. |
| Page: 1 |
Top |
Somatic mutation of malignant transformation related genes |
| Annotation of somatic variants for genes involved in malignant transformation |
| Hugo Symbol | Variant Class | Variant Classification | dbSNP RS | HGVSc | HGVSp | HGVSp Short | SWISSPROT | BIOTYPE | SIFT | PolyPhen | Tumor Sample Barcode | Tissue | Histology | Sex | Age | Stage | Therapy Types | Drugs | Outcome |
| ST3GAL3 | SNV | Missense_Mutation | rs376537870 | c.494N>T | p.Thr165Met | p.T165M | Q11203 | protein_coding | deleterious(0.01) | probably_damaging(0.921) | TCGA-A7-A26H-01 | Breast | breast invasive carcinoma | Female | >=65 | I/II | Hormone Therapy | anastrozole | PD |
| ST3GAL3 | SNV | Missense_Mutation | c.352N>G | p.Leu118Val | p.L118V | Q11203 | protein_coding | tolerated_low_confidence(0.53) | benign(0) | TCGA-D8-A1JA-01 | Breast | breast invasive carcinoma | Female | <65 | III/IV | Chemotherapy | adriamycin | PD | |
| ST3GAL3 | SNV | Missense_Mutation | c.640N>C | p.Glu214Gln | p.E214Q | Q11203 | protein_coding | tolerated(0.06) | benign(0.138) | TCGA-D8-A1XZ-01 | Breast | breast invasive carcinoma | Female | >=65 | III/IV | Hormone Therapy | tamoxiphen+anastrozolum | SD | |
| ST3GAL3 | SNV | Missense_Mutation | c.878N>A | p.Ser293Tyr | p.S293Y | Q11203 | protein_coding | deleterious(0) | probably_damaging(0.986) | TCGA-GM-A2DO-01 | Breast | breast invasive carcinoma | Female | <65 | I/II | Hormone Therapy | tamoxiphen | CR | |
| ST3GAL3 | SNV | Missense_Mutation | novel | c.88N>G | p.Leu30Val | p.L30V | Q11203 | protein_coding | deleterious_low_confidence(0) | possibly_damaging(0.89) | TCGA-HN-A2NL-01 | Breast | breast invasive carcinoma | Female | <65 | I/II | Chemotherapy | cyclophosphamide | SD |
| ST3GAL3 | SNV | Missense_Mutation | rs767429776 | c.815N>T | p.Thr272Met | p.T272M | Q11203 | protein_coding | deleterious(0) | probably_damaging(1) | TCGA-VS-A9UD-01 | Cervix | cervical & endocervical cancer | Female | >=65 | III/IV | Chemotherapy | cisplatin | CR |
| ST3GAL3 | deletion | Frame_Shift_Del | novel | c.132_156delCTCTAGCTCACCCCAGGAGAAGCCT | p.His44GlnfsTer17 | p.H44Qfs*17 | Q11203 | protein_coding | TCGA-FU-A40J-01 | Cervix | cervical & endocervical cancer | Female | <65 | III/IV | Chemotherapy | carboplatin | CR | ||
| ST3GAL3 | SNV | Missense_Mutation | c.467N>G | p.Lys156Arg | p.K156R | Q11203 | protein_coding | tolerated(0.69) | benign(0.327) | TCGA-AA-3663-01 | Colorectum | colon adenocarcinoma | Male | <65 | I/II | Unknown | Unknown | SD | |
| ST3GAL3 | SNV | Missense_Mutation | c.1225C>T | p.Arg409Cys | p.R409C | Q11203 | protein_coding | tolerated(0.16) | probably_damaging(0.921) | TCGA-AA-3977-01 | Colorectum | colon adenocarcinoma | Male | >=65 | I/II | Unknown | Unknown | SD | |
| ST3GAL3 | SNV | Missense_Mutation | c.1225C>T | p.Arg409Cys | p.R409C | Q11203 | protein_coding | tolerated(0.16) | probably_damaging(0.921) | TCGA-AA-A00N-01 | Colorectum | colon adenocarcinoma | Male | >=65 | I/II | Unknown | Unknown | PD |
| Page: 1 2 3 4 5 |
Top |
Related drugs of malignant transformation related genes |
| Identification of chemicals and drugs interact with genes involved in malignant transfromation |
| (DGIdb 4.0) |
| Entrez ID | Symbol | Category | Interaction Types | Drug Claim Name | Drug Name | PMIDs |
| Page: 1 |

Copyright 2023-Present -The University of Texas Health Science Center at Houston |