
|
|||||
|
 | |
| |
| |
| |
| |
| |
|
Gene: ST3GAL2 |
Gene summary for ST3GAL2 |
| Gene information | Species | Human | Gene symbol | ST3GAL2 | Gene ID | 6483 |
| Gene name | ST3 beta-galactoside alpha-2,3-sialyltransferase 2 | |
| Gene Alias | Gal-NAc6S | |
| Cytomap | 16q22.1 | |
| Gene Type | protein-coding | GO ID | GO:0001573 | UniProtAcc | A0A024QZA4 |
Top |
Malignant transformation analysis |
| Identification of the aberrant gene expression in precancerous and cancerous lesions by comparing the gene expression of stem-like cells in diseased tissues with normal stem cells |
| Entrez ID | Symbol | Replicates | Species | Organ | Tissue | Adj P-value | Log2FC | Malignancy |
| 6483 | ST3GAL2 | HTA11_1938_2000001011 | Human | Colorectum | AD | 9.89e-04 | 2.98e-01 | -0.0811 |
| 6483 | ST3GAL2 | HTA11_347_2000001011 | Human | Colorectum | AD | 1.22e-02 | 1.22e-01 | -0.1954 |
| 6483 | ST3GAL2 | HTA11_1391_2000001011 | Human | Colorectum | AD | 3.63e-02 | 2.00e-01 | -0.059 |
| 6483 | ST3GAL2 | HTA11_866_3004761011 | Human | Colorectum | AD | 9.60e-05 | 1.91e-01 | 0.096 |
| 6483 | ST3GAL2 | HTA11_6818_2000001021 | Human | Colorectum | AD | 1.48e-13 | 5.57e-01 | 0.0588 |
| 6483 | ST3GAL2 | HTA11_99999971662_82457 | Human | Colorectum | MSS | 1.16e-11 | 4.83e-01 | 0.3859 |
| 6483 | ST3GAL2 | HTA11_99999974143_84620 | Human | Colorectum | MSS | 1.08e-04 | 2.86e-01 | 0.3005 |
| 6483 | ST3GAL2 | GSM6177620_NYU_UCEC1_lib1_lib1 | Human | Endometrium | EEC | 6.19e-06 | -8.71e-02 | -0.1869 |
| 6483 | ST3GAL2 | GSM6177620_NYU_UCEC1_lib2_lib2 | Human | Endometrium | EEC | 2.72e-03 | -1.09e-01 | -0.1875 |
| 6483 | ST3GAL2 | GSM6177620_NYU_UCEC1_lib3_lib3 | Human | Endometrium | EEC | 1.48e-07 | -6.28e-02 | -0.1883 |
| 6483 | ST3GAL2 | GSM6177621_NYU_UCEC2_lib1_lib1 | Human | Endometrium | EEC | 1.67e-02 | -6.58e-02 | -0.1934 |
| 6483 | ST3GAL2 | GSM6177622_NYU_UCEC3_lib1_lib1 | Human | Endometrium | EEC | 7.85e-04 | -1.40e-01 | -0.1917 |
| 6483 | ST3GAL2 | GSM6177622_NYU_UCEC3_lib2_lib2 | Human | Endometrium | EEC | 9.12e-08 | -1.40e-01 | -0.1916 |
| 6483 | ST3GAL2 | HCC1_Meng | Human | Liver | HCC | 9.88e-16 | -7.29e-03 | 0.0246 |
| 6483 | ST3GAL2 | HCC1 | Human | Liver | HCC | 2.46e-09 | 2.89e+00 | 0.5336 |
| 6483 | ST3GAL2 | HCC2 | Human | Liver | HCC | 1.08e-13 | 2.51e+00 | 0.5341 |
| 6483 | ST3GAL2 | HCC5 | Human | Liver | HCC | 2.19e-05 | 7.28e-01 | 0.4932 |
| 6483 | ST3GAL2 | S014 | Human | Liver | HCC | 1.28e-08 | 3.27e-01 | 0.2254 |
| 6483 | ST3GAL2 | S015 | Human | Liver | HCC | 2.24e-02 | 2.32e-01 | 0.2375 |
| 6483 | ST3GAL2 | S016 | Human | Liver | HCC | 2.01e-06 | 2.49e-01 | 0.2243 |
| Page: 1 2 |
| Tissue | Expression Dynamics | Abbreviation |
| Colorectum (GSE201348) |  | FAP: Familial adenomatous polyposis |
| CRC: Colorectal cancer | ||
| Colorectum (HTA11) | 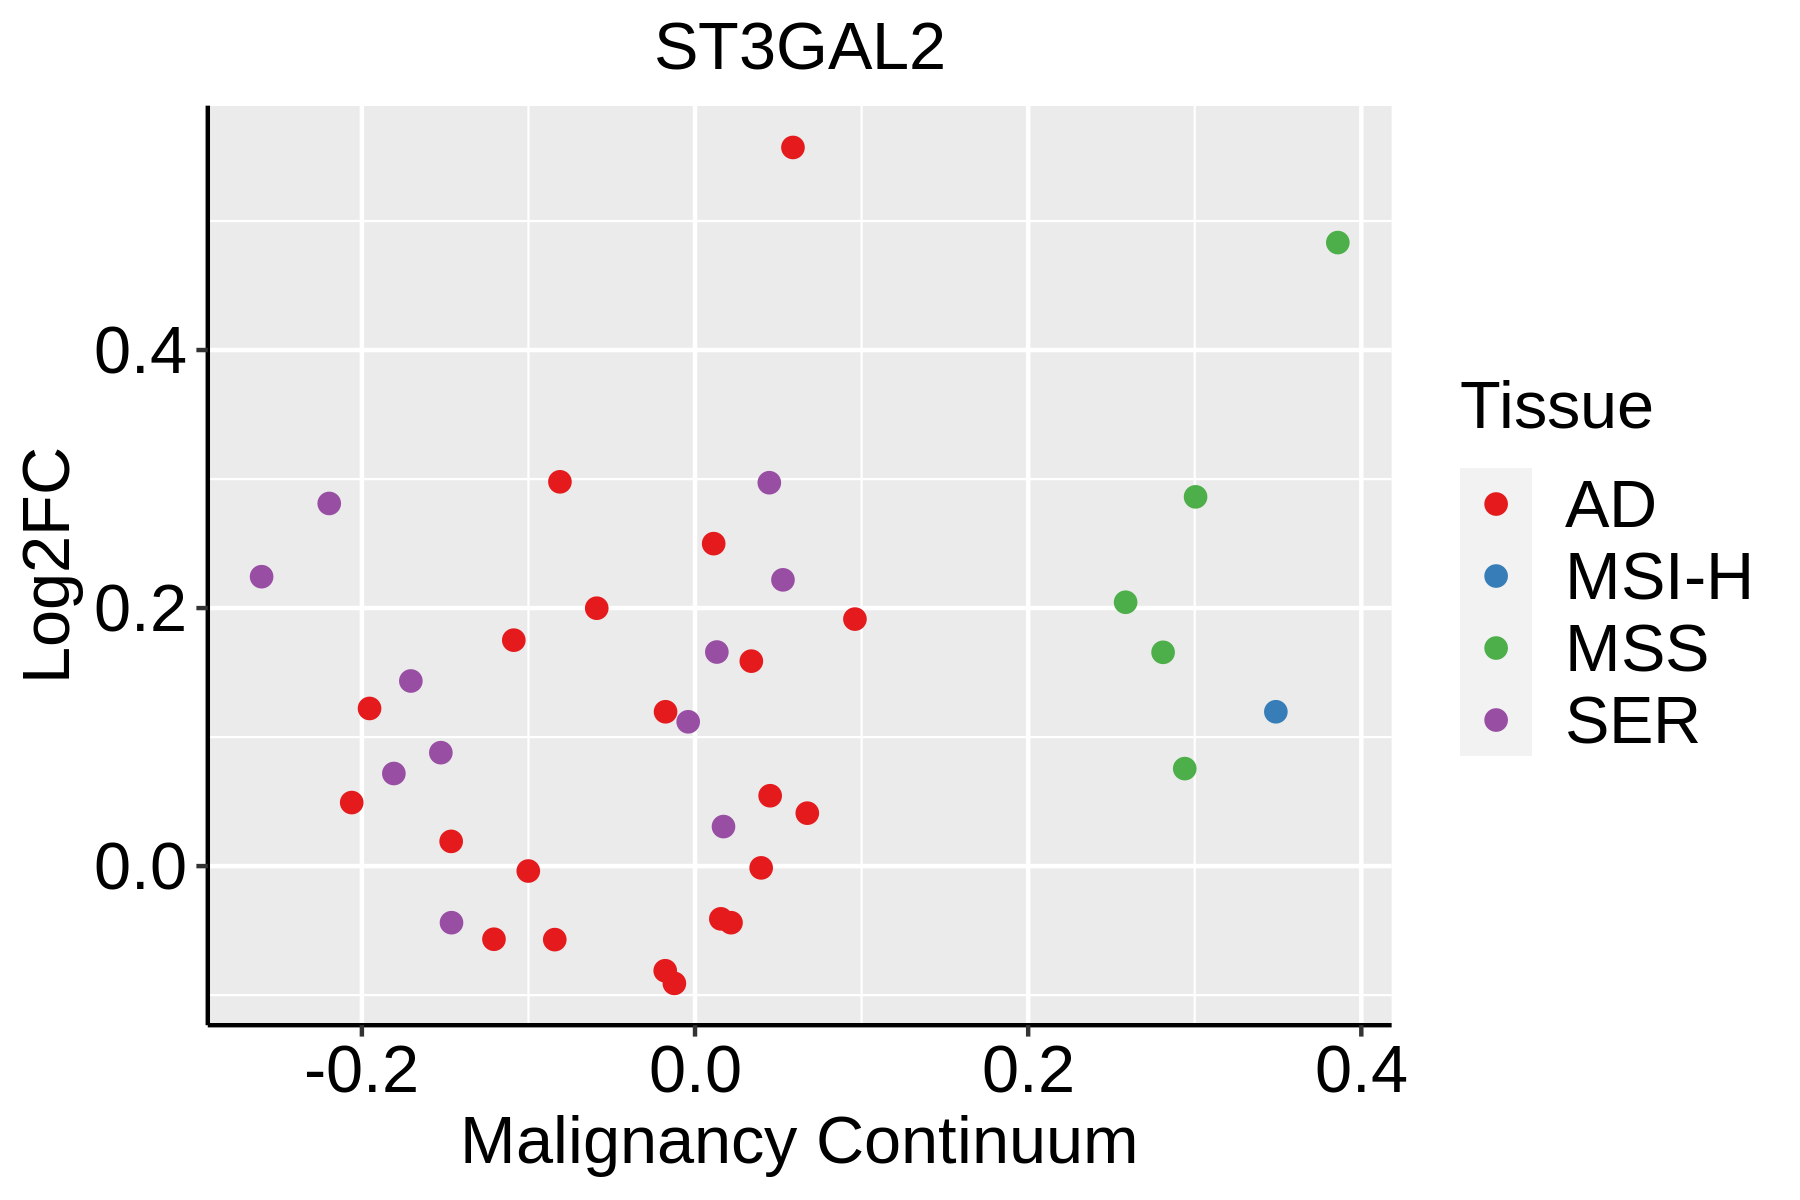 | AD: Adenomas |
| SER: Sessile serrated lesions | ||
| MSI-H: Microsatellite-high colorectal cancer | ||
| MSS: Microsatellite stable colorectal cancer | ||
| Endometrium | 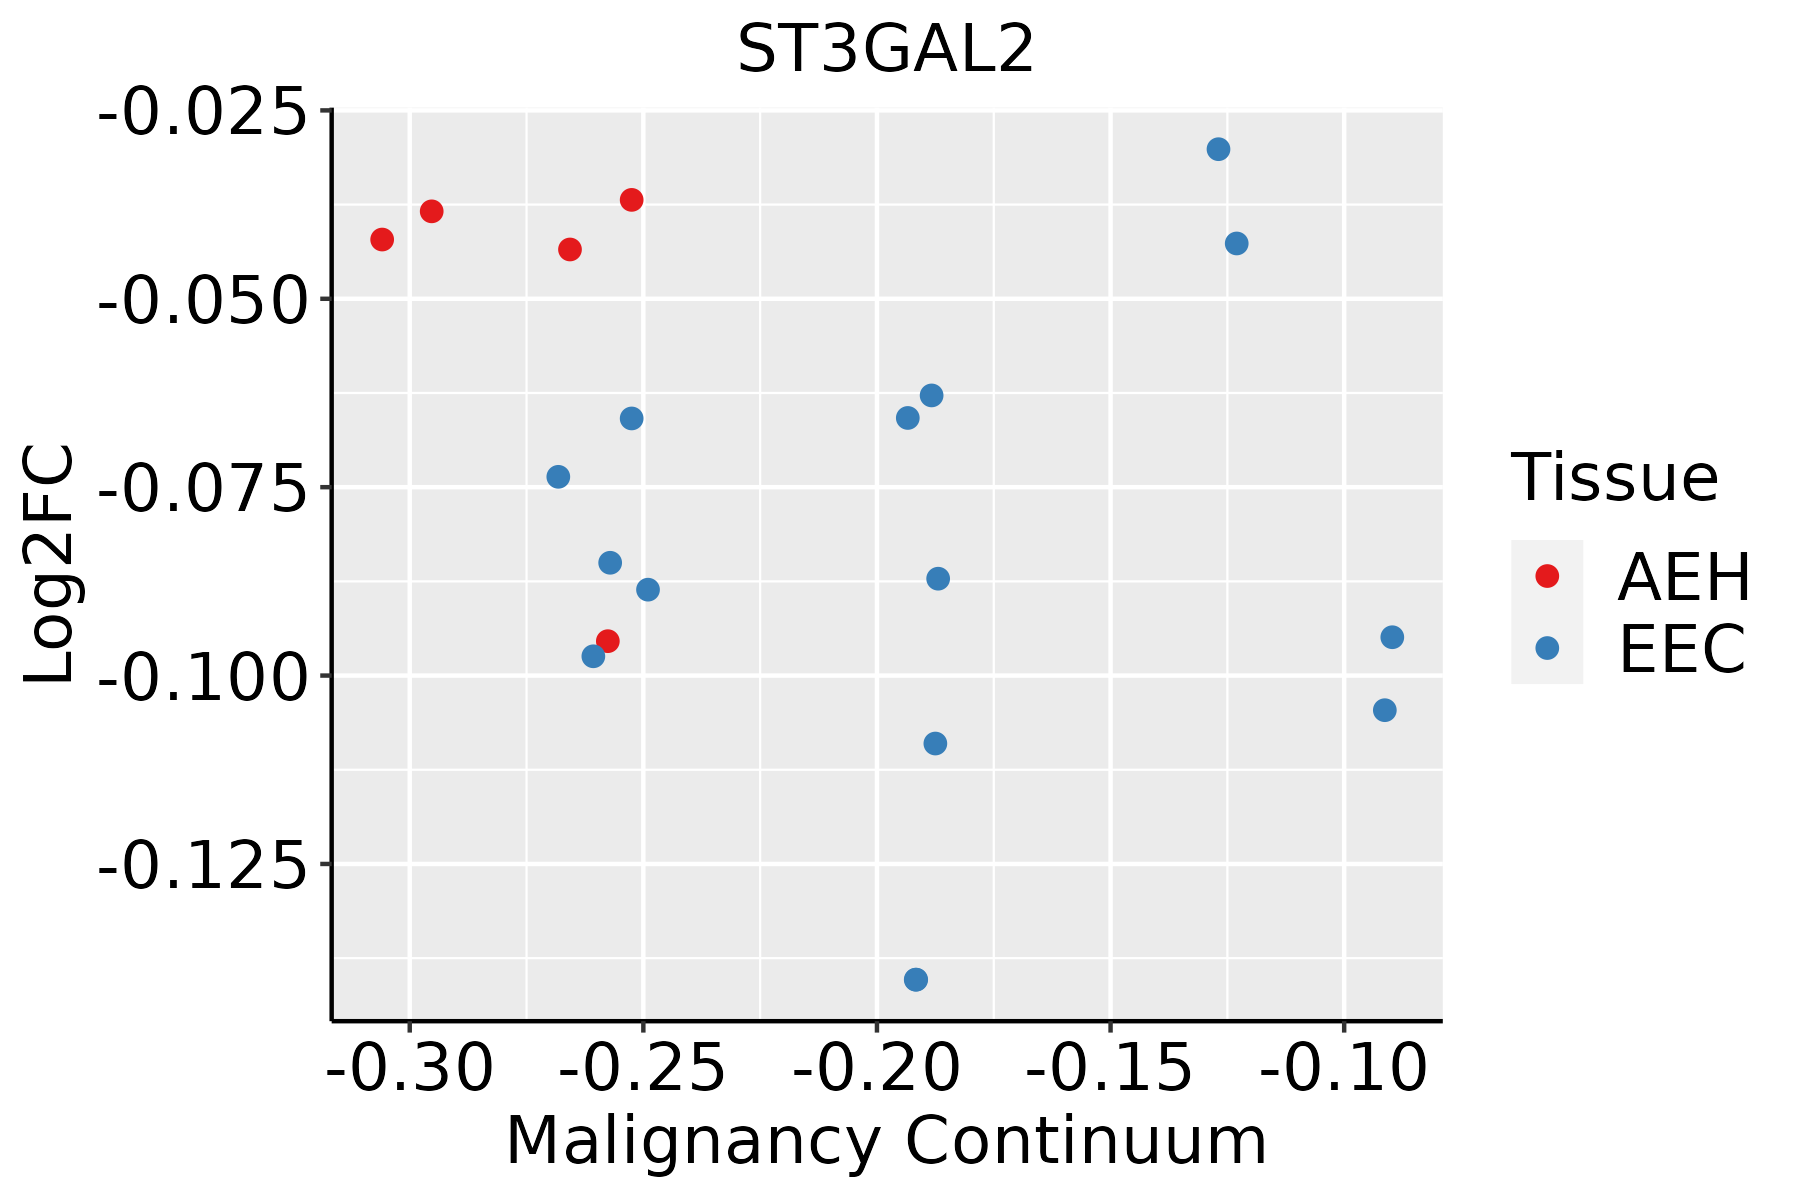 | AEH: Atypical endometrial hyperplasia |
| EEC: Endometrioid Cancer | ||
| Liver | 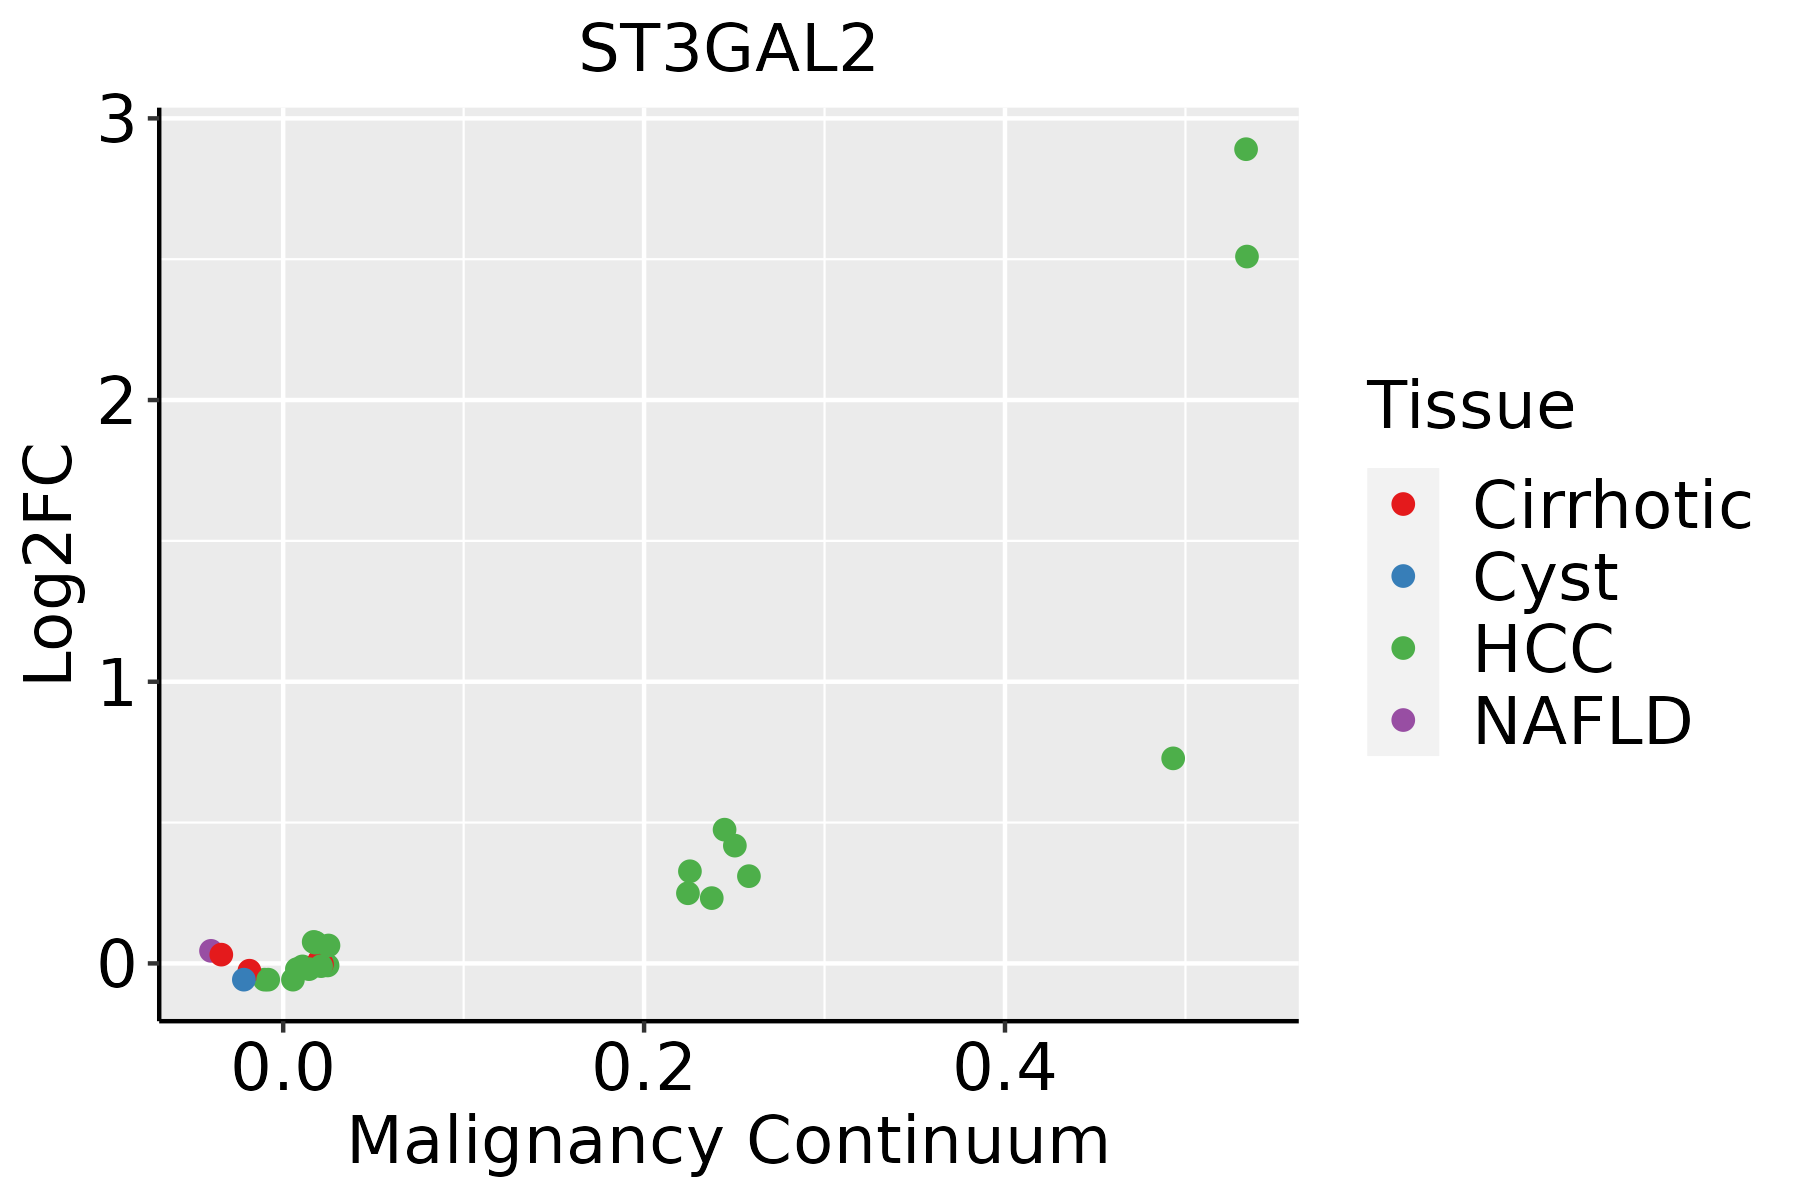 | HCC: Hepatocellular carcinoma |
| NAFLD: Non-alcoholic fatty liver disease | ||
| Thyroid | 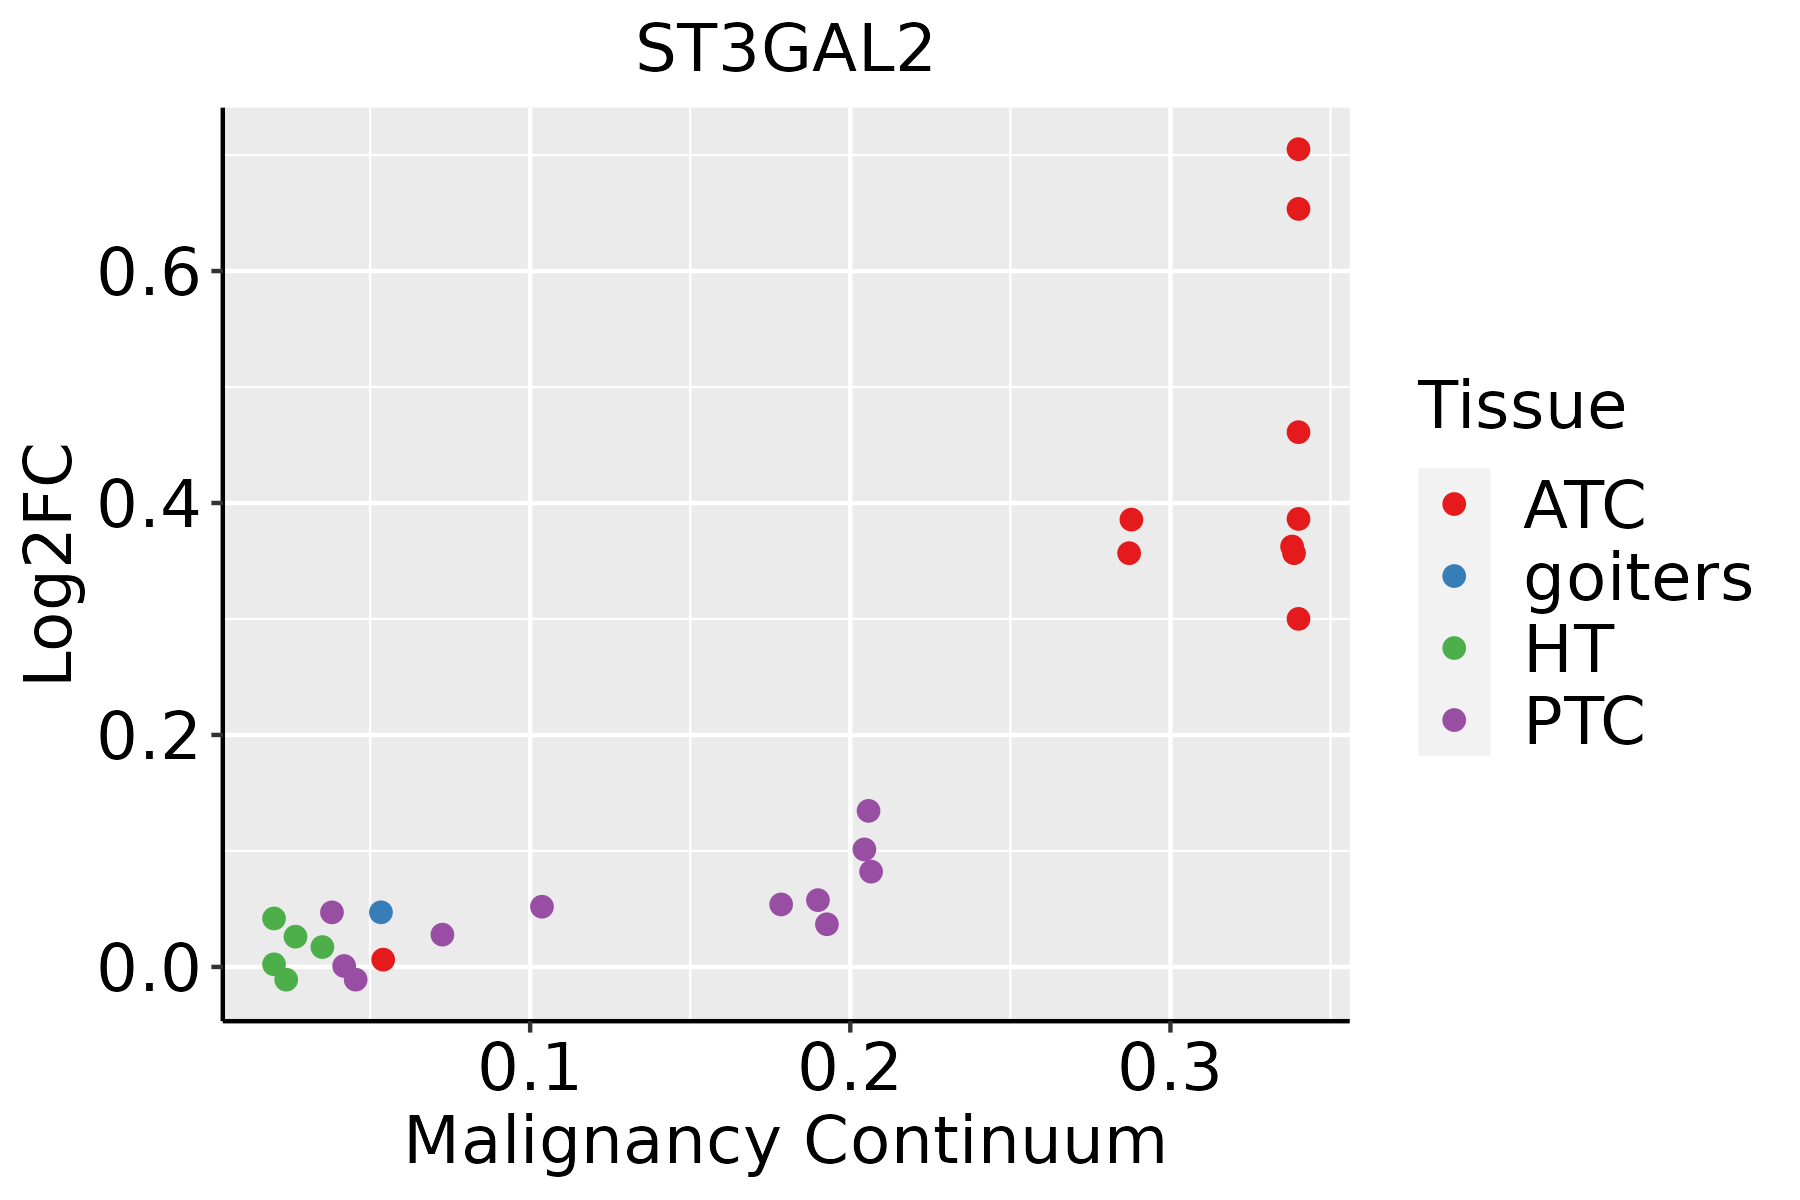 | ATC: Anaplastic thyroid cancer |
| HT: Hashimoto's thyroiditis | ||
| PTC: Papillary thyroid cancer |
| ∗log2FC in expression of this searched gene in stem-like cells from each diseased tissue sample relative to stem-like cells in normal samples in each tissue plotted against the malignancy continuum. Samples are colored based on if they are from different disease stage. |
Top |
Malignant transformation related pathway analysis |
| Find out the enriched GO biological processes and KEGG pathways involved in transition from healthy to precancer to cancer |
| Tissue | Disease Stage | Enriched GO biological Processes |
| Colorectum | AD |  |
| Colorectum | SER |  |
| Colorectum | MSS |  |
| Colorectum | MSI-H |  |
| Colorectum | FAP |  |
| ∗Top 15 enriched GO BP terms are showed in the bar plot of each disease state in each tissue. Each row represents a significant GO biological process which is colored according to the -log10(p.adjust). |
| Page: 1 2 3 4 5 6 7 8 9 |
| GO ID | Tissue | Disease Stage | Description | Gene Ratio | Bg Ratio | pvalue | p.adjust | Count |
| GO:0016032 | Colorectum | AD | viral process | 168/3918 | 415/18723 | 4.67e-20 | 3.66e-17 | 168 |
| GO:0019080 | Colorectum | AD | viral gene expression | 42/3918 | 94/18723 | 1.90e-07 | 8.02e-06 | 42 |
| GO:0019082 | Colorectum | AD | viral protein processing | 17/3918 | 29/18723 | 1.04e-05 | 2.40e-04 | 17 |
| GO:0006790 | Colorectum | AD | sulfur compound metabolic process | 101/3918 | 339/18723 | 6.46e-05 | 1.07e-03 | 101 |
| GO:0030258 | Colorectum | AD | lipid modification | 67/3918 | 212/18723 | 1.66e-04 | 2.27e-03 | 67 |
| GO:0006486 | Colorectum | AD | protein glycosylation | 64/3918 | 226/18723 | 4.86e-03 | 3.27e-02 | 64 |
| GO:0043413 | Colorectum | AD | macromolecule glycosylation | 64/3918 | 226/18723 | 4.86e-03 | 3.27e-02 | 64 |
| GO:0070085 | Colorectum | AD | glycosylation | 67/3918 | 240/18723 | 5.78e-03 | 3.67e-02 | 67 |
| GO:00160322 | Colorectum | MSS | viral process | 157/3467 | 415/18723 | 7.94e-21 | 6.19e-18 | 157 |
| GO:00190802 | Colorectum | MSS | viral gene expression | 41/3467 | 94/18723 | 1.74e-08 | 9.85e-07 | 41 |
| GO:00190821 | Colorectum | MSS | viral protein processing | 17/3467 | 29/18723 | 1.81e-06 | 5.70e-05 | 17 |
| GO:00067902 | Colorectum | MSS | sulfur compound metabolic process | 85/3467 | 339/18723 | 1.52e-03 | 1.39e-02 | 85 |
| GO:00302582 | Colorectum | MSS | lipid modification | 57/3467 | 212/18723 | 1.64e-03 | 1.49e-02 | 57 |
| GO:001603217 | Endometrium | EEC | viral process | 112/2168 | 415/18723 | 2.48e-18 | 1.35e-15 | 112 |
| GO:001908013 | Endometrium | EEC | viral gene expression | 23/2168 | 94/18723 | 3.57e-04 | 3.91e-03 | 23 |
| GO:001603222 | Liver | HCC | viral process | 286/7958 | 415/18723 | 4.41e-28 | 1.86e-25 | 286 |
| GO:001908021 | Liver | HCC | viral gene expression | 77/7958 | 94/18723 | 4.33e-15 | 3.12e-13 | 77 |
| GO:000679021 | Liver | HCC | sulfur compound metabolic process | 212/7958 | 339/18723 | 5.60e-14 | 3.39e-12 | 212 |
| GO:00442722 | Liver | HCC | sulfur compound biosynthetic process | 95/7958 | 148/18723 | 7.89e-08 | 1.58e-06 | 95 |
| GO:003025821 | Liver | HCC | lipid modification | 123/7958 | 212/18723 | 3.50e-06 | 4.58e-05 | 123 |
| Page: 1 2 3 |
| Pathway ID | Tissue | Disease Stage | Description | Gene Ratio | Bg Ratio | pvalue | p.adjust | qvalue | Count |
| Page: 1 |
Top |
Cell-cell communication analysis |
| Identification of potential cell-cell interactions between two cell types and their ligand-receptor pairs for different disease states |
| Ligand | Receptor | LRpair | Pathway | Tissue | Disease Stage |
| Page: 1 |
Top |
Single-cell gene regulatory network inference analysis |
| Find out the significant the regulons (TFs) and the target genes of each regulon across cell types for different disease states |
| TF | Cell Type | Tissue | Disease Stage | Target Gene | RSS | Regulon Activity |
| ∗The dot plots of a searched regulon are shown for all cell subpopulations in each disease state of each tissue based on the regulon specific score inferred using pySCENIC and by calculating the average expression. |
| Page: 1 |
Top |
Somatic mutation of malignant transformation related genes |
| Annotation of somatic variants for genes involved in malignant transformation |
| Hugo Symbol | Variant Class | Variant Classification | dbSNP RS | HGVSc | HGVSp | HGVSp Short | SWISSPROT | BIOTYPE | SIFT | PolyPhen | Tumor Sample Barcode | Tissue | Histology | Sex | Age | Stage | Therapy Types | Drugs | Outcome |
| ST3GAL2 | SNV | Missense_Mutation | novel | c.732G>C | p.Lys244Asn | p.K244N | Q16842 | protein_coding | probably_damaging(1) | TCGA-BH-A0E2-01 | Breast | breast invasive carcinoma | Female | <65 | III/IV | Chemotherapy | doxorubicin | SD | |
| ST3GAL2 | SNV | Missense_Mutation | rs758483209 | c.139N>T | p.Arg47Trp | p.R47W | Q16842 | protein_coding | possibly_damaging(0.857) | TCGA-E9-A1ND-01 | Breast | breast invasive carcinoma | Female | >=65 | I/II | Hormone Therapy | aromasin | SD | |
| ST3GAL2 | insertion | Nonsense_Mutation | novel | c.733_734insGAGCCGGGCCTCGCCGCGACCCTTCCGGCC | p.Ser245delinsTer | p.S245delins* | Q16842 | protein_coding | TCGA-BH-A0E2-01 | Breast | breast invasive carcinoma | Female | <65 | III/IV | Chemotherapy | doxorubicin | SD | ||
| ST3GAL2 | deletion | Frame_Shift_Del | novel | c.620delA | p.Asn207ThrfsTer37 | p.N207Tfs*37 | Q16842 | protein_coding | TCGA-D8-A27V-01 | Breast | breast invasive carcinoma | Female | <65 | I/II | Hormone Therapy | tamoxiphen | SD | ||
| ST3GAL2 | SNV | Missense_Mutation | c.798C>G | p.His266Gln | p.H266Q | Q16842 | protein_coding | possibly_damaging(0.879) | TCGA-LP-A4AX-01 | Cervix | cervical & endocervical cancer | Female | <65 | I/II | Unknown | Unknown | SD | ||
| ST3GAL2 | deletion | Frame_Shift_Del | novel | c.439delC | p.His147ThrfsTer31 | p.H147Tfs*31 | Q16842 | protein_coding | TCGA-WS-AB45-01 | Colorectum | colon adenocarcinoma | Female | <65 | I/II | Unknown | Unknown | SD | ||
| ST3GAL2 | SNV | Missense_Mutation | novel | c.425N>A | p.Arg142His | p.R142H | Q16842 | protein_coding | benign(0.436) | TCGA-A5-A0G2-01 | Endometrium | uterine corpus endometrioid carcinoma | Female | <65 | III/IV | Unknown | Unknown | SD | |
| ST3GAL2 | SNV | Missense_Mutation | novel | c.500N>A | p.Gly167Glu | p.G167E | Q16842 | protein_coding | probably_damaging(1) | TCGA-A5-A1OF-01 | Endometrium | uterine corpus endometrioid carcinoma | Female | <65 | I/II | Unknown | Unknown | SD | |
| ST3GAL2 | SNV | Missense_Mutation | novel | c.799G>A | p.Asp267Asn | p.D267N | Q16842 | protein_coding | probably_damaging(0.977) | TCGA-AJ-A3EL-01 | Endometrium | uterine corpus endometrioid carcinoma | Female | <65 | I/II | Unknown | Unknown | SD | |
| ST3GAL2 | SNV | Missense_Mutation | c.682G>A | p.Ala228Thr | p.A228T | Q16842 | protein_coding | benign(0.013) | TCGA-AP-A051-01 | Endometrium | uterine corpus endometrioid carcinoma | Female | >=65 | I/II | Unknown | Unknown | SD |
| Page: 1 2 3 4 |
Top |
Related drugs of malignant transformation related genes |
| Identification of chemicals and drugs interact with genes involved in malignant transfromation |
| (DGIdb 4.0) |
| Entrez ID | Symbol | Category | Interaction Types | Drug Claim Name | Drug Name | PMIDs |
| Page: 1 |

Copyright 2023-Present -The University of Texas Health Science Center at Houston |