
|
|||||
|
 | |
| |
| |
| |
| |
| |
|
Gene: ST3GAL1 |
Gene summary for ST3GAL1 |
| Gene information | Species | Human | Gene symbol | ST3GAL1 | Gene ID | 6482 |
| Gene name | ST3 beta-galactoside alpha-2,3-sialyltransferase 1 | |
| Gene Alias | Gal-NAc6S | |
| Cytomap | 8q24.22 | |
| Gene Type | protein-coding | GO ID | GO:0001573 | UniProtAcc | A0A024R9L6 |
Top |
Malignant transformation analysis |
| Identification of the aberrant gene expression in precancerous and cancerous lesions by comparing the gene expression of stem-like cells in diseased tissues with normal stem cells |
| Entrez ID | Symbol | Replicates | Species | Organ | Tissue | Adj P-value | Log2FC | Malignancy |
| 6482 | ST3GAL1 | LZE4T | Human | Esophagus | ESCC | 9.12e-18 | 7.55e-01 | 0.0811 |
| 6482 | ST3GAL1 | LZE7T | Human | Esophagus | ESCC | 1.73e-04 | 1.28e-01 | 0.0667 |
| 6482 | ST3GAL1 | LZE8T | Human | Esophagus | ESCC | 5.93e-08 | 3.23e-01 | 0.067 |
| 6482 | ST3GAL1 | LZE20T | Human | Esophagus | ESCC | 2.76e-03 | 8.06e-02 | 0.0662 |
| 6482 | ST3GAL1 | LZE24T | Human | Esophagus | ESCC | 1.21e-03 | 1.14e-02 | 0.0596 |
| 6482 | ST3GAL1 | LZE21T | Human | Esophagus | ESCC | 9.70e-04 | 4.09e-01 | 0.0655 |
| 6482 | ST3GAL1 | P1T-E | Human | Esophagus | ESCC | 1.67e-02 | 3.87e-01 | 0.0875 |
| 6482 | ST3GAL1 | P2T-E | Human | Esophagus | ESCC | 5.62e-03 | -3.85e-02 | 0.1177 |
| 6482 | ST3GAL1 | P4T-E | Human | Esophagus | ESCC | 4.38e-04 | 7.77e-02 | 0.1323 |
| 6482 | ST3GAL1 | P5T-E | Human | Esophagus | ESCC | 9.54e-06 | 1.73e-01 | 0.1327 |
| 6482 | ST3GAL1 | P8T-E | Human | Esophagus | ESCC | 8.50e-12 | 4.88e-01 | 0.0889 |
| 6482 | ST3GAL1 | P9T-E | Human | Esophagus | ESCC | 2.23e-07 | 5.06e-02 | 0.1131 |
| 6482 | ST3GAL1 | P10T-E | Human | Esophagus | ESCC | 7.35e-04 | 1.80e-02 | 0.116 |
| 6482 | ST3GAL1 | P12T-E | Human | Esophagus | ESCC | 2.03e-49 | 1.31e+00 | 0.1122 |
| 6482 | ST3GAL1 | P15T-E | Human | Esophagus | ESCC | 7.22e-34 | 8.68e-01 | 0.1149 |
| 6482 | ST3GAL1 | P16T-E | Human | Esophagus | ESCC | 5.38e-11 | 2.56e-01 | 0.1153 |
| 6482 | ST3GAL1 | P21T-E | Human | Esophagus | ESCC | 8.55e-06 | 2.97e-03 | 0.1617 |
| 6482 | ST3GAL1 | P23T-E | Human | Esophagus | ESCC | 1.75e-23 | 5.95e-01 | 0.108 |
| 6482 | ST3GAL1 | P24T-E | Human | Esophagus | ESCC | 7.03e-04 | 8.20e-02 | 0.1287 |
| 6482 | ST3GAL1 | P26T-E | Human | Esophagus | ESCC | 5.96e-33 | 7.10e-01 | 0.1276 |
| Page: 1 2 3 4 5 |
| Tissue | Expression Dynamics | Abbreviation |
| Esophagus |  | ESCC: Esophageal squamous cell carcinoma |
| HGIN: High-grade intraepithelial neoplasias | ||
| LGIN: Low-grade intraepithelial neoplasias | ||
| Liver |  | HCC: Hepatocellular carcinoma |
| NAFLD: Non-alcoholic fatty liver disease | ||
| Lung | 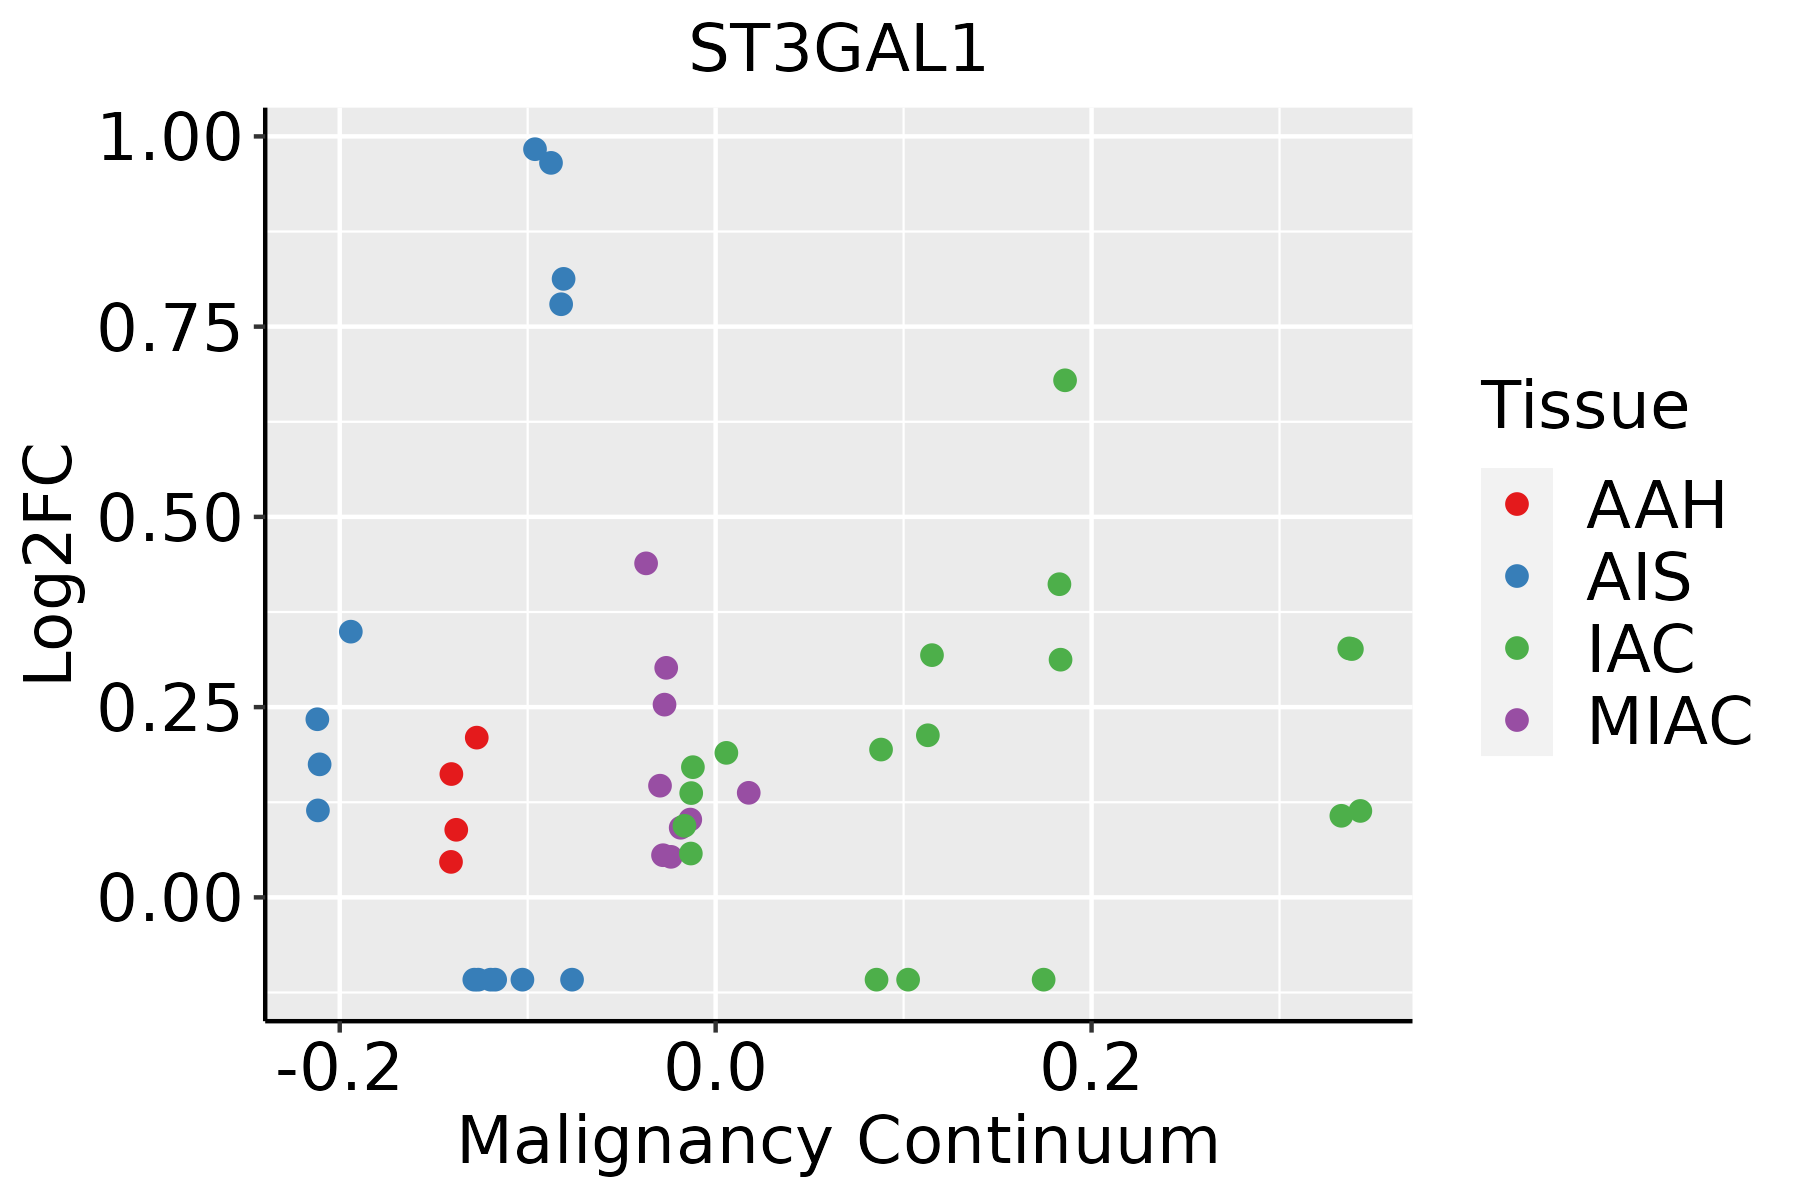 | AAH: Atypical adenomatous hyperplasia |
| AIS: Adenocarcinoma in situ | ||
| IAC: Invasive lung adenocarcinoma | ||
| MIA: Minimally invasive adenocarcinoma | ||
| Thyroid | 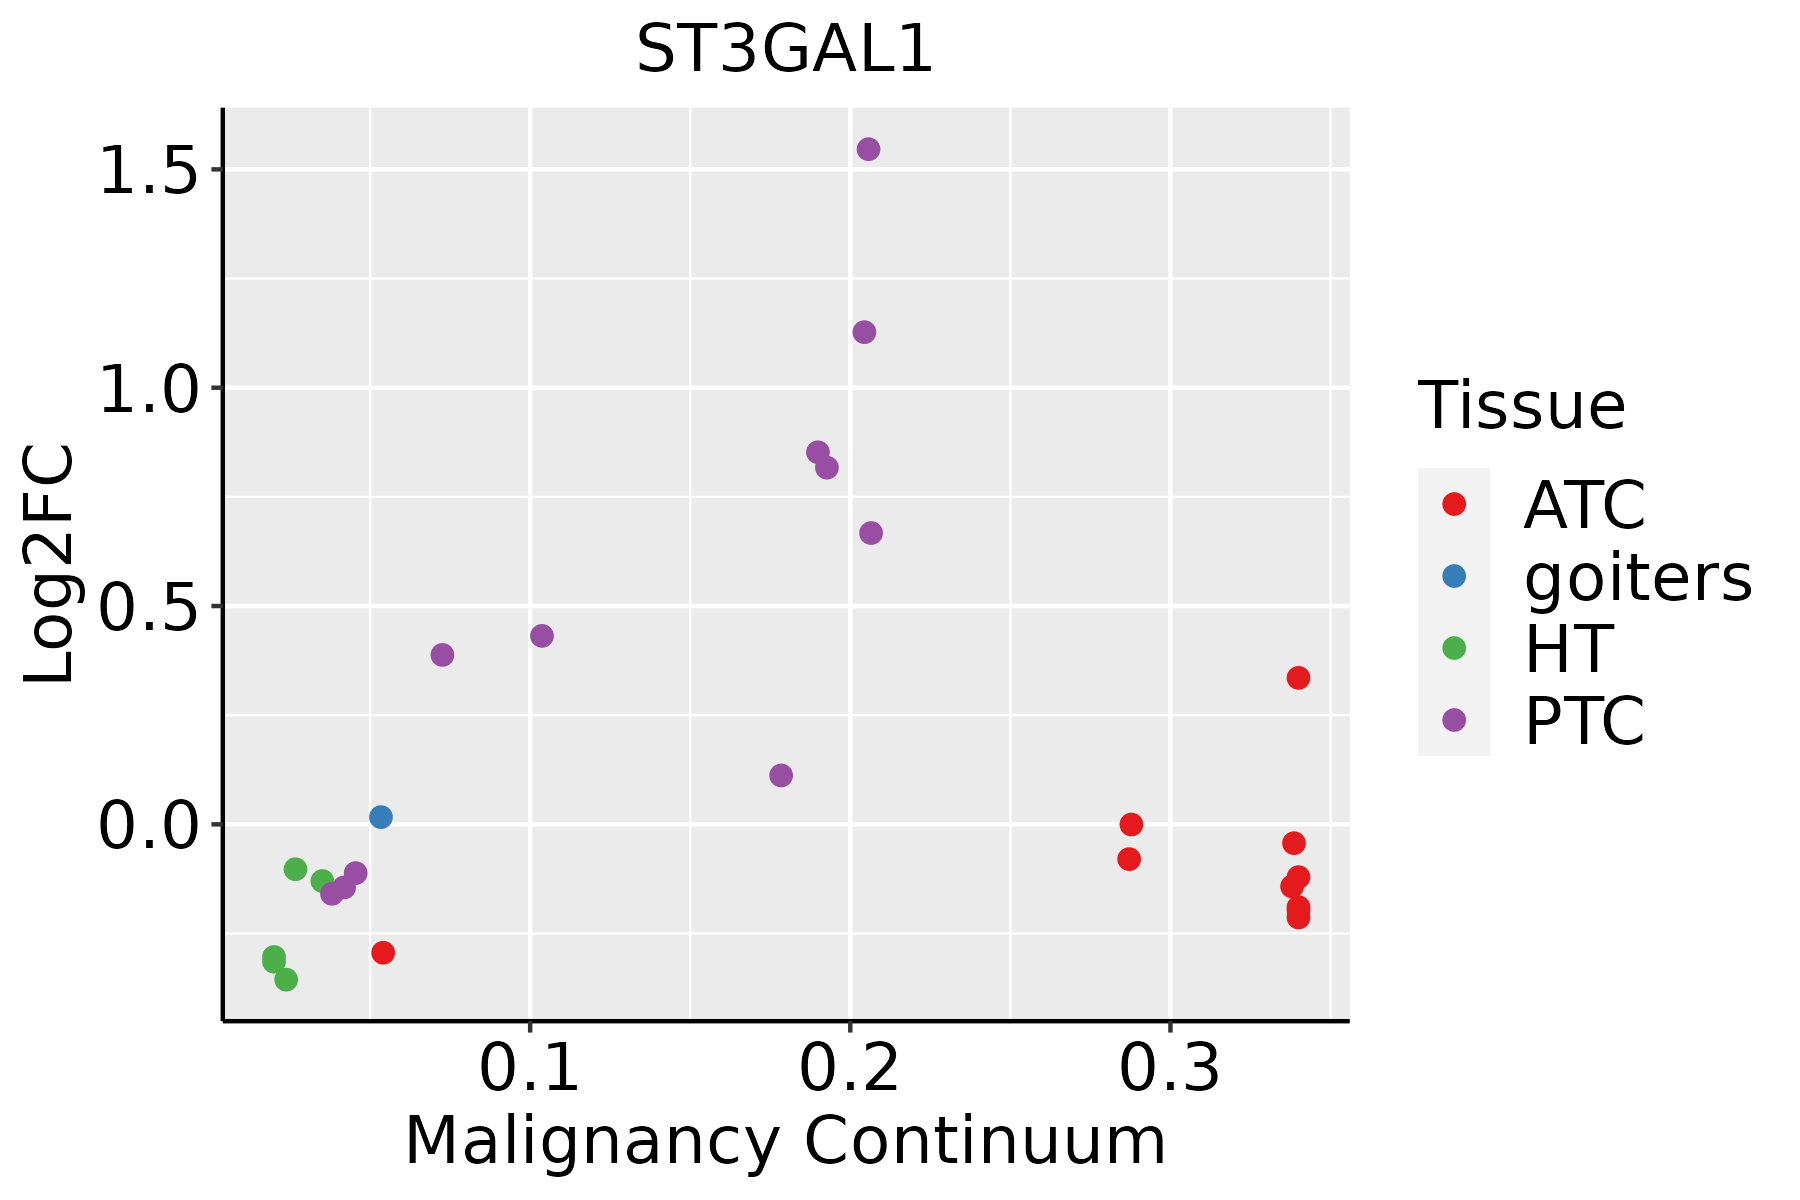 | ATC: Anaplastic thyroid cancer |
| HT: Hashimoto's thyroiditis | ||
| PTC: Papillary thyroid cancer |
| ∗log2FC in expression of this searched gene in stem-like cells from each diseased tissue sample relative to stem-like cells in normal samples in each tissue plotted against the malignancy continuum. Samples are colored based on if they are from different disease stage. |
Top |
Malignant transformation related pathway analysis |
| Find out the enriched GO biological processes and KEGG pathways involved in transition from healthy to precancer to cancer |
| Tissue | Disease Stage | Enriched GO biological Processes |
| Colorectum | AD |  |
| Colorectum | SER |  |
| Colorectum | MSS |  |
| Colorectum | MSI-H |  |
| Colorectum | FAP |  |
| ∗Top 15 enriched GO BP terms are showed in the bar plot of each disease state in each tissue. Each row represents a significant GO biological process which is colored according to the -log10(p.adjust). |
| Page: 1 2 3 4 5 6 7 8 9 |
| GO ID | Tissue | Disease Stage | Description | Gene Ratio | Bg Ratio | pvalue | p.adjust | Count |
| GO:0016032111 | Esophagus | ESCC | viral process | 301/8552 | 415/18723 | 3.34e-29 | 1.32e-26 | 301 |
| GO:001908017 | Esophagus | ESCC | viral gene expression | 80/8552 | 94/18723 | 2.04e-15 | 1.28e-13 | 80 |
| GO:000648714 | Esophagus | ESCC | protein N-linked glycosylation | 51/8552 | 65/18723 | 6.41e-08 | 1.13e-06 | 51 |
| GO:00066433 | Esophagus | ESCC | membrane lipid metabolic process | 130/8552 | 203/18723 | 9.29e-08 | 1.54e-06 | 130 |
| GO:00091002 | Esophagus | ESCC | glycoprotein metabolic process | 226/8552 | 387/18723 | 2.64e-07 | 3.94e-06 | 226 |
| GO:00067906 | Esophagus | ESCC | sulfur compound metabolic process | 201/8552 | 339/18723 | 2.64e-07 | 3.94e-06 | 201 |
| GO:00442725 | Esophagus | ESCC | sulfur compound biosynthetic process | 96/8552 | 148/18723 | 1.86e-06 | 2.16e-05 | 96 |
| GO:00700854 | Esophagus | ESCC | glycosylation | 144/8552 | 240/18723 | 5.12e-06 | 5.38e-05 | 144 |
| GO:00464673 | Esophagus | ESCC | membrane lipid biosynthetic process | 91/8552 | 142/18723 | 7.19e-06 | 7.19e-05 | 91 |
| GO:00064865 | Esophagus | ESCC | protein glycosylation | 135/8552 | 226/18723 | 1.36e-05 | 1.24e-04 | 135 |
| GO:00434135 | Esophagus | ESCC | macromolecule glycosylation | 135/8552 | 226/18723 | 1.36e-05 | 1.24e-04 | 135 |
| GO:00091012 | Esophagus | ESCC | glycoprotein biosynthetic process | 181/8552 | 317/18723 | 2.54e-05 | 2.15e-04 | 181 |
| GO:00066652 | Esophagus | ESCC | sphingolipid metabolic process | 96/8552 | 155/18723 | 3.21e-05 | 2.66e-04 | 96 |
| GO:00190826 | Esophagus | ESCC | viral protein processing | 24/8552 | 29/18723 | 4.50e-05 | 3.55e-04 | 24 |
| GO:00066642 | Esophagus | ESCC | glycolipid metabolic process | 63/8552 | 100/18723 | 3.55e-04 | 2.06e-03 | 63 |
| GO:19035092 | Esophagus | ESCC | liposaccharide metabolic process | 63/8552 | 101/18723 | 5.25e-04 | 2.90e-03 | 63 |
| GO:00718871 | Esophagus | ESCC | leukocyte apoptotic process | 65/8552 | 106/18723 | 8.39e-04 | 4.32e-03 | 65 |
| GO:19031317 | Esophagus | ESCC | mononuclear cell differentiation | 226/8552 | 426/18723 | 1.20e-03 | 5.88e-03 | 226 |
| GO:00702271 | Esophagus | ESCC | lymphocyte apoptotic process | 46/8552 | 72/18723 | 1.39e-03 | 6.62e-03 | 46 |
| GO:00301481 | Esophagus | ESCC | sphingolipid biosynthetic process | 62/8552 | 103/18723 | 2.10e-03 | 9.38e-03 | 62 |
| Page: 1 2 3 4 5 |
| Pathway ID | Tissue | Disease Stage | Description | Gene Ratio | Bg Ratio | pvalue | p.adjust | qvalue | Count |
| Page: 1 |
Top |
Cell-cell communication analysis |
| Identification of potential cell-cell interactions between two cell types and their ligand-receptor pairs for different disease states |
| Ligand | Receptor | LRpair | Pathway | Tissue | Disease Stage |
| Page: 1 |
Top |
Single-cell gene regulatory network inference analysis |
| Find out the significant the regulons (TFs) and the target genes of each regulon across cell types for different disease states |
| TF | Cell Type | Tissue | Disease Stage | Target Gene | RSS | Regulon Activity |
| ∗The dot plots of a searched regulon are shown for all cell subpopulations in each disease state of each tissue based on the regulon specific score inferred using pySCENIC and by calculating the average expression. |
| Page: 1 |
Top |
Somatic mutation of malignant transformation related genes |
| Annotation of somatic variants for genes involved in malignant transformation |
| Hugo Symbol | Variant Class | Variant Classification | dbSNP RS | HGVSc | HGVSp | HGVSp Short | SWISSPROT | BIOTYPE | SIFT | PolyPhen | Tumor Sample Barcode | Tissue | Histology | Sex | Age | Stage | Therapy Types | Drugs | Outcome |
| ST3GAL1 | SNV | Missense_Mutation | c.680C>T | p.Ser227Phe | p.S227F | Q11201 | protein_coding | benign(0.094) | TCGA-EW-A1IZ-01 | Breast | breast invasive carcinoma | Female | <65 | III/IV | Chemotherapy | taxotere | SD | ||
| ST3GAL1 | insertion | Frame_Shift_Ins | novel | c.768_769insT | p.Asp257Ter | p.D257* | Q11201 | protein_coding | TCGA-A8-A09Z-01 | Breast | breast invasive carcinoma | Female | >=65 | I/II | Unknown | Unknown | SD | ||
| ST3GAL1 | deletion | Frame_Shift_Del | novel | c.326delA | p.Lys109SerfsTer5 | p.K109Sfs*5 | Q11201 | protein_coding | TCGA-EW-A2FV-01 | Breast | breast invasive carcinoma | Female | <65 | III/IV | Chemotherapy | docetaxel | SD | ||
| ST3GAL1 | SNV | Missense_Mutation | c.515N>T | p.Ala172Val | p.A172V | Q11201 | protein_coding | possibly_damaging(0.885) | TCGA-FU-A3HZ-01 | Cervix | cervical & endocervical cancer | Female | <65 | I/II | Chemotherapy | cisplatin | CR | ||
| ST3GAL1 | SNV | Missense_Mutation | c.1019N>A | p.Arg340Lys | p.R340K | Q11201 | protein_coding | benign(0.277) | TCGA-IR-A3LA-01 | Cervix | cervical & endocervical cancer | Female | <65 | I/II | Chemotherapy | cisplatin | CR | ||
| ST3GAL1 | SNV | Missense_Mutation | rs145826176 | c.430G>A | p.Val144Ile | p.V144I | Q11201 | protein_coding | possibly_damaging(0.851) | TCGA-AA-3673-01 | Colorectum | colon adenocarcinoma | Female | <65 | I/II | Unknown | Unknown | SD | |
| ST3GAL1 | SNV | Missense_Mutation | c.628N>G | p.Lys210Glu | p.K210E | Q11201 | protein_coding | probably_damaging(0.999) | TCGA-AA-3811-01 | Colorectum | colon adenocarcinoma | Female | >=65 | III/IV | Unknown | Unknown | PD | ||
| ST3GAL1 | SNV | Missense_Mutation | novel | c.755N>G | p.Ile252Ser | p.I252S | Q11201 | protein_coding | probably_damaging(0.925) | TCGA-AA-A02H-01 | Colorectum | colon adenocarcinoma | Female | >=65 | III/IV | Unknown | Unknown | PD | |
| ST3GAL1 | SNV | Missense_Mutation | rs145826176 | c.430N>A | p.Val144Ile | p.V144I | Q11201 | protein_coding | possibly_damaging(0.851) | TCGA-AD-A5EJ-01 | Colorectum | colon adenocarcinoma | Female | >=65 | I/II | Unknown | Unknown | SD | |
| ST3GAL1 | SNV | Missense_Mutation | c.572N>G | p.Tyr191Cys | p.Y191C | Q11201 | protein_coding | probably_damaging(1) | TCGA-AU-6004-01 | Colorectum | colon adenocarcinoma | Female | >=65 | I/II | Unknown | Unknown | SD |
| Page: 1 2 3 4 5 |
Top |
Related drugs of malignant transformation related genes |
| Identification of chemicals and drugs interact with genes involved in malignant transfromation |
| (DGIdb 4.0) |
| Entrez ID | Symbol | Category | Interaction Types | Drug Claim Name | Drug Name | PMIDs |
| Page: 1 |

Copyright 2023-Present -The University of Texas Health Science Center at Houston |