
|
|||||
|
 | |
| |
| |
| |
| |
| |
|
Gene: ST18 |
Gene summary for ST18 |
| Gene information | Species | Human | Gene symbol | ST18 | Gene ID | 9705 |
| Gene name | ST18 C2H2C-type zinc finger transcription factor | |
| Gene Alias | NZF-3 | |
| Cytomap | 8q11.23 | |
| Gene Type | protein-coding | GO ID | GO:0006139 | UniProtAcc | O60284 |
Top |
Malignant transformation analysis |
| Identification of the aberrant gene expression in precancerous and cancerous lesions by comparing the gene expression of stem-like cells in diseased tissues with normal stem cells |
| Entrez ID | Symbol | Replicates | Species | Organ | Tissue | Adj P-value | Log2FC | Malignancy |
| 9705 | ST18 | S014 | Human | Liver | HCC | 8.94e-42 | 1.41e+00 | 0.2254 |
| 9705 | ST18 | S015 | Human | Liver | HCC | 1.46e-36 | 1.81e+00 | 0.2375 |
| 9705 | ST18 | S016 | Human | Liver | HCC | 2.70e-58 | 1.59e+00 | 0.2243 |
| 9705 | ST18 | HTA12-15-2 | Human | Pancreas | PDAC | 3.78e-09 | 5.85e-01 | 0.2315 |
| 9705 | ST18 | HTA12-23-1 | Human | Pancreas | PDAC | 1.09e-21 | 1.32e+00 | 0.3405 |
| 9705 | ST18 | HTA12-25-1 | Human | Pancreas | PDAC | 9.43e-22 | 1.13e+00 | 0.313 |
| 9705 | ST18 | HTA12-26-1 | Human | Pancreas | PDAC | 3.31e-53 | 1.70e+00 | 0.3728 |
| 9705 | ST18 | HTA12-29-1 | Human | Pancreas | PDAC | 2.32e-85 | 1.43e+00 | 0.3722 |
| 9705 | ST18 | HTA12-30-1 | Human | Pancreas | PDAC | 2.27e-04 | 1.11e+00 | 0.3671 |
| 9705 | ST18 | HTA12-32-1 | Human | Pancreas | PDAC | 1.11e-06 | 1.00e+00 | 0.3624 |
| Page: 1 |
| Tissue | Expression Dynamics | Abbreviation |
| Liver | 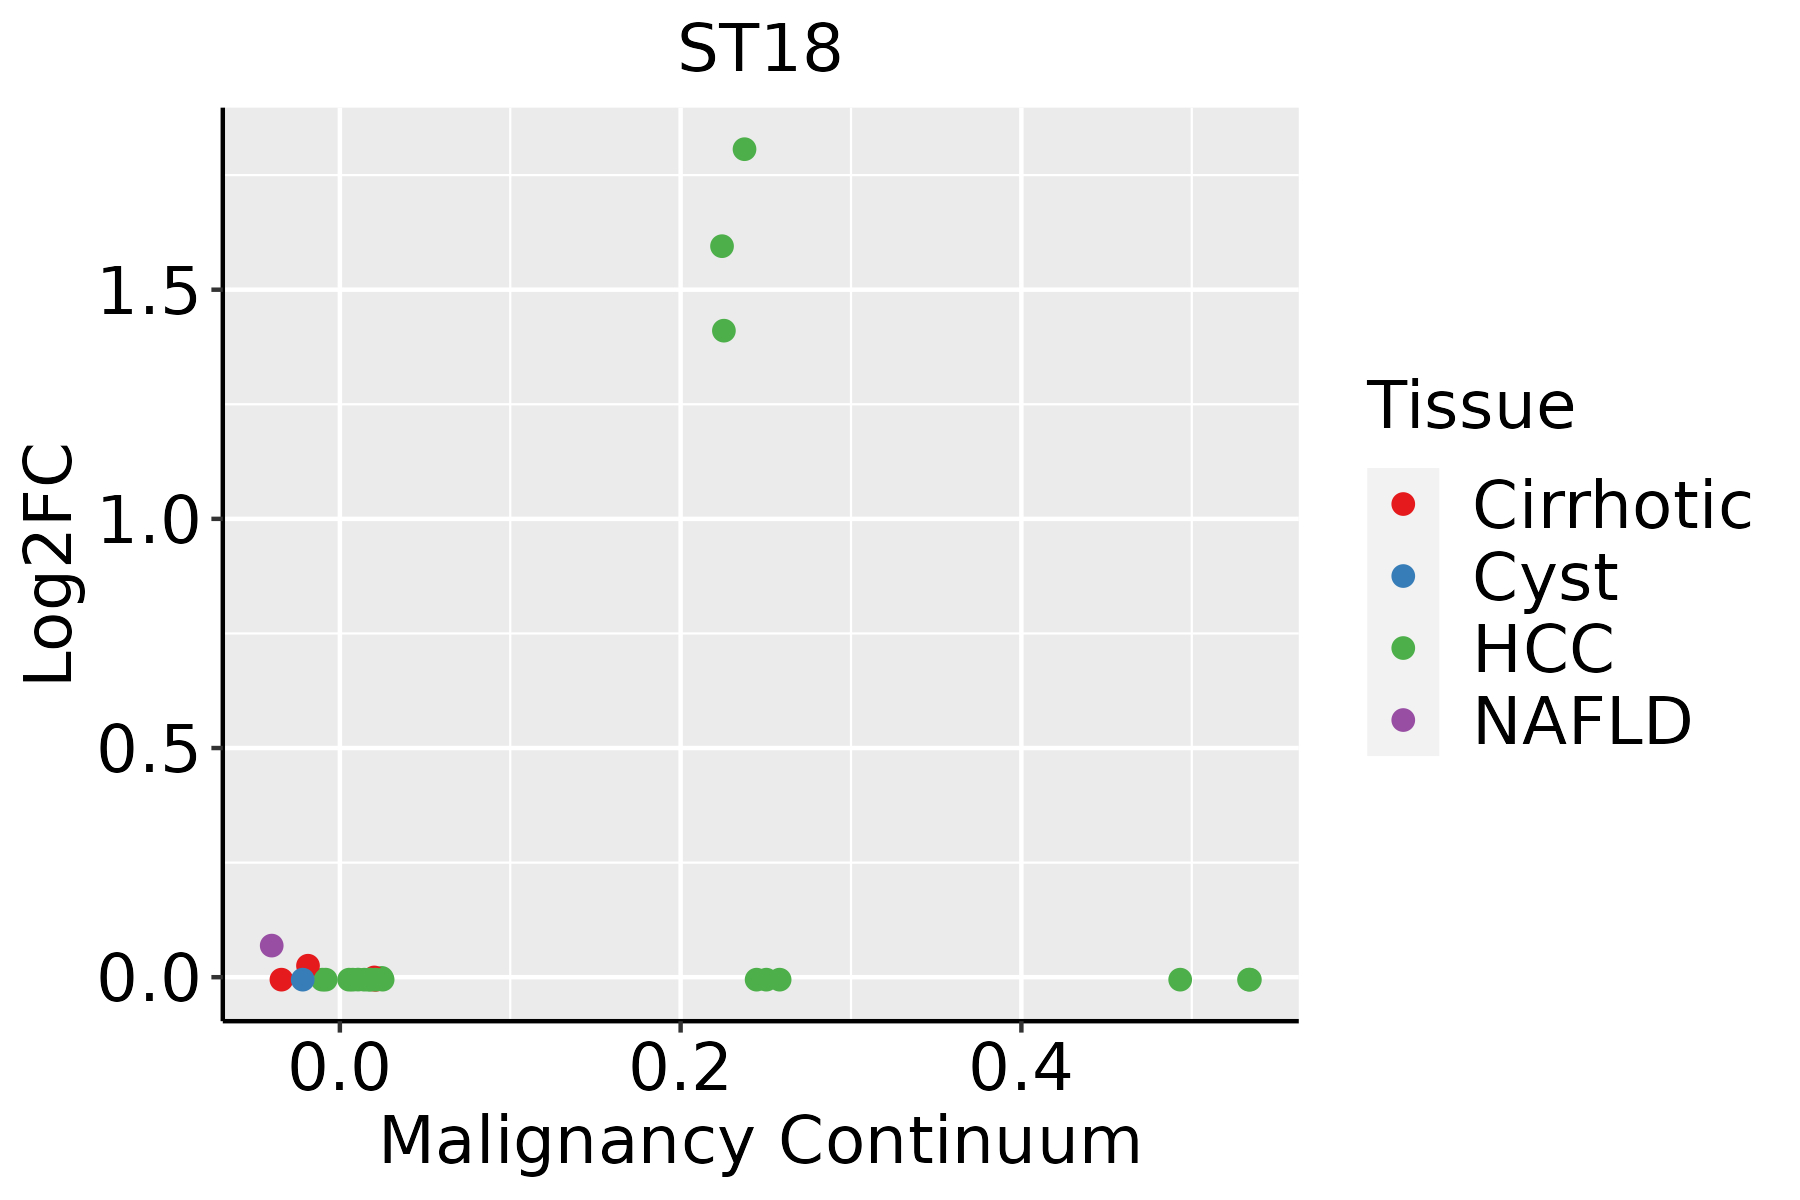 | HCC: Hepatocellular carcinoma |
| NAFLD: Non-alcoholic fatty liver disease |
| ∗log2FC in expression of this searched gene in stem-like cells from each diseased tissue sample relative to stem-like cells in normal samples in each tissue plotted against the malignancy continuum. Samples are colored based on if they are from different disease stage. |
Top |
Malignant transformation related pathway analysis |
| Find out the enriched GO biological processes and KEGG pathways involved in transition from healthy to precancer to cancer |
| Tissue | Disease Stage | Enriched GO biological Processes |
| Colorectum | AD |  |
| Colorectum | SER |  |
| Colorectum | MSS |  |
| Colorectum | MSI-H |  |
| Colorectum | FAP |  |
| ∗Top 15 enriched GO BP terms are showed in the bar plot of each disease state in each tissue. Each row represents a significant GO biological process which is colored according to the -log10(p.adjust). |
| Page: 1 2 3 4 5 6 7 8 9 |
| GO ID | Tissue | Disease Stage | Description | Gene Ratio | Bg Ratio | pvalue | p.adjust | Count |
| GO:004586222 | Liver | HCC | positive regulation of proteolysis | 232/7958 | 372/18723 | 5.66e-15 | 3.98e-13 | 232 |
| GO:004328112 | Liver | HCC | regulation of cysteine-type endopeptidase activity involved in apoptotic process | 125/7958 | 209/18723 | 3.12e-07 | 5.42e-06 | 125 |
| GO:200011612 | Liver | HCC | regulation of cysteine-type endopeptidase activity | 137/7958 | 235/18723 | 6.91e-07 | 1.08e-05 | 137 |
| GO:005254722 | Liver | HCC | regulation of peptidase activity | 247/7958 | 461/18723 | 8.28e-07 | 1.27e-05 | 247 |
| GO:005254822 | Liver | HCC | regulation of endopeptidase activity | 230/7958 | 432/18723 | 3.58e-06 | 4.68e-05 | 230 |
| GO:001095212 | Liver | HCC | positive regulation of peptidase activity | 110/7958 | 197/18723 | 1.04e-04 | 8.98e-04 | 110 |
| GO:00705551 | Liver | HCC | response to interleukin-1 | 80/7958 | 143/18723 | 7.95e-04 | 4.77e-03 | 80 |
| GO:003461211 | Liver | HCC | response to tumor necrosis factor | 132/7958 | 253/18723 | 1.14e-03 | 6.48e-03 | 132 |
| GO:001095012 | Liver | HCC | positive regulation of endopeptidase activity | 96/7958 | 179/18723 | 1.68e-03 | 8.79e-03 | 96 |
| GO:004328012 | Liver | HCC | positive regulation of cysteine-type endopeptidase activity involved in apoptotic process | 70/7958 | 129/18723 | 4.58e-03 | 1.97e-02 | 70 |
| GO:200105612 | Liver | HCC | positive regulation of cysteine-type endopeptidase activity | 79/7958 | 148/18723 | 4.82e-03 | 2.03e-02 | 79 |
| GO:00713471 | Liver | HCC | cellular response to interleukin-1 | 61/7958 | 113/18723 | 8.98e-03 | 3.46e-02 | 61 |
| GO:007135611 | Liver | HCC | cellular response to tumor necrosis factor | 115/7958 | 229/18723 | 1.08e-02 | 3.99e-02 | 115 |
| Page: 1 |
| Pathway ID | Tissue | Disease Stage | Description | Gene Ratio | Bg Ratio | pvalue | p.adjust | qvalue | Count |
| Page: 1 |
Top |
Cell-cell communication analysis |
| Identification of potential cell-cell interactions between two cell types and their ligand-receptor pairs for different disease states |
| Ligand | Receptor | LRpair | Pathway | Tissue | Disease Stage |
| Page: 1 |
Top |
Single-cell gene regulatory network inference analysis |
| Find out the significant the regulons (TFs) and the target genes of each regulon across cell types for different disease states |
| TF | Cell Type | Tissue | Disease Stage | Target Gene | RSS | Regulon Activity |
| ∗The dot plots of a searched regulon are shown for all cell subpopulations in each disease state of each tissue based on the regulon specific score inferred using pySCENIC and by calculating the average expression. |
| Page: 1 |
Top |
Somatic mutation of malignant transformation related genes |
| Annotation of somatic variants for genes involved in malignant transformation |
| Hugo Symbol | Variant Class | Variant Classification | dbSNP RS | HGVSc | HGVSp | HGVSp Short | SWISSPROT | BIOTYPE | SIFT | PolyPhen | Tumor Sample Barcode | Tissue | Histology | Sex | Age | Stage | Therapy Types | Drugs | Outcome |
| ST18 | SNV | Missense_Mutation | novel | c.2018N>A | p.Ser673Asn | p.S673N | O60284 | protein_coding | deleterious(0.04) | possibly_damaging(0.646) | TCGA-5L-AAT1-01 | Breast | breast invasive carcinoma | Female | <65 | III/IV | Hormone Therapy | letrozol | SD |
| ST18 | SNV | Missense_Mutation | c.2719N>A | p.Glu907Lys | p.E907K | O60284 | protein_coding | deleterious(0.01) | probably_damaging(0.996) | TCGA-A2-A0YK-01 | Breast | breast invasive carcinoma | Female | <65 | I/II | Chemotherapy | cytoxan | SD | |
| ST18 | SNV | Missense_Mutation | c.2849N>G | p.Leu950Arg | p.L950R | O60284 | protein_coding | deleterious(0) | probably_damaging(0.999) | TCGA-A8-A07W-01 | Breast | breast invasive carcinoma | Female | >=65 | III/IV | Hormone Therapy | exemestane | SD | |
| ST18 | SNV | Missense_Mutation | c.2732N>T | p.Thr911Ile | p.T911I | O60284 | protein_coding | deleterious(0) | probably_damaging(0.952) | TCGA-A8-A09Z-01 | Breast | breast invasive carcinoma | Female | >=65 | I/II | Unknown | Unknown | SD | |
| ST18 | SNV | Missense_Mutation | c.328N>C | p.Glu110Gln | p.E110Q | O60284 | protein_coding | tolerated(0.07) | benign(0.05) | TCGA-AC-A23H-01 | Breast | breast invasive carcinoma | Female | >=65 | I/II | Unknown | Unknown | PD | |
| ST18 | SNV | Missense_Mutation | c.716N>C | p.Glu239Ala | p.E239A | O60284 | protein_coding | deleterious(0.01) | benign(0.182) | TCGA-AN-A0FV-01 | Breast | breast invasive carcinoma | Female | <65 | I/II | Unknown | Unknown | SD | |
| ST18 | SNV | Missense_Mutation | c.2785N>A | p.Leu929Met | p.L929M | O60284 | protein_coding | deleterious(0) | probably_damaging(0.999) | TCGA-BH-A0HX-01 | Breast | breast invasive carcinoma | Female | <65 | I/II | Chemotherapy | adrimycin | SD | |
| ST18 | SNV | Missense_Mutation | c.2752N>A | p.Gly918Arg | p.G918R | O60284 | protein_coding | deleterious(0.04) | probably_damaging(0.913) | TCGA-BH-A0RX-01 | Breast | breast invasive carcinoma | Female | <65 | I/II | Chemotherapy | fluorouracil | SD | |
| ST18 | SNV | Missense_Mutation | c.493N>C | p.Asp165His | p.D165H | O60284 | protein_coding | deleterious(0.03) | benign(0.005) | TCGA-BH-A2L8-01 | Breast | breast invasive carcinoma | Female | <65 | I/II | Chemotherapy | cytoxan | CR | |
| ST18 | SNV | Missense_Mutation | c.1757N>T | p.Arg586Met | p.R586M | O60284 | protein_coding | deleterious(0.02) | probably_damaging(0.992) | TCGA-C8-A12T-01 | Breast | breast invasive carcinoma | Female | <65 | I/II | Unknown | Unknown | SD |
| Page: 1 2 3 4 5 6 7 8 9 10 11 12 13 14 15 16 17 18 19 20 21 |
Top |
Related drugs of malignant transformation related genes |
| Identification of chemicals and drugs interact with genes involved in malignant transfromation |
| (DGIdb 4.0) |
| Entrez ID | Symbol | Category | Interaction Types | Drug Claim Name | Drug Name | PMIDs |
| Page: 1 |

Copyright 2023-Present -The University of Texas Health Science Center at Houston |