
|
|||||
|
 | |
| |
| |
| |
| |
| |
|
Gene: ST14 |
Gene summary for ST14 |
| Gene information | Species | Human | Gene symbol | ST14 | Gene ID | 6768 |
| Gene name | ST14 transmembrane serine protease matriptase | |
| Gene Alias | ARCI11 | |
| Cytomap | 11q24.3 | |
| Gene Type | protein-coding | GO ID | GO:0000003 | UniProtAcc | Q9Y5Y6 |
Top |
Malignant transformation analysis |
| Identification of the aberrant gene expression in precancerous and cancerous lesions by comparing the gene expression of stem-like cells in diseased tissues with normal stem cells |
| Entrez ID | Symbol | Replicates | Species | Organ | Tissue | Adj P-value | Log2FC | Malignancy |
| 6768 | ST14 | HTA11_2487_2000001011 | Human | Colorectum | SER | 5.43e-14 | 9.40e-01 | -0.1808 |
| 6768 | ST14 | HTA11_1938_2000001011 | Human | Colorectum | AD | 6.16e-15 | 1.02e+00 | -0.0811 |
| 6768 | ST14 | HTA11_347_2000001011 | Human | Colorectum | AD | 2.74e-46 | 1.25e+00 | -0.1954 |
| 6768 | ST14 | HTA11_411_2000001011 | Human | Colorectum | SER | 2.62e-14 | 1.93e+00 | -0.2602 |
| 6768 | ST14 | HTA11_2112_2000001011 | Human | Colorectum | SER | 1.43e-16 | 1.49e+00 | -0.2196 |
| 6768 | ST14 | HTA11_3361_2000001011 | Human | Colorectum | AD | 1.57e-12 | 9.54e-01 | -0.1207 |
| 6768 | ST14 | HTA11_83_2000001011 | Human | Colorectum | SER | 1.52e-13 | 9.74e-01 | -0.1526 |
| 6768 | ST14 | HTA11_696_2000001011 | Human | Colorectum | AD | 4.24e-39 | 1.25e+00 | -0.1464 |
| 6768 | ST14 | HTA11_866_2000001011 | Human | Colorectum | AD | 2.90e-19 | 7.88e-01 | -0.1001 |
| 6768 | ST14 | HTA11_1391_2000001011 | Human | Colorectum | AD | 1.84e-22 | 1.19e+00 | -0.059 |
| 6768 | ST14 | HTA11_2992_2000001011 | Human | Colorectum | SER | 3.83e-04 | 7.27e-01 | -0.1706 |
| 6768 | ST14 | HTA11_5212_2000001011 | Human | Colorectum | AD | 4.70e-09 | 9.95e-01 | -0.2061 |
| 6768 | ST14 | HTA11_5216_2000001011 | Human | Colorectum | SER | 3.42e-08 | 9.10e-01 | -0.1462 |
| 6768 | ST14 | HTA11_546_2000001011 | Human | Colorectum | AD | 8.41e-16 | 1.10e+00 | -0.0842 |
| 6768 | ST14 | HTA11_866_3004761011 | Human | Colorectum | AD | 1.74e-25 | 1.10e+00 | 0.096 |
| 6768 | ST14 | HTA11_8622_2000001021 | Human | Colorectum | SER | 5.15e-05 | 7.56e-01 | 0.0528 |
| 6768 | ST14 | HTA11_7663_2000001011 | Human | Colorectum | SER | 6.11e-14 | 1.18e+00 | 0.0131 |
| 6768 | ST14 | HTA11_10623_2000001011 | Human | Colorectum | AD | 9.32e-14 | 1.01e+00 | -0.0177 |
| 6768 | ST14 | HTA11_6801_2000001011 | Human | Colorectum | SER | 4.73e-05 | 8.03e-01 | 0.0171 |
| 6768 | ST14 | HTA11_10711_2000001011 | Human | Colorectum | AD | 3.05e-12 | 7.75e-01 | 0.0338 |
| Page: 1 2 3 4 5 6 7 8 9 10 11 |
| Tissue | Expression Dynamics | Abbreviation |
| Colorectum (GSE201348) |  | FAP: Familial adenomatous polyposis |
| CRC: Colorectal cancer | ||
| Colorectum (HTA11) |  | AD: Adenomas |
| SER: Sessile serrated lesions | ||
| MSI-H: Microsatellite-high colorectal cancer | ||
| MSS: Microsatellite stable colorectal cancer | ||
| Endometrium |  | AEH: Atypical endometrial hyperplasia |
| EEC: Endometrioid Cancer | ||
| Esophagus | 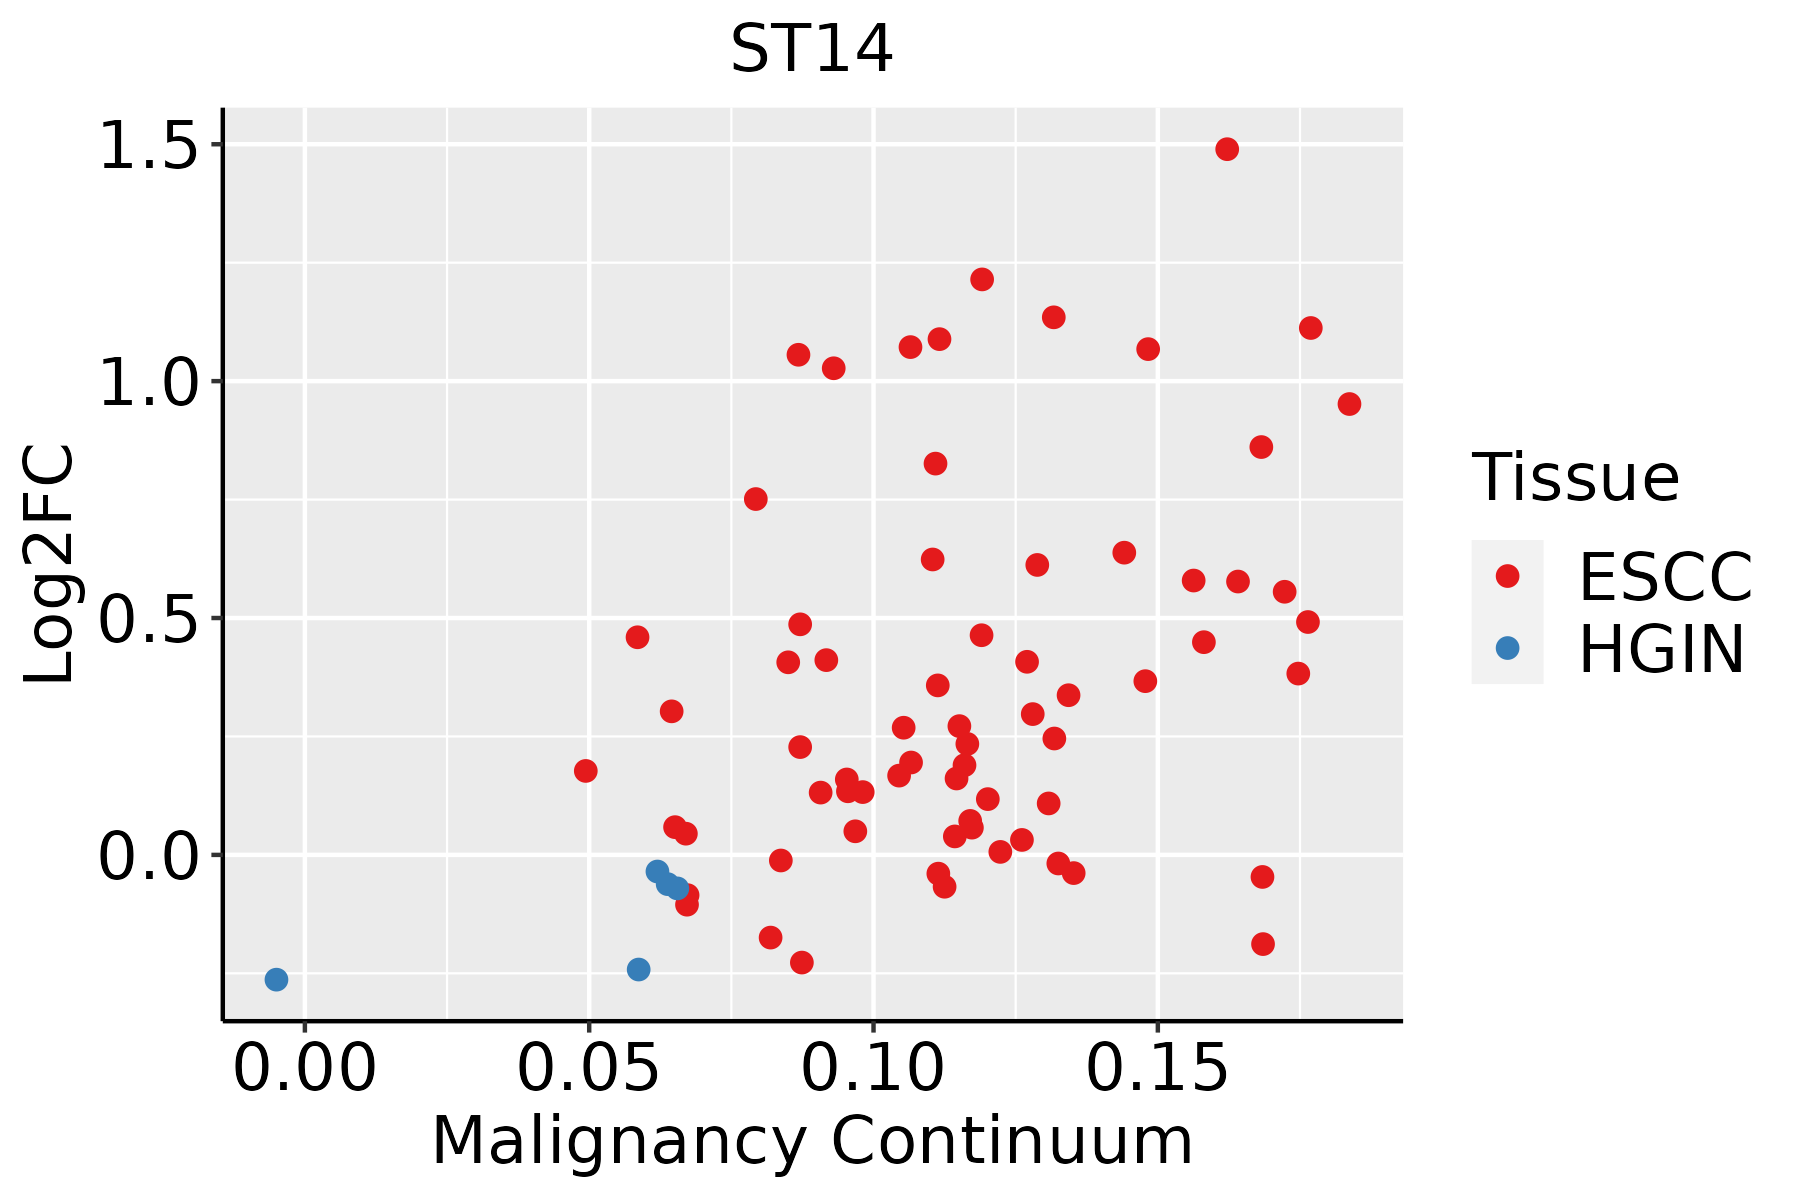 | ESCC: Esophageal squamous cell carcinoma |
| HGIN: High-grade intraepithelial neoplasias | ||
| LGIN: Low-grade intraepithelial neoplasias | ||
| GC |  | CAG: Chronic atrophic gastritis |
| CAG with IM: Chronic atrophic gastritis with intestinal metaplasia | ||
| CSG: Chronic superficial gastritis | ||
| GC: Gastric cancer | ||
| SIM: Severe intestinal metaplasia | ||
| WIM: Wild intestinal metaplasia | ||
| Lung | 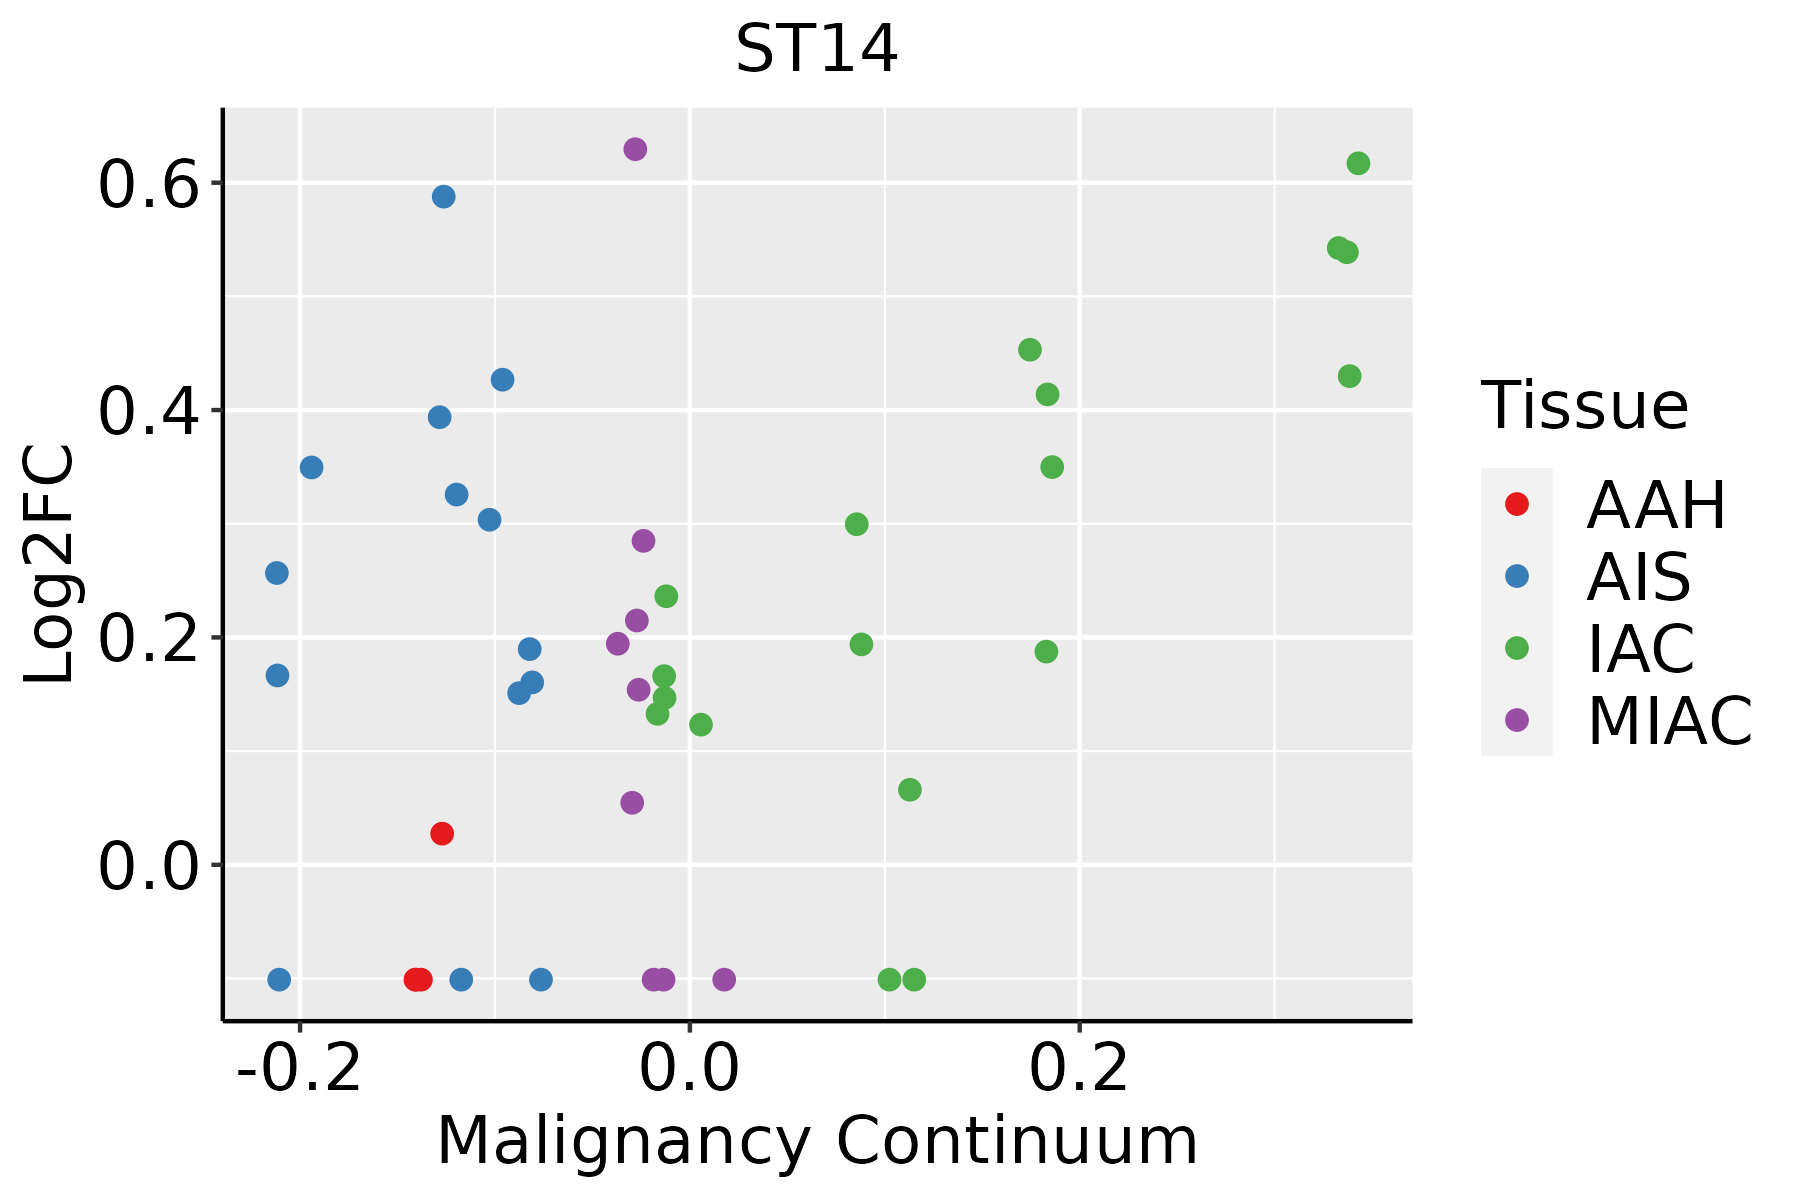 | AAH: Atypical adenomatous hyperplasia |
| AIS: Adenocarcinoma in situ | ||
| IAC: Invasive lung adenocarcinoma | ||
| MIA: Minimally invasive adenocarcinoma | ||
| Oral Cavity | 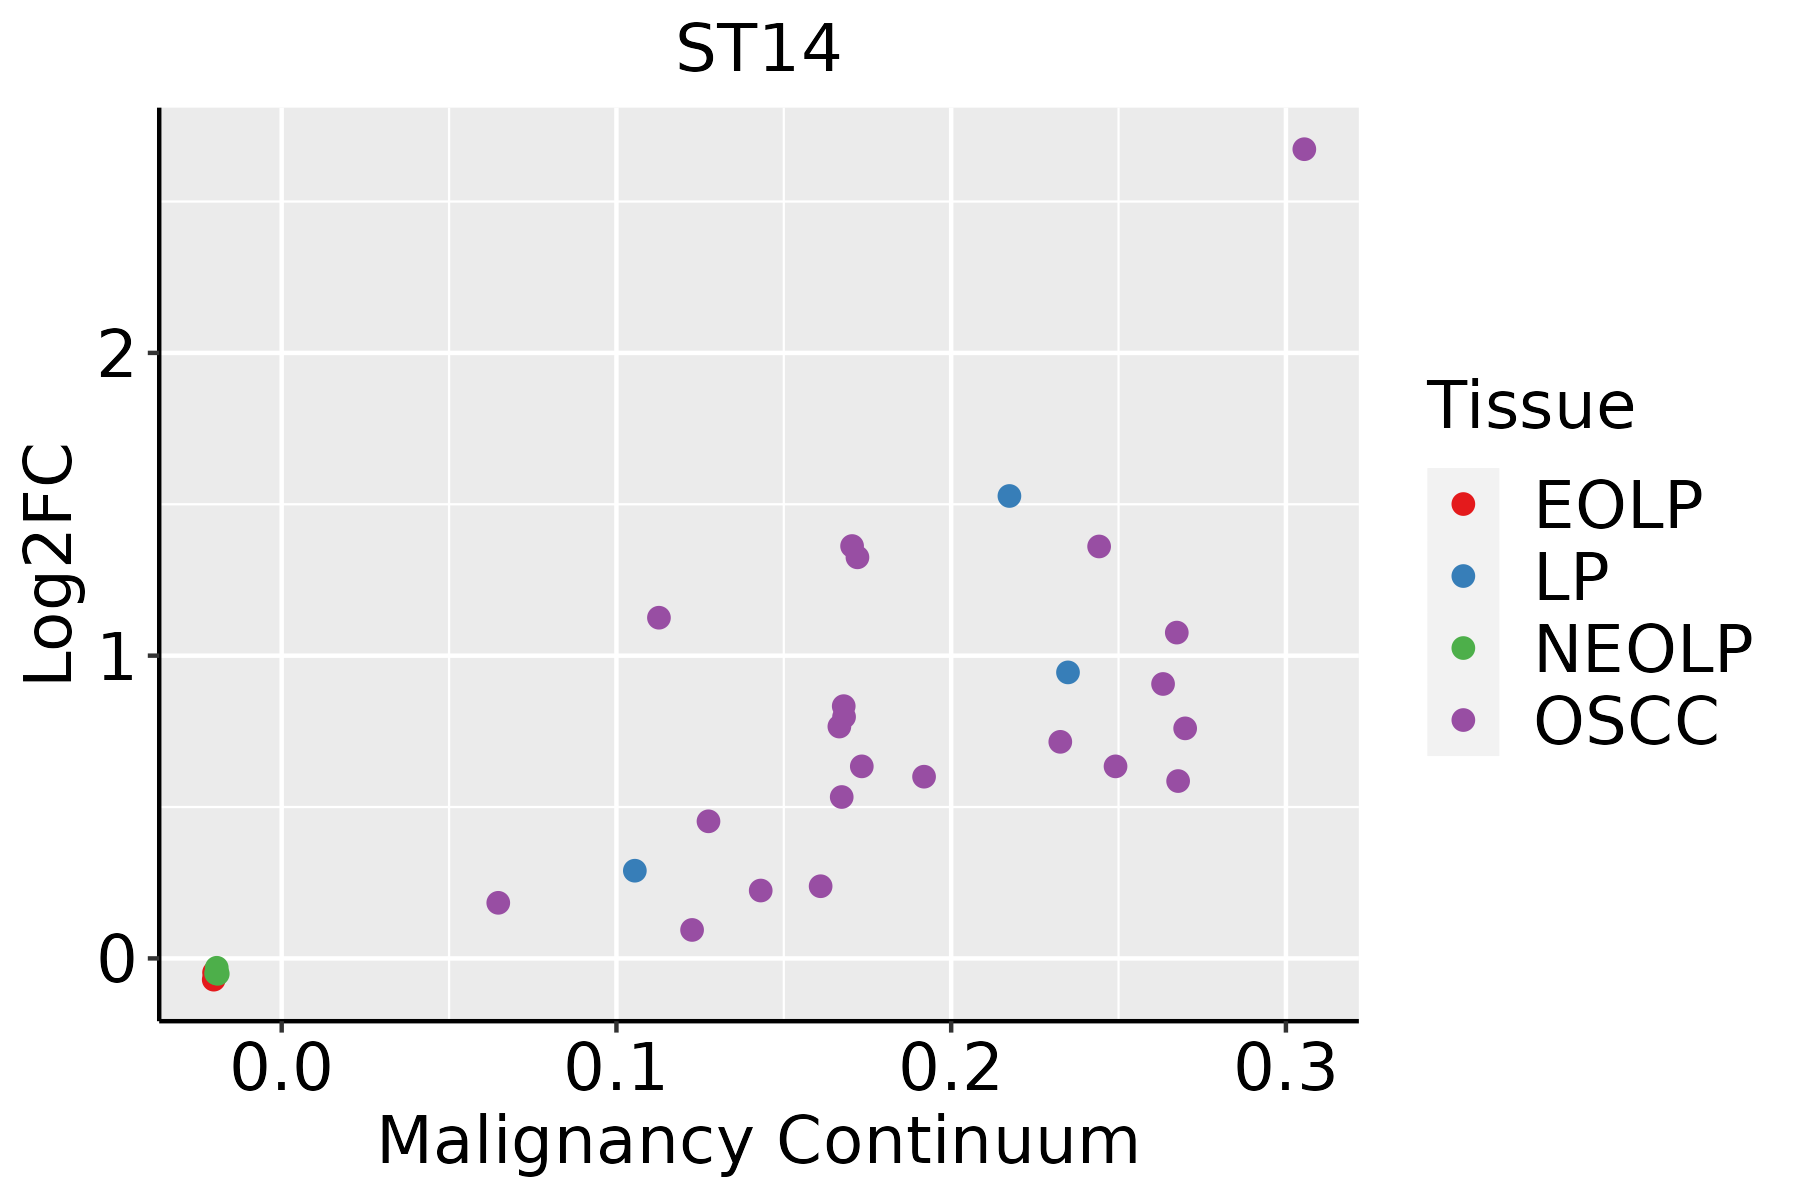 | EOLP: Erosive Oral lichen planus |
| LP: leukoplakia | ||
| NEOLP: Non-erosive oral lichen planus | ||
| OSCC: Oral squamous cell carcinoma | ||
| Prostate |  | BPH: Benign Prostatic Hyperplasia |
| Skin |  | AK: Actinic keratosis |
| cSCC: Cutaneous squamous cell carcinoma | ||
| SCCIS:squamous cell carcinoma in situ | ||
| Thyroid | 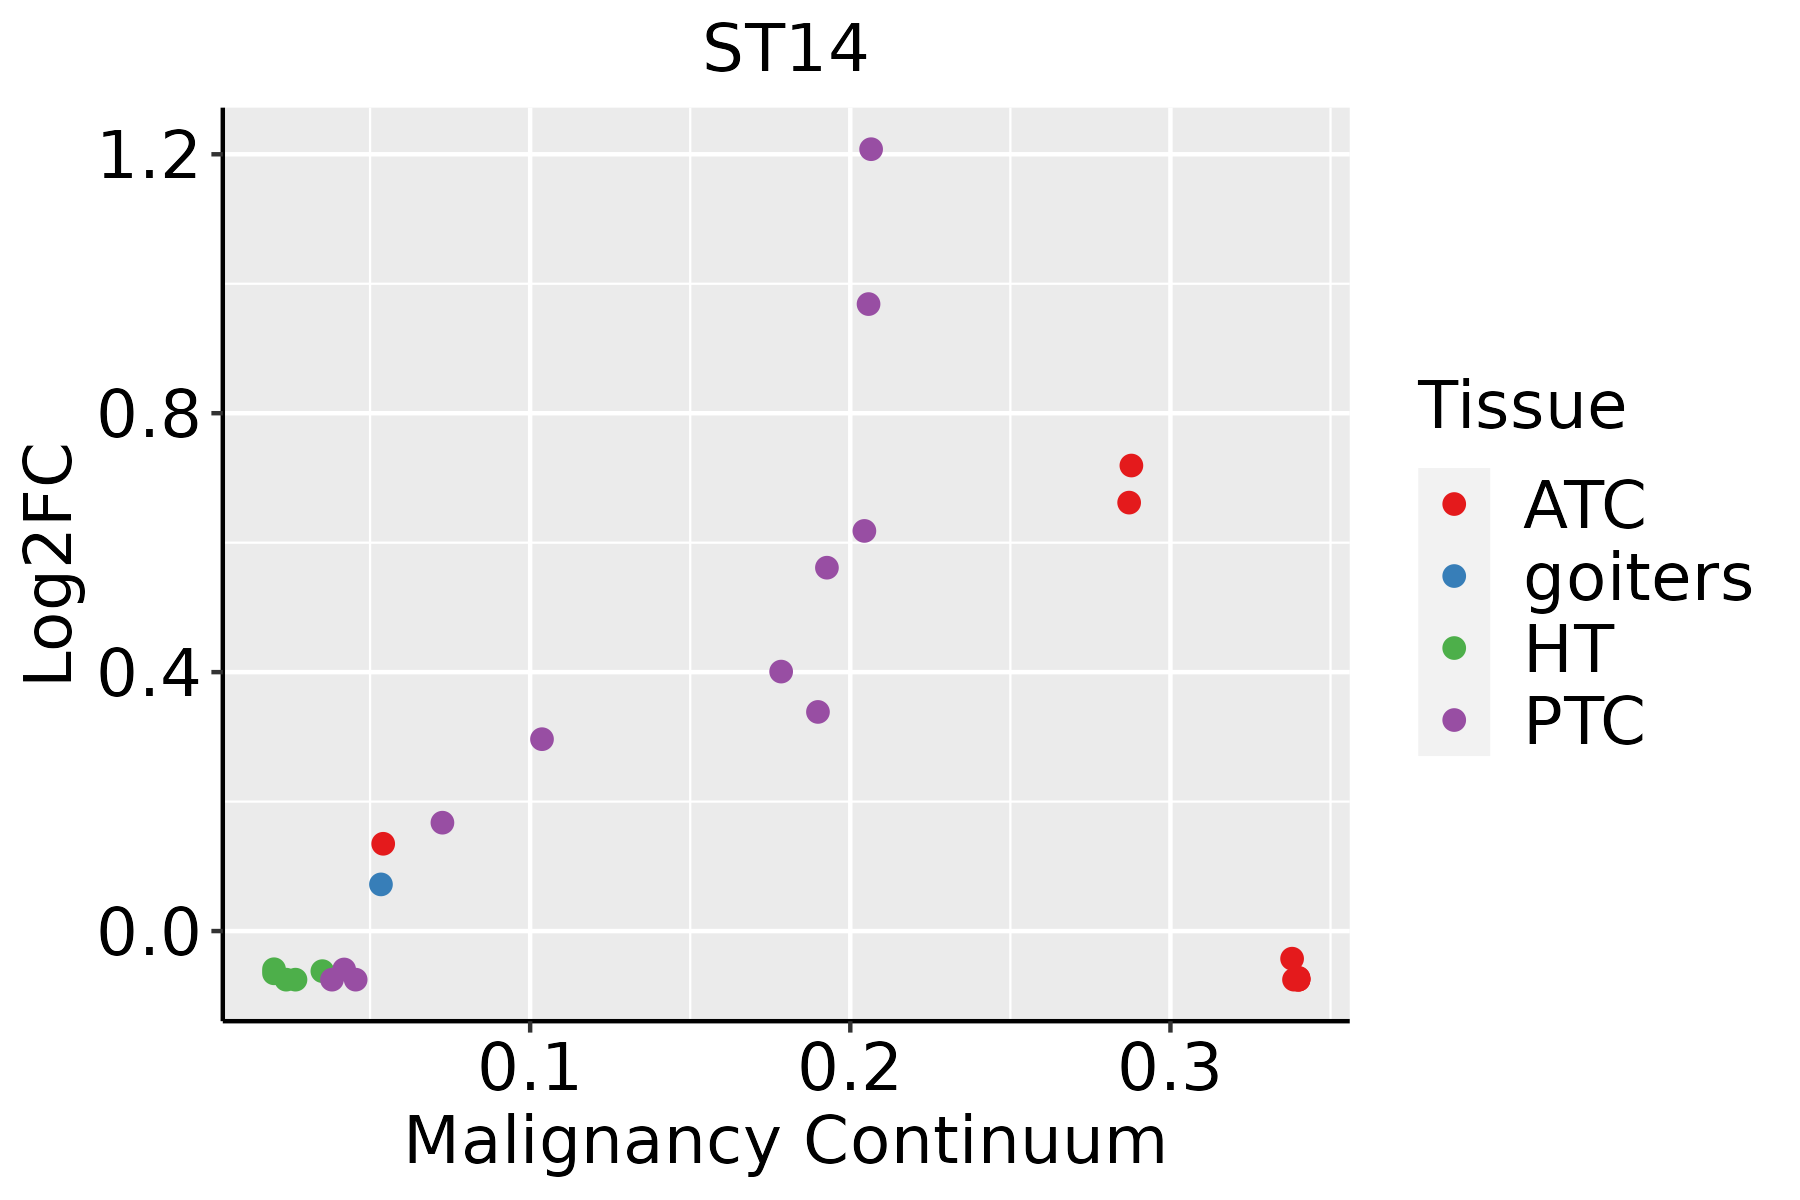 | ATC: Anaplastic thyroid cancer |
| HT: Hashimoto's thyroiditis | ||
| PTC: Papillary thyroid cancer |
| ∗log2FC in expression of this searched gene in stem-like cells from each diseased tissue sample relative to stem-like cells in normal samples in each tissue plotted against the malignancy continuum. Samples are colored based on if they are from different disease stage. |
Top |
Malignant transformation related pathway analysis |
| Find out the enriched GO biological processes and KEGG pathways involved in transition from healthy to precancer to cancer |
| Tissue | Disease Stage | Enriched GO biological Processes |
| Colorectum | AD |  |
| Colorectum | SER |  |
| Colorectum | MSS |  |
| Colorectum | MSI-H |  |
| Colorectum | FAP |  |
| ∗Top 15 enriched GO BP terms are showed in the bar plot of each disease state in each tissue. Each row represents a significant GO biological process which is colored according to the -log10(p.adjust). |
| Page: 1 2 3 4 5 6 7 8 9 |
| GO ID | Tissue | Disease Stage | Description | Gene Ratio | Bg Ratio | pvalue | p.adjust | Count |
| GO:0002064 | Colorectum | AD | epithelial cell development | 89/3918 | 220/18723 | 2.98e-11 | 3.52e-09 | 89 |
| GO:0001701 | Colorectum | AD | in utero embryonic development | 110/3918 | 367/18723 | 2.36e-05 | 4.62e-04 | 110 |
| GO:0001890 | Colorectum | AD | placenta development | 51/3918 | 144/18723 | 3.99e-05 | 7.16e-04 | 51 |
| GO:0001892 | Colorectum | AD | embryonic placenta development | 33/3918 | 82/18723 | 5.30e-05 | 9.01e-04 | 33 |
| GO:0060562 | Colorectum | AD | epithelial tube morphogenesis | 93/3918 | 325/18723 | 5.65e-04 | 6.00e-03 | 93 |
| GO:0060711 | Colorectum | AD | labyrinthine layer development | 19/3918 | 44/18723 | 7.13e-04 | 7.21e-03 | 19 |
| GO:0014020 | Colorectum | AD | primary neural tube formation | 33/3918 | 94/18723 | 1.02e-03 | 9.50e-03 | 33 |
| GO:0061458 | Colorectum | AD | reproductive system development | 116/3918 | 427/18723 | 1.11e-03 | 1.01e-02 | 116 |
| GO:0001841 | Colorectum | AD | neural tube formation | 35/3918 | 102/18723 | 1.16e-03 | 1.05e-02 | 35 |
| GO:0060670 | Colorectum | AD | branching involved in labyrinthine layer morphogenesis | 8/3918 | 13/18723 | 1.70e-03 | 1.41e-02 | 8 |
| GO:0048608 | Colorectum | AD | reproductive structure development | 114/3918 | 424/18723 | 1.78e-03 | 1.47e-02 | 114 |
| GO:0001843 | Colorectum | AD | neural tube closure | 30/3918 | 88/18723 | 2.83e-03 | 2.12e-02 | 30 |
| GO:0060606 | Colorectum | AD | tube closure | 30/3918 | 89/18723 | 3.42e-03 | 2.49e-02 | 30 |
| GO:0060669 | Colorectum | AD | embryonic placenta morphogenesis | 12/3918 | 26/18723 | 3.47e-03 | 2.51e-02 | 12 |
| GO:0035148 | Colorectum | AD | tube formation | 45/3918 | 148/18723 | 4.13e-03 | 2.87e-02 | 45 |
| GO:0001838 | Colorectum | AD | embryonic epithelial tube formation | 38/3918 | 121/18723 | 4.40e-03 | 3.01e-02 | 38 |
| GO:0048568 | Colorectum | AD | embryonic organ development | 112/3918 | 427/18723 | 4.60e-03 | 3.14e-02 | 112 |
| GO:0009913 | Colorectum | AD | epidermal cell differentiation | 58/3918 | 202/18723 | 5.16e-03 | 3.42e-02 | 58 |
| GO:0008544 | Colorectum | AD | epidermis development | 87/3918 | 324/18723 | 5.99e-03 | 3.76e-02 | 87 |
| GO:0001763 | Colorectum | AD | morphogenesis of a branching structure | 56/3918 | 196/18723 | 6.60e-03 | 4.09e-02 | 56 |
| Page: 1 2 3 4 5 6 7 8 9 10 11 12 13 14 15 16 17 18 19 20 21 22 |
| Pathway ID | Tissue | Disease Stage | Description | Gene Ratio | Bg Ratio | pvalue | p.adjust | qvalue | Count |
| Page: 1 |
Top |
Cell-cell communication analysis |
| Identification of potential cell-cell interactions between two cell types and their ligand-receptor pairs for different disease states |
| Ligand | Receptor | LRpair | Pathway | Tissue | Disease Stage |
| Page: 1 |
Top |
Single-cell gene regulatory network inference analysis |
| Find out the significant the regulons (TFs) and the target genes of each regulon across cell types for different disease states |
| TF | Cell Type | Tissue | Disease Stage | Target Gene | RSS | Regulon Activity |
| ∗The dot plots of a searched regulon are shown for all cell subpopulations in each disease state of each tissue based on the regulon specific score inferred using pySCENIC and by calculating the average expression. |
| Page: 1 |
Top |
Somatic mutation of malignant transformation related genes |
| Annotation of somatic variants for genes involved in malignant transformation |
| Hugo Symbol | Variant Class | Variant Classification | dbSNP RS | HGVSc | HGVSp | HGVSp Short | SWISSPROT | BIOTYPE | SIFT | PolyPhen | Tumor Sample Barcode | Tissue | Histology | Sex | Age | Stage | Therapy Types | Drugs | Outcome |
| ST14 | SNV | Missense_Mutation | c.2086N>T | p.Arg696Cys | p.R696C | Q9Y5Y6 | protein_coding | deleterious(0) | probably_damaging(0.973) | TCGA-BH-A0B8-01 | Breast | breast invasive carcinoma | Female | <65 | I/II | Hormone Therapy | arimidex | SD | |
| ST14 | SNV | Missense_Mutation | c.2174N>T | p.Ser725Phe | p.S725F | Q9Y5Y6 | protein_coding | deleterious(0.01) | possibly_damaging(0.575) | TCGA-D8-A1JA-01 | Breast | breast invasive carcinoma | Female | <65 | III/IV | Chemotherapy | adriamycin | PD | |
| ST14 | SNV | Missense_Mutation | rs749681872 | c.113N>C | p.Phe38Ser | p.F38S | Q9Y5Y6 | protein_coding | deleterious(0) | probably_damaging(0.992) | TCGA-E2-A156-01 | Breast | breast invasive carcinoma | Female | <65 | I/II | Hormone Therapy | arimidex | SD |
| ST14 | SNV | Missense_Mutation | c.1560N>C | p.Glu520Asp | p.E520D | Q9Y5Y6 | protein_coding | deleterious(0.02) | probably_damaging(1) | TCGA-E2-A1LI-01 | Breast | breast invasive carcinoma | Female | <65 | I/II | Chemotherapy | adriamycin | SD | |
| ST14 | SNV | Missense_Mutation | novel | c.1622N>T | p.Ser541Ile | p.S541I | Q9Y5Y6 | protein_coding | deleterious(0.04) | possibly_damaging(0.632) | TCGA-E9-A2JS-01 | Breast | breast invasive carcinoma | Female | >=65 | I/II | Chemotherapy | cyclophosphamide | PD |
| ST14 | SNV | Missense_Mutation | c.923N>G | p.Ser308Cys | p.S308C | Q9Y5Y6 | protein_coding | deleterious(0) | probably_damaging(0.992) | TCGA-GM-A2DH-01 | Breast | breast invasive carcinoma | Female | <65 | I/II | Chemotherapy | taxol | CR | |
| ST14 | SNV | Missense_Mutation | novel | c.1053N>A | p.Phe351Leu | p.F351L | Q9Y5Y6 | protein_coding | tolerated(0.08) | benign(0.02) | TCGA-C5-A2LZ-01 | Cervix | cervical & endocervical cancer | Female | >=65 | III/IV | Unknown | Unknown | PD |
| ST14 | SNV | Missense_Mutation | novel | c.2360G>A | p.Arg787His | p.R787H | Q9Y5Y6 | protein_coding | deleterious(0.03) | possibly_damaging(0.572) | TCGA-VS-A94Z-01 | Cervix | cervical & endocervical cancer | Female | <65 | I/II | Chemotherapy | cisplatin | CR |
| ST14 | SNV | Missense_Mutation | c.1631N>A | p.Cys544Tyr | p.C544Y | Q9Y5Y6 | protein_coding | deleterious(0) | probably_damaging(1) | TCGA-AA-3672-01 | Colorectum | colon adenocarcinoma | Female | >=65 | III/IV | Unknown | Unknown | SD | |
| ST14 | SNV | Missense_Mutation | novel | c.1193C>T | p.Pro398Leu | p.P398L | Q9Y5Y6 | protein_coding | tolerated(0.74) | benign(0.029) | TCGA-AA-3949-01 | Colorectum | colon adenocarcinoma | Female | >=65 | III/IV | Unknown | Unknown | SD |
| Page: 1 2 3 4 5 6 7 |
Top |
Related drugs of malignant transformation related genes |
| Identification of chemicals and drugs interact with genes involved in malignant transfromation |
| (DGIdb 4.0) |
| Entrez ID | Symbol | Category | Interaction Types | Drug Claim Name | Drug Name | PMIDs |
| 6768 | ST14 | ENZYME, DRUGGABLE GENOME, PROTEASE | US8569313, Inhibitor 14 | |||
| 6768 | ST14 | ENZYME, DRUGGABLE GENOME, PROTEASE | inhibitor | 252166696 | ||
| 6768 | ST14 | ENZYME, DRUGGABLE GENOME, PROTEASE | US8569313, Inhibitor 19 | |||
| 6768 | ST14 | ENZYME, DRUGGABLE GENOME, PROTEASE | US8569313, Inhibitor 18 | |||
| 6768 | ST14 | ENZYME, DRUGGABLE GENOME, PROTEASE | SURAMIN | SURAMIN | 15590895 | |
| 6768 | ST14 | ENZYME, DRUGGABLE GENOME, PROTEASE | inhibitor | 405067326 | ||
| 6768 | ST14 | ENZYME, DRUGGABLE GENOME, PROTEASE | PROTEASE INHIBITOR | 10373425 | ||
| 6768 | ST14 | ENZYME, DRUGGABLE GENOME, PROTEASE | inhibitor | 252166825 | ||
| 6768 | ST14 | ENZYME, DRUGGABLE GENOME, PROTEASE | US8569313, Inhibitor 15 | |||
| 6768 | ST14 | ENZYME, DRUGGABLE GENOME, PROTEASE | inhibitor | 252166691 |
| Page: 1 |

Copyright 2023-Present -The University of Texas Health Science Center at Houston |