
|
|||||
|
 | |
| |
| |
| |
| |
| |
|
Gene: SSX2IP |
Gene summary for SSX2IP |
| Gene information | Species | Human | Gene symbol | SSX2IP | Gene ID | 117178 |
| Gene name | SSX family member 2 interacting protein | |
| Gene Alias | ADIP | |
| Cytomap | 1p22.3 | |
| Gene Type | protein-coding | GO ID | GO:0000226 | UniProtAcc | Q9Y2D8 |
Top |
Malignant transformation analysis |
| Identification of the aberrant gene expression in precancerous and cancerous lesions by comparing the gene expression of stem-like cells in diseased tissues with normal stem cells |
| Entrez ID | Symbol | Replicates | Species | Organ | Tissue | Adj P-value | Log2FC | Malignancy |
| 117178 | SSX2IP | HCC1_Meng | Human | Liver | HCC | 1.20e-26 | -3.65e-02 | 0.0246 |
| 117178 | SSX2IP | HCC2_Meng | Human | Liver | HCC | 1.87e-05 | -5.61e-03 | 0.0107 |
| 117178 | SSX2IP | HCC2 | Human | Liver | HCC | 1.13e-27 | 4.84e+00 | 0.5341 |
| 117178 | SSX2IP | S027 | Human | Liver | HCC | 5.25e-03 | 5.25e-01 | 0.2446 |
| 117178 | SSX2IP | S028 | Human | Liver | HCC | 1.11e-10 | 5.63e-01 | 0.2503 |
| 117178 | SSX2IP | S029 | Human | Liver | HCC | 2.90e-07 | 5.80e-01 | 0.2581 |
| 117178 | SSX2IP | P4_S8_cSCC | Human | Skin | cSCC | 5.24e-05 | 1.55e-01 | -0.3095 |
| 117178 | SSX2IP | P5_S10_cSCC | Human | Skin | cSCC | 2.34e-05 | 1.50e-01 | -0.299 |
| 117178 | SSX2IP | P1_cSCC | Human | Skin | cSCC | 2.03e-09 | 4.13e-01 | 0.0292 |
| 117178 | SSX2IP | P2_cSCC | Human | Skin | cSCC | 7.41e-06 | 2.39e-01 | -0.024 |
| 117178 | SSX2IP | P4_cSCC | Human | Skin | cSCC | 1.97e-21 | 5.31e-01 | -0.00290000000000005 |
| 117178 | SSX2IP | P10_cSCC | Human | Skin | cSCC | 2.79e-17 | 4.97e-01 | 0.1017 |
| Page: 1 |
| Tissue | Expression Dynamics | Abbreviation |
| Liver | 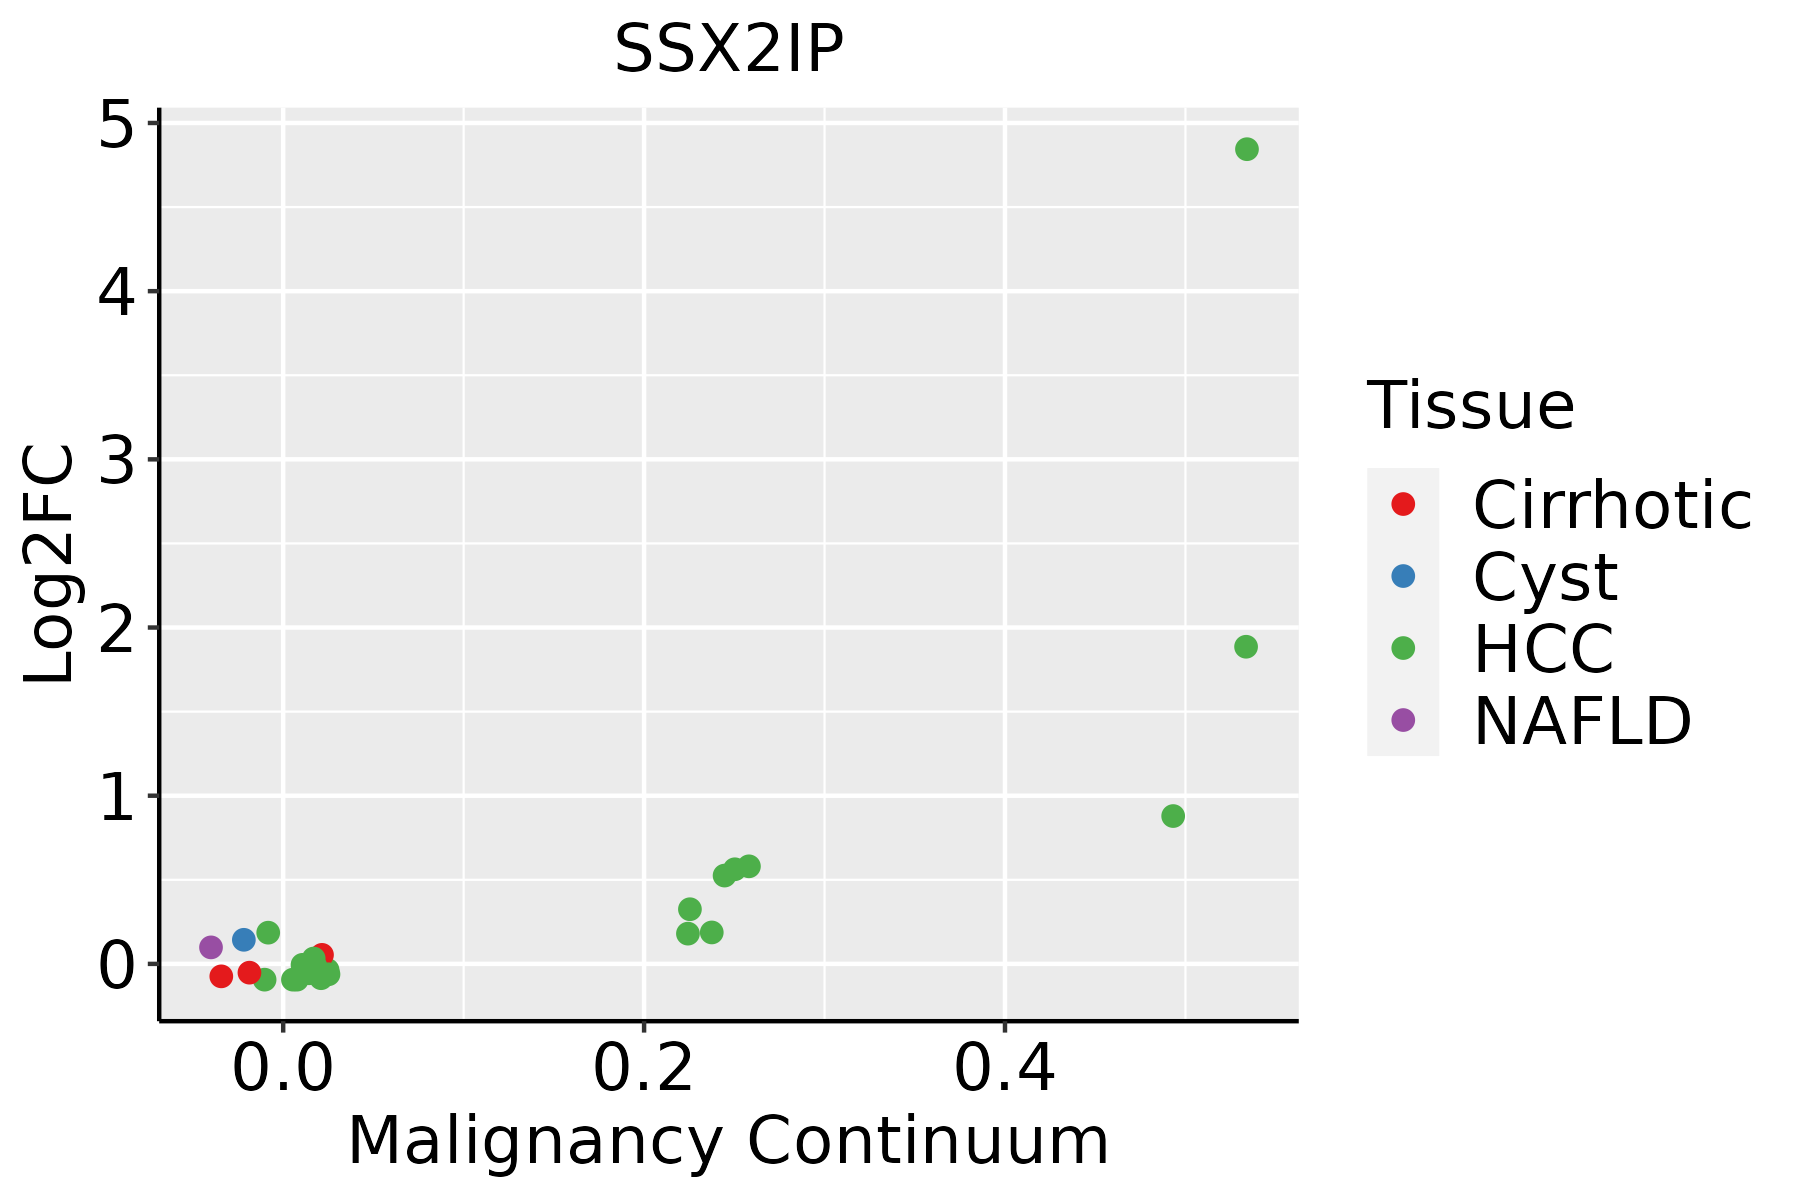 | HCC: Hepatocellular carcinoma |
| NAFLD: Non-alcoholic fatty liver disease | ||
| Skin | 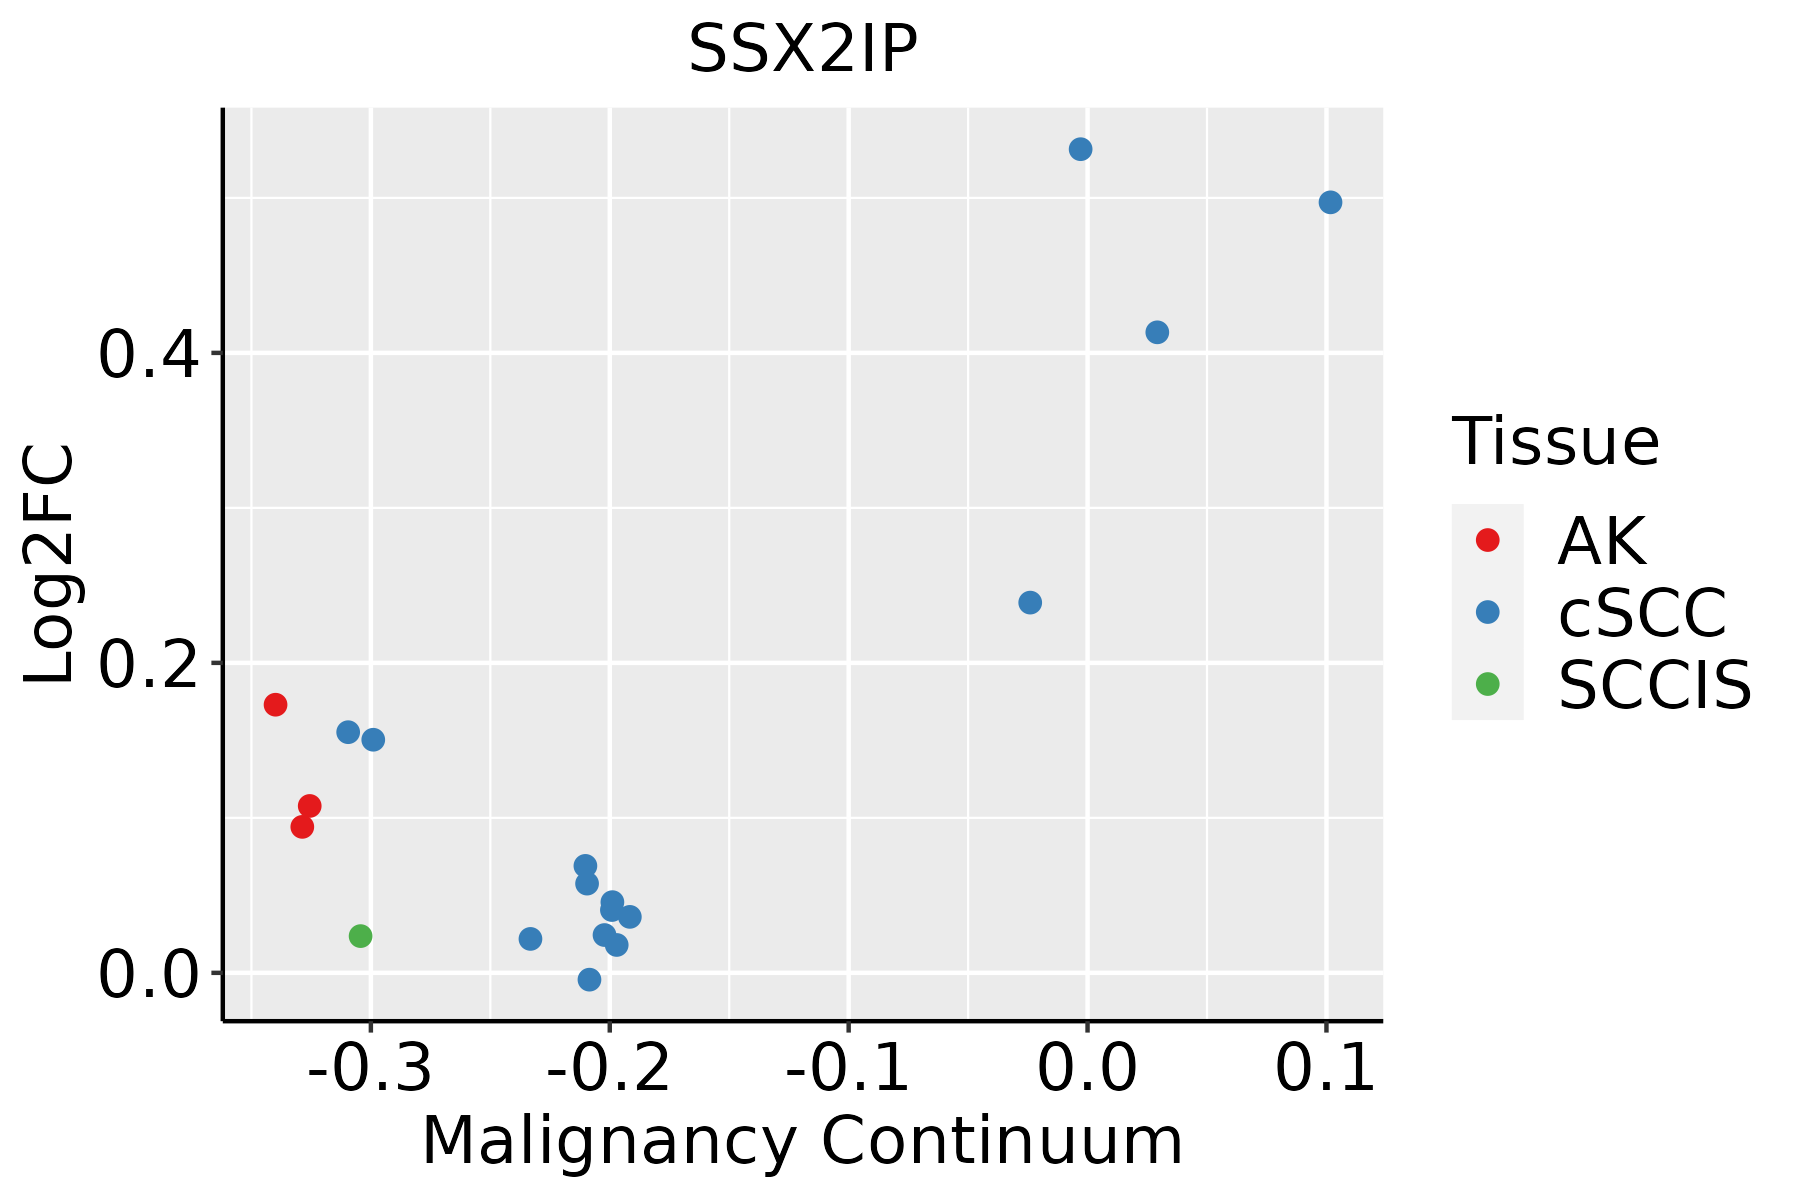 | AK: Actinic keratosis |
| cSCC: Cutaneous squamous cell carcinoma | ||
| SCCIS:squamous cell carcinoma in situ |
| ∗log2FC in expression of this searched gene in stem-like cells from each diseased tissue sample relative to stem-like cells in normal samples in each tissue plotted against the malignancy continuum. Samples are colored based on if they are from different disease stage. |
Top |
Malignant transformation related pathway analysis |
| Find out the enriched GO biological processes and KEGG pathways involved in transition from healthy to precancer to cancer |
| Tissue | Disease Stage | Enriched GO biological Processes |
| Colorectum | AD |  |
| Colorectum | SER |  |
| Colorectum | MSS |  |
| Colorectum | MSI-H |  |
| Colorectum | FAP |  |
| ∗Top 15 enriched GO BP terms are showed in the bar plot of each disease state in each tissue. Each row represents a significant GO biological process which is colored according to the -log10(p.adjust). |
| Page: 1 2 3 4 5 6 7 8 9 |
| GO ID | Tissue | Disease Stage | Description | Gene Ratio | Bg Ratio | pvalue | p.adjust | Count |
| GO:000726521 | Liver | HCC | Ras protein signal transduction | 187/7958 | 337/18723 | 8.89e-07 | 1.35e-05 | 187 |
| GO:00315031 | Liver | HCC | protein-containing complex localization | 129/7958 | 220/18723 | 9.38e-07 | 1.42e-05 | 129 |
| GO:003070521 | Liver | HCC | cytoskeleton-dependent intracellular transport | 111/7958 | 195/18723 | 3.25e-05 | 3.28e-04 | 111 |
| GO:00109702 | Liver | HCC | transport along microtubule | 90/7958 | 155/18723 | 6.49e-05 | 5.92e-04 | 90 |
| GO:0031023 | Liver | HCC | microtubule organizing center organization | 82/7958 | 143/18723 | 2.38e-04 | 1.79e-03 | 82 |
| GO:0007098 | Liver | HCC | centrosome cycle | 75/7958 | 130/18723 | 3.33e-04 | 2.34e-03 | 75 |
| GO:001660121 | Liver | HCC | Rac protein signal transduction | 28/7958 | 42/18723 | 1.35e-03 | 7.26e-03 | 28 |
| GO:004657811 | Liver | HCC | regulation of Ras protein signal transduction | 100/7958 | 189/18723 | 2.42e-03 | 1.18e-02 | 100 |
| GO:003150315 | Skin | cSCC | protein-containing complex localization | 95/4864 | 220/18723 | 2.00e-08 | 5.82e-07 | 95 |
| GO:000726523 | Skin | cSCC | Ras protein signal transduction | 132/4864 | 337/18723 | 6.17e-08 | 1.57e-06 | 132 |
| GO:003070524 | Skin | cSCC | cytoskeleton-dependent intracellular transport | 77/4864 | 195/18723 | 2.32e-05 | 2.67e-04 | 77 |
| GO:00310234 | Skin | cSCC | microtubule organizing center organization | 58/4864 | 143/18723 | 9.47e-05 | 8.83e-04 | 58 |
| GO:00070983 | Skin | cSCC | centrosome cycle | 53/4864 | 130/18723 | 1.59e-04 | 1.39e-03 | 53 |
| GO:001097014 | Skin | cSCC | transport along microtubule | 58/4864 | 155/18723 | 1.09e-03 | 7.24e-03 | 58 |
| GO:001660110 | Skin | cSCC | Rac protein signal transduction | 19/4864 | 42/18723 | 5.36e-03 | 2.70e-02 | 19 |
| Page: 1 |
| Pathway ID | Tissue | Disease Stage | Description | Gene Ratio | Bg Ratio | pvalue | p.adjust | qvalue | Count |
| hsa0452042 | Liver | HCC | Adherens junction | 68/4020 | 93/8465 | 3.99e-07 | 4.46e-06 | 2.48e-06 | 68 |
| hsa0452052 | Liver | HCC | Adherens junction | 68/4020 | 93/8465 | 3.99e-07 | 4.46e-06 | 2.48e-06 | 68 |
| Page: 1 |
Top |
Cell-cell communication analysis |
| Identification of potential cell-cell interactions between two cell types and their ligand-receptor pairs for different disease states |
| Ligand | Receptor | LRpair | Pathway | Tissue | Disease Stage |
| Page: 1 |
Top |
Single-cell gene regulatory network inference analysis |
| Find out the significant the regulons (TFs) and the target genes of each regulon across cell types for different disease states |
| TF | Cell Type | Tissue | Disease Stage | Target Gene | RSS | Regulon Activity |
| ∗The dot plots of a searched regulon are shown for all cell subpopulations in each disease state of each tissue based on the regulon specific score inferred using pySCENIC and by calculating the average expression. |
| Page: 1 |
Top |
Somatic mutation of malignant transformation related genes |
| Annotation of somatic variants for genes involved in malignant transformation |
| Hugo Symbol | Variant Class | Variant Classification | dbSNP RS | HGVSc | HGVSp | HGVSp Short | SWISSPROT | BIOTYPE | SIFT | PolyPhen | Tumor Sample Barcode | Tissue | Histology | Sex | Age | Stage | Therapy Types | Drugs | Outcome |
| SSX2IP | SNV | Missense_Mutation | c.1332G>T | p.Lys444Asn | p.K444N | Q9Y2D8 | protein_coding | tolerated(0.07) | benign(0.114) | TCGA-AN-A046-01 | Breast | breast invasive carcinoma | Female | >=65 | I/II | Unknown | Unknown | SD | |
| SSX2IP | SNV | Missense_Mutation | c.375G>T | p.Leu125Phe | p.L125F | Q9Y2D8 | protein_coding | deleterious(0.05) | probably_damaging(0.98) | TCGA-C8-A131-01 | Breast | breast invasive carcinoma | Female | >=65 | III/IV | Chemotherapy | 5-fluorouracil | CR | |
| SSX2IP | SNV | Missense_Mutation | c.273G>C | p.Lys91Asn | p.K91N | Q9Y2D8 | protein_coding | tolerated(0.45) | benign(0.09) | TCGA-C8-A26Y-01 | Breast | breast invasive carcinoma | Female | >=65 | I/II | Unknown | Unknown | SD | |
| SSX2IP | insertion | Frame_Shift_Ins | novel | c.784_785insGAGTCCAGTGGCACCATCTCACCTCACTGCAATCT | p.Asp262GlyfsTer22 | p.D262Gfs*22 | Q9Y2D8 | protein_coding | TCGA-A8-A06P-01 | Breast | breast invasive carcinoma | Female | <65 | III/IV | Unspecific | SD | |||
| SSX2IP | insertion | Nonsense_Mutation | novel | c.478_479insATATTTAA | p.Arg160AsnfsTer3 | p.R160Nfs*3 | Q9Y2D8 | protein_coding | TCGA-AR-A0U2-01 | Breast | breast invasive carcinoma | Female | <65 | III/IV | Hormone Therapy | tamoxiphen | PD | ||
| SSX2IP | SNV | Missense_Mutation | c.1188N>A | p.Met396Ile | p.M396I | Q9Y2D8 | protein_coding | tolerated(0.4) | benign(0.018) | TCGA-C5-A1BQ-01 | Cervix | cervical & endocervical cancer | Female | >=65 | III/IV | Chemotherapy | cisplatin | CR | |
| SSX2IP | SNV | Missense_Mutation | novel | c.328N>A | p.Gln110Lys | p.Q110K | Q9Y2D8 | protein_coding | deleterious(0.03) | benign(0.331) | TCGA-EK-A2RE-01 | Cervix | cervical & endocervical cancer | Female | <65 | I/II | Unknown | Unknown | SD |
| SSX2IP | SNV | Missense_Mutation | novel | c.1124N>T | p.Ser375Leu | p.S375L | Q9Y2D8 | protein_coding | tolerated(0.06) | benign(0.076) | TCGA-VS-A94W-01 | Cervix | cervical & endocervical cancer | Female | <65 | I/II | Chemotherapy | cisplatin | CR |
| SSX2IP | SNV | Missense_Mutation | c.1246N>G | p.Thr416Ala | p.T416A | Q9Y2D8 | protein_coding | tolerated(0.16) | benign(0.03) | TCGA-AA-3492-01 | Colorectum | colon adenocarcinoma | Female | >=65 | I/II | Unknown | Unknown | SD | |
| SSX2IP | SNV | Missense_Mutation | c.814N>T | p.Met272Leu | p.M272L | Q9Y2D8 | protein_coding | tolerated(1) | benign(0) | TCGA-AA-3811-01 | Colorectum | colon adenocarcinoma | Female | >=65 | III/IV | Unknown | Unknown | PD |
| Page: 1 2 3 4 5 6 7 |
Top |
Related drugs of malignant transformation related genes |
| Identification of chemicals and drugs interact with genes involved in malignant transfromation |
| (DGIdb 4.0) |
| Entrez ID | Symbol | Category | Interaction Types | Drug Claim Name | Drug Name | PMIDs |
| Page: 1 |

Copyright 2023-Present -The University of Texas Health Science Center at Houston |