
|
|||||
|
 | |
| |
| |
| |
| |
| |
|
Gene: SSU72 |
Gene summary for SSU72 |
| Gene information | Species | Human | Gene symbol | SSU72 | Gene ID | 29101 |
| Gene name | SSU72 homolog, RNA polymerase II CTD phosphatase | |
| Gene Alias | HSPC182 | |
| Cytomap | 1p36.33 | |
| Gene Type | protein-coding | GO ID | GO:0006139 | UniProtAcc | Q9NP77 |
Top |
Malignant transformation analysis |
| Identification of the aberrant gene expression in precancerous and cancerous lesions by comparing the gene expression of stem-like cells in diseased tissues with normal stem cells |
| Entrez ID | Symbol | Replicates | Species | Organ | Tissue | Adj P-value | Log2FC | Malignancy |
| 29101 | SSU72 | HTA11_3410_2000001011 | Human | Colorectum | AD | 7.18e-04 | 1.92e-01 | 0.0155 |
| 29101 | SSU72 | HTA11_2487_2000001011 | Human | Colorectum | SER | 1.08e-06 | 4.06e-01 | -0.1808 |
| 29101 | SSU72 | HTA11_1938_2000001011 | Human | Colorectum | AD | 1.46e-14 | 6.43e-01 | -0.0811 |
| 29101 | SSU72 | HTA11_78_2000001011 | Human | Colorectum | AD | 5.26e-04 | 4.19e-01 | -0.1088 |
| 29101 | SSU72 | HTA11_347_2000001011 | Human | Colorectum | AD | 4.25e-20 | 5.82e-01 | -0.1954 |
| 29101 | SSU72 | HTA11_411_2000001011 | Human | Colorectum | SER | 7.46e-05 | 7.64e-01 | -0.2602 |
| 29101 | SSU72 | HTA11_2112_2000001011 | Human | Colorectum | SER | 2.11e-02 | 5.18e-01 | -0.2196 |
| 29101 | SSU72 | HTA11_3361_2000001011 | Human | Colorectum | AD | 3.56e-04 | 4.83e-01 | -0.1207 |
| 29101 | SSU72 | HTA11_83_2000001011 | Human | Colorectum | SER | 3.06e-04 | 5.07e-01 | -0.1526 |
| 29101 | SSU72 | HTA11_696_2000001011 | Human | Colorectum | AD | 6.59e-19 | 5.75e-01 | -0.1464 |
| 29101 | SSU72 | HTA11_866_2000001011 | Human | Colorectum | AD | 3.66e-06 | 3.19e-01 | -0.1001 |
| 29101 | SSU72 | HTA11_1391_2000001011 | Human | Colorectum | AD | 1.33e-16 | 7.26e-01 | -0.059 |
| 29101 | SSU72 | HTA11_2992_2000001011 | Human | Colorectum | SER | 6.69e-03 | 5.94e-01 | -0.1706 |
| 29101 | SSU72 | HTA11_5212_2000001011 | Human | Colorectum | AD | 3.39e-05 | 5.74e-01 | -0.2061 |
| 29101 | SSU72 | HTA11_5216_2000001011 | Human | Colorectum | SER | 4.55e-07 | 6.86e-01 | -0.1462 |
| 29101 | SSU72 | HTA11_546_2000001011 | Human | Colorectum | AD | 2.05e-04 | 3.66e-01 | -0.0842 |
| 29101 | SSU72 | HTA11_866_3004761011 | Human | Colorectum | AD | 8.84e-10 | 3.83e-01 | 0.096 |
| 29101 | SSU72 | HTA11_7696_3000711011 | Human | Colorectum | AD | 2.62e-02 | 2.50e-01 | 0.0674 |
| 29101 | SSU72 | HTA11_7469_2000001011 | Human | Colorectum | AD | 1.74e-03 | 6.11e-01 | -0.0124 |
| 29101 | SSU72 | HTA11_99999970781_79442 | Human | Colorectum | MSS | 7.40e-06 | 3.72e-01 | 0.294 |
| Page: 1 2 3 4 5 6 7 8 9 |
| Tissue | Expression Dynamics | Abbreviation |
| Colorectum (GSE201348) |  | FAP: Familial adenomatous polyposis |
| CRC: Colorectal cancer | ||
| Colorectum (HTA11) | 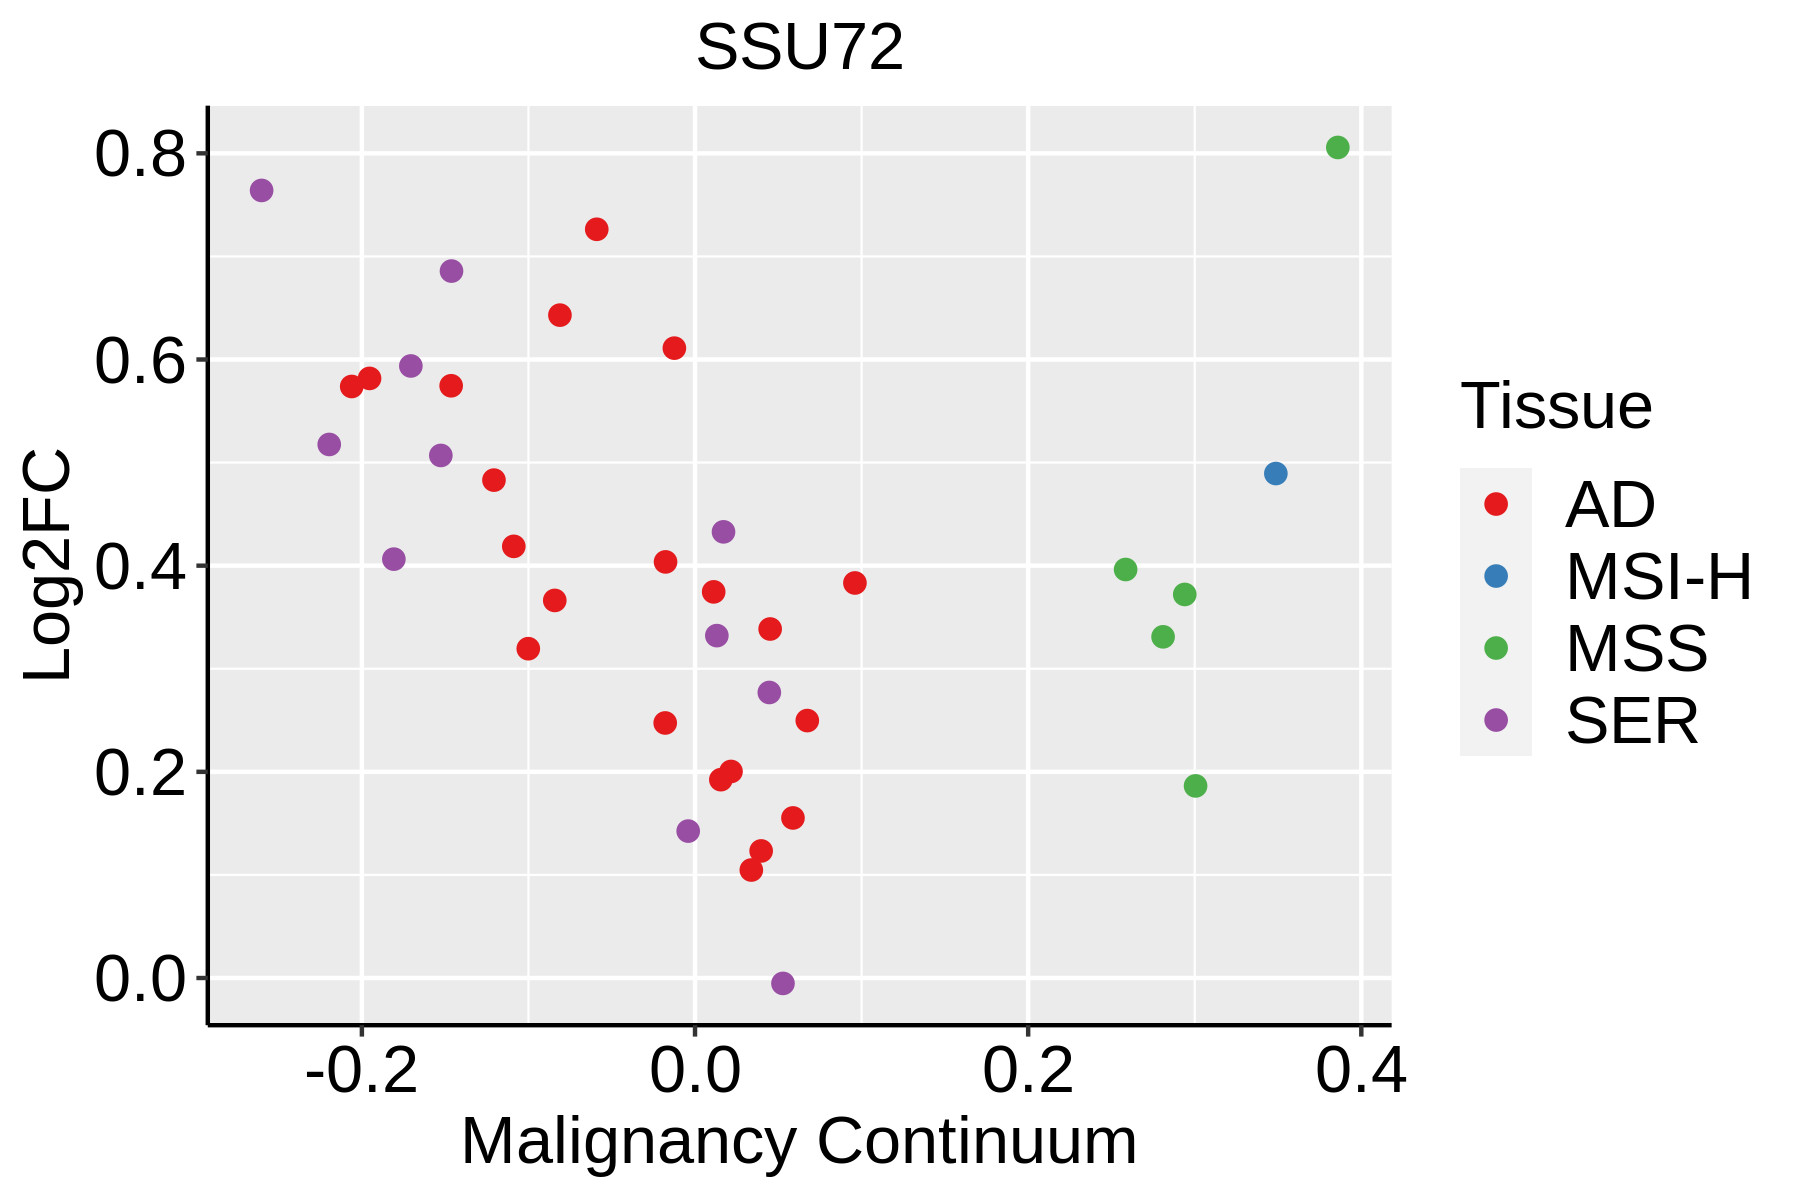 | AD: Adenomas |
| SER: Sessile serrated lesions | ||
| MSI-H: Microsatellite-high colorectal cancer | ||
| MSS: Microsatellite stable colorectal cancer | ||
| Esophagus |  | ESCC: Esophageal squamous cell carcinoma |
| HGIN: High-grade intraepithelial neoplasias | ||
| LGIN: Low-grade intraepithelial neoplasias | ||
| Liver | 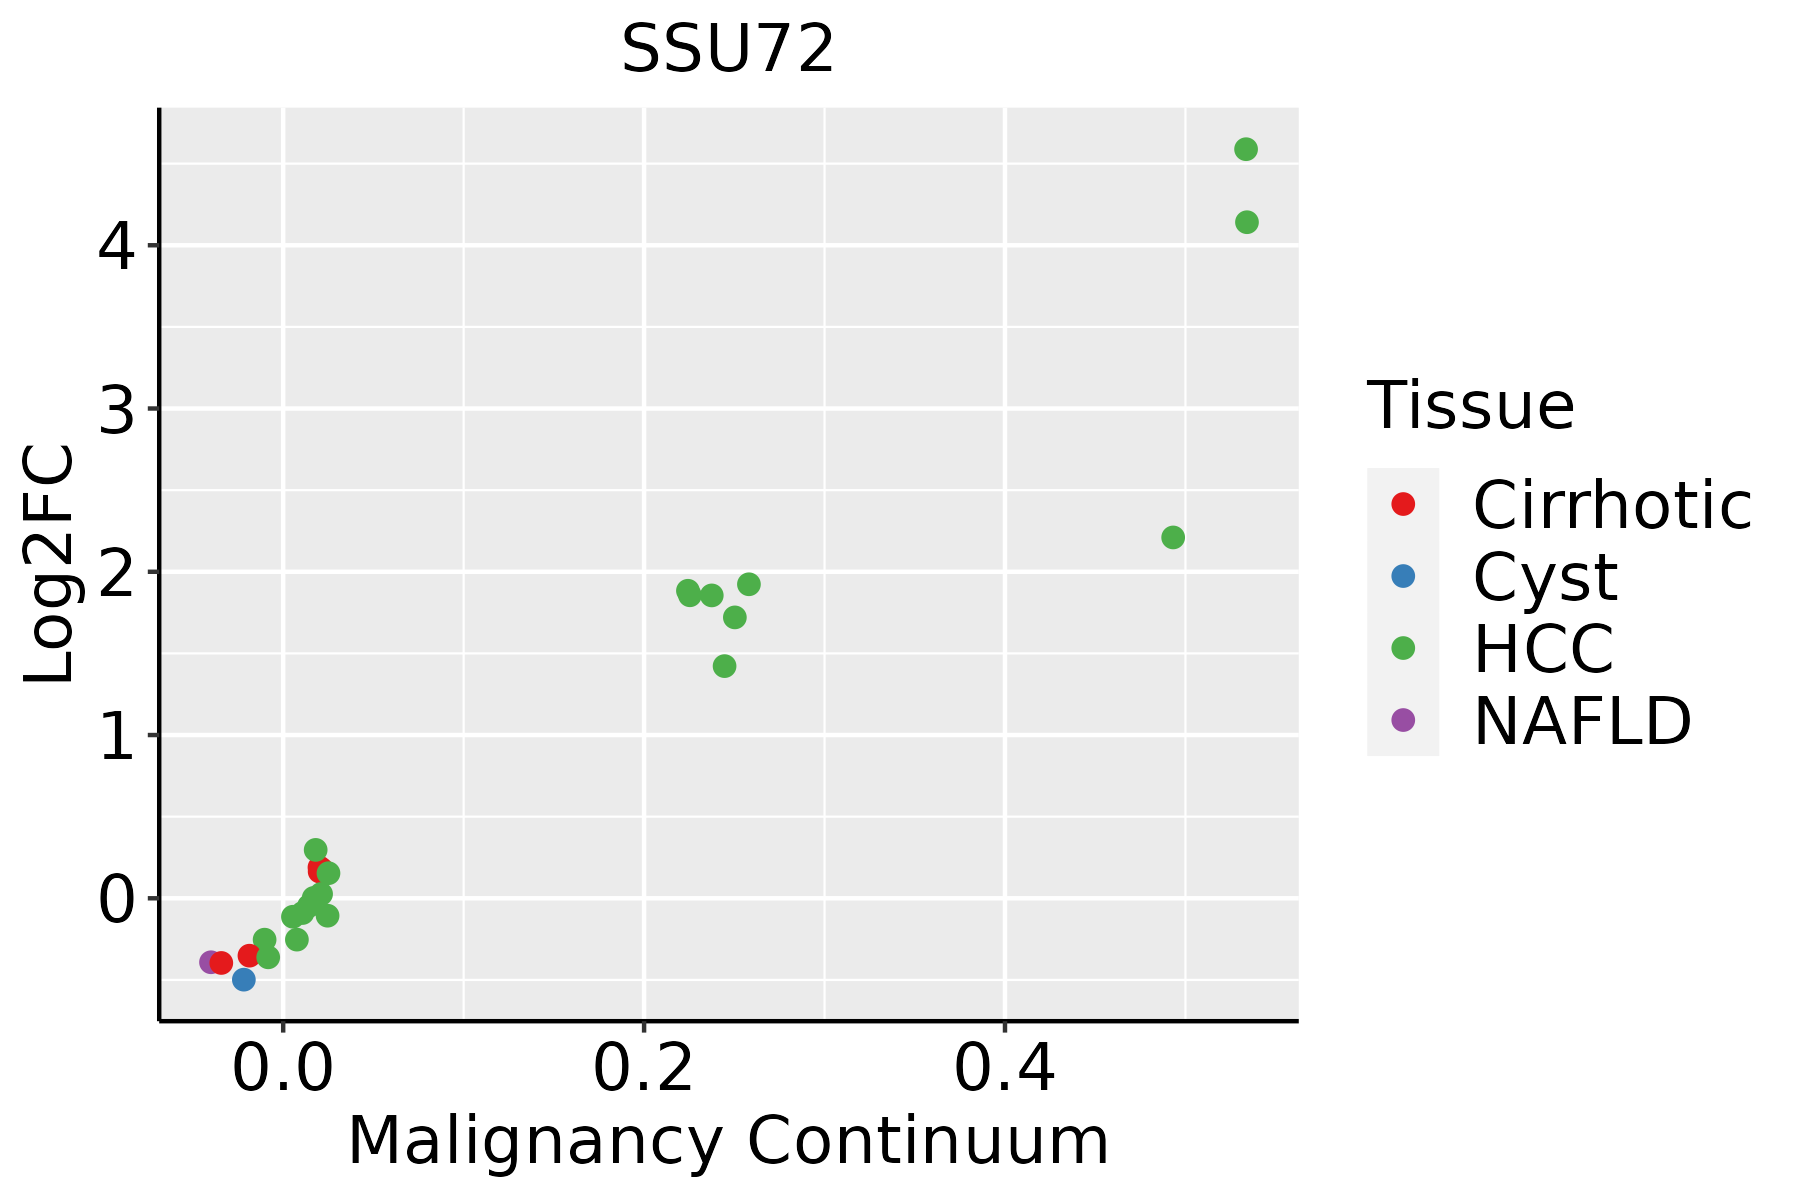 | HCC: Hepatocellular carcinoma |
| NAFLD: Non-alcoholic fatty liver disease | ||
| Oral Cavity |  | EOLP: Erosive Oral lichen planus |
| LP: leukoplakia | ||
| NEOLP: Non-erosive oral lichen planus | ||
| OSCC: Oral squamous cell carcinoma | ||
| Prostate |  | BPH: Benign Prostatic Hyperplasia |
| Skin | 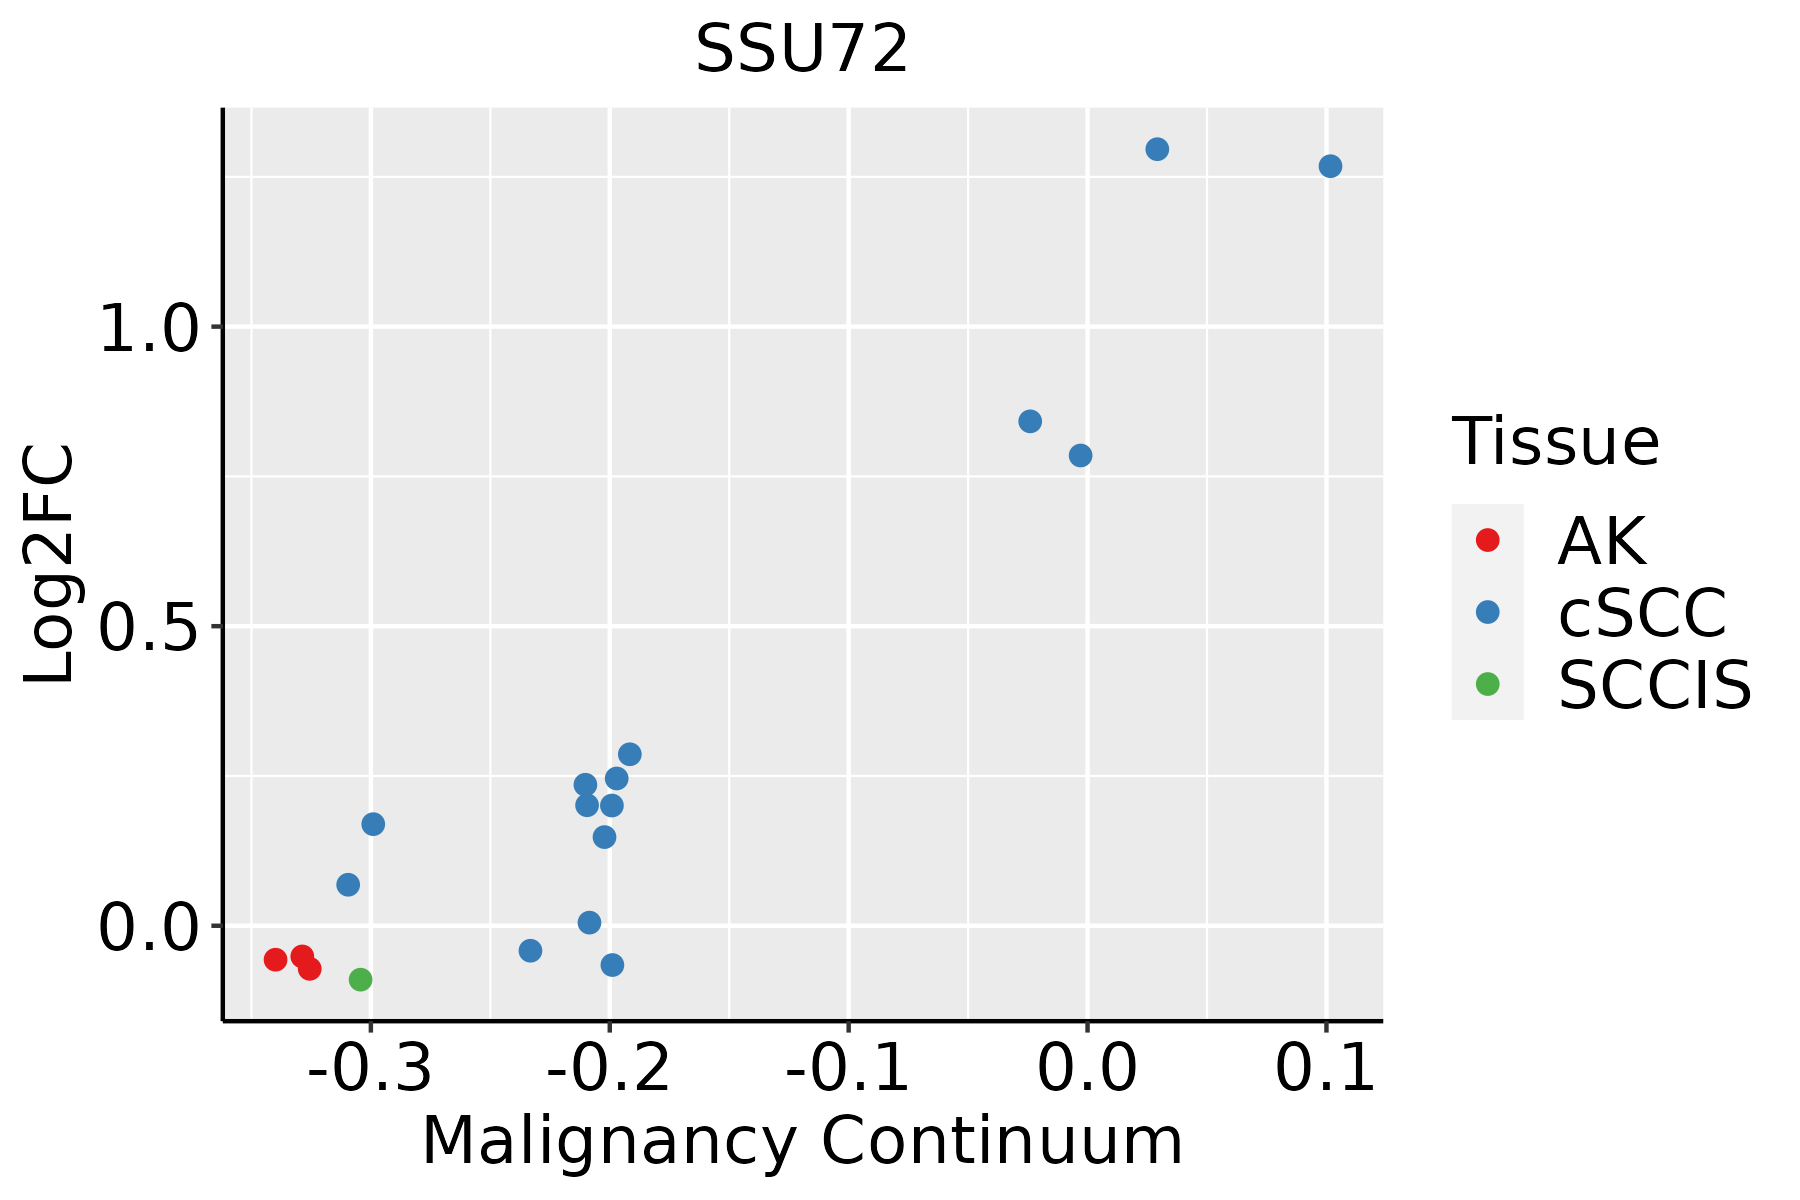 | AK: Actinic keratosis |
| cSCC: Cutaneous squamous cell carcinoma | ||
| SCCIS:squamous cell carcinoma in situ | ||
| Thyroid |  | ATC: Anaplastic thyroid cancer |
| HT: Hashimoto's thyroiditis | ||
| PTC: Papillary thyroid cancer |
| ∗log2FC in expression of this searched gene in stem-like cells from each diseased tissue sample relative to stem-like cells in normal samples in each tissue plotted against the malignancy continuum. Samples are colored based on if they are from different disease stage. |
Top |
Malignant transformation related pathway analysis |
| Find out the enriched GO biological processes and KEGG pathways involved in transition from healthy to precancer to cancer |
| Tissue | Disease Stage | Enriched GO biological Processes |
| Colorectum | AD |  |
| Colorectum | SER |  |
| Colorectum | MSS |  |
| Colorectum | MSI-H |  |
| Colorectum | FAP |  |
| ∗Top 15 enriched GO BP terms are showed in the bar plot of each disease state in each tissue. Each row represents a significant GO biological process which is colored according to the -log10(p.adjust). |
| Page: 1 2 3 4 5 6 7 8 9 |
| GO ID | Tissue | Disease Stage | Description | Gene Ratio | Bg Ratio | pvalue | p.adjust | Count |
| GO:0016311 | Colorectum | AD | dephosphorylation | 123/3918 | 417/18723 | 1.84e-05 | 3.82e-04 | 123 |
| GO:0006470 | Colorectum | AD | protein dephosphorylation | 88/3918 | 281/18723 | 2.56e-05 | 4.89e-04 | 88 |
| GO:00064701 | Colorectum | SER | protein dephosphorylation | 65/2897 | 281/18723 | 4.44e-04 | 6.51e-03 | 65 |
| GO:00163111 | Colorectum | SER | dephosphorylation | 86/2897 | 417/18723 | 2.73e-03 | 2.46e-02 | 86 |
| GO:00064702 | Colorectum | MSS | protein dephosphorylation | 73/3467 | 281/18723 | 1.15e-03 | 1.12e-02 | 73 |
| GO:00163112 | Colorectum | MSS | dephosphorylation | 101/3467 | 417/18723 | 1.98e-03 | 1.70e-02 | 101 |
| GO:000647017 | Esophagus | HGIN | protein dephosphorylation | 61/2587 | 281/18723 | 1.86e-04 | 3.51e-03 | 61 |
| GO:00311243 | Esophagus | HGIN | mRNA 3'-end processing | 18/2587 | 62/18723 | 1.37e-03 | 1.61e-02 | 18 |
| GO:001631110 | Esophagus | ESCC | dephosphorylation | 251/8552 | 417/18723 | 1.26e-09 | 2.99e-08 | 251 |
| GO:000647018 | Esophagus | ESCC | protein dephosphorylation | 177/8552 | 281/18723 | 3.13e-09 | 6.72e-08 | 177 |
| GO:003112412 | Esophagus | ESCC | mRNA 3'-end processing | 47/8552 | 62/18723 | 1.29e-06 | 1.58e-05 | 47 |
| GO:00311233 | Esophagus | ESCC | RNA 3'-end processing | 76/8552 | 116/18723 | 1.25e-05 | 1.15e-04 | 76 |
| GO:00063783 | Esophagus | ESCC | mRNA polyadenylation | 33/8552 | 44/18723 | 7.30e-05 | 5.49e-04 | 33 |
| GO:00436313 | Esophagus | ESCC | RNA polyadenylation | 33/8552 | 45/18723 | 1.54e-04 | 1.02e-03 | 33 |
| GO:00063532 | Esophagus | ESCC | DNA-templated transcription, termination | 15/8552 | 21/18723 | 1.54e-02 | 4.96e-02 | 15 |
| GO:000647011 | Liver | Cirrhotic | protein dephosphorylation | 96/4634 | 281/18723 | 2.32e-04 | 2.11e-03 | 96 |
| GO:001631111 | Liver | Cirrhotic | dephosphorylation | 130/4634 | 417/18723 | 1.58e-03 | 1.03e-02 | 130 |
| GO:0031123 | Liver | Cirrhotic | RNA 3'-end processing | 42/4634 | 116/18723 | 3.85e-03 | 2.10e-02 | 42 |
| GO:0031124 | Liver | Cirrhotic | mRNA 3'-end processing | 25/4634 | 62/18723 | 4.90e-03 | 2.56e-02 | 25 |
| GO:00311241 | Liver | HCC | mRNA 3'-end processing | 50/7958 | 62/18723 | 8.44e-10 | 2.60e-08 | 50 |
| Page: 1 2 3 4 |
| Pathway ID | Tissue | Disease Stage | Description | Gene Ratio | Bg Ratio | pvalue | p.adjust | qvalue | Count |
| hsa03015 | Colorectum | AD | mRNA surveillance pathway | 35/2092 | 97/8465 | 7.95e-03 | 3.13e-02 | 2.00e-02 | 35 |
| hsa030151 | Colorectum | AD | mRNA surveillance pathway | 35/2092 | 97/8465 | 7.95e-03 | 3.13e-02 | 2.00e-02 | 35 |
| hsa030159 | Esophagus | HGIN | mRNA surveillance pathway | 30/1383 | 97/8465 | 2.48e-04 | 2.69e-03 | 2.14e-03 | 30 |
| hsa0301514 | Esophagus | HGIN | mRNA surveillance pathway | 30/1383 | 97/8465 | 2.48e-04 | 2.69e-03 | 2.14e-03 | 30 |
| hsa0301524 | Esophagus | ESCC | mRNA surveillance pathway | 72/4205 | 97/8465 | 6.12e-07 | 4.10e-06 | 2.10e-06 | 72 |
| hsa0301534 | Esophagus | ESCC | mRNA surveillance pathway | 72/4205 | 97/8465 | 6.12e-07 | 4.10e-06 | 2.10e-06 | 72 |
| hsa030154 | Liver | Cirrhotic | mRNA surveillance pathway | 46/2530 | 97/8465 | 1.92e-04 | 1.30e-03 | 8.03e-04 | 46 |
| hsa0301511 | Liver | Cirrhotic | mRNA surveillance pathway | 46/2530 | 97/8465 | 1.92e-04 | 1.30e-03 | 8.03e-04 | 46 |
| hsa0301521 | Liver | HCC | mRNA surveillance pathway | 66/4020 | 97/8465 | 3.16e-05 | 1.88e-04 | 1.04e-04 | 66 |
| hsa0301531 | Liver | HCC | mRNA surveillance pathway | 66/4020 | 97/8465 | 3.16e-05 | 1.88e-04 | 1.04e-04 | 66 |
| hsa030158 | Oral cavity | OSCC | mRNA surveillance pathway | 75/3704 | 97/8465 | 1.30e-11 | 2.01e-10 | 1.02e-10 | 75 |
| hsa0301513 | Oral cavity | OSCC | mRNA surveillance pathway | 75/3704 | 97/8465 | 1.30e-11 | 2.01e-10 | 1.02e-10 | 75 |
| hsa0301523 | Oral cavity | LP | mRNA surveillance pathway | 50/2418 | 97/8465 | 1.39e-06 | 1.50e-05 | 9.66e-06 | 50 |
| hsa0301533 | Oral cavity | LP | mRNA surveillance pathway | 50/2418 | 97/8465 | 1.39e-06 | 1.50e-05 | 9.66e-06 | 50 |
| hsa030155 | Prostate | BPH | mRNA surveillance pathway | 32/1718 | 97/8465 | 2.20e-03 | 8.63e-03 | 5.34e-03 | 32 |
| hsa0301512 | Prostate | BPH | mRNA surveillance pathway | 32/1718 | 97/8465 | 2.20e-03 | 8.63e-03 | 5.34e-03 | 32 |
| hsa0301522 | Prostate | Tumor | mRNA surveillance pathway | 33/1791 | 97/8465 | 2.18e-03 | 8.60e-03 | 5.33e-03 | 33 |
| hsa0301532 | Prostate | Tumor | mRNA surveillance pathway | 33/1791 | 97/8465 | 2.18e-03 | 8.60e-03 | 5.33e-03 | 33 |
| Page: 1 |
Top |
Cell-cell communication analysis |
| Identification of potential cell-cell interactions between two cell types and their ligand-receptor pairs for different disease states |
| Ligand | Receptor | LRpair | Pathway | Tissue | Disease Stage |
| Page: 1 |
Top |
Single-cell gene regulatory network inference analysis |
| Find out the significant the regulons (TFs) and the target genes of each regulon across cell types for different disease states |
| TF | Cell Type | Tissue | Disease Stage | Target Gene | RSS | Regulon Activity |
| ∗The dot plots of a searched regulon are shown for all cell subpopulations in each disease state of each tissue based on the regulon specific score inferred using pySCENIC and by calculating the average expression. |
| Page: 1 |
Top |
Somatic mutation of malignant transformation related genes |
| Annotation of somatic variants for genes involved in malignant transformation |
| Hugo Symbol | Variant Class | Variant Classification | dbSNP RS | HGVSc | HGVSp | HGVSp Short | SWISSPROT | BIOTYPE | SIFT | PolyPhen | Tumor Sample Barcode | Tissue | Histology | Sex | Age | Stage | Therapy Types | Drugs | Outcome |
| SSU72 | SNV | Missense_Mutation | novel | c.405C>A | p.His135Gln | p.H135Q | Q9NP77 | protein_coding | deleterious(0) | probably_damaging(1) | TCGA-A2-A4S0-01 | Breast | breast invasive carcinoma | Female | >=65 | I/II | Unknown | Unknown | SD |
| SSU72 | SNV | Missense_Mutation | c.377G>C | p.Arg126Thr | p.R126T | Q9NP77 | protein_coding | deleterious(0.01) | possibly_damaging(0.616) | TCGA-C5-A902-01 | Cervix | cervical & endocervical cancer | Female | <65 | I/II | Chemotherapy | cisplatin | SD | |
| SSU72 | SNV | Missense_Mutation | c.554G>A | p.Arg185His | p.R185H | Q9NP77 | protein_coding | tolerated(0.28) | possibly_damaging(0.775) | TCGA-AA-3864-01 | Colorectum | colon adenocarcinoma | Male | >=65 | I/II | Unknown | Unknown | SD | |
| SSU72 | SNV | Missense_Mutation | rs751224426 | c.281G>A | p.Arg94Gln | p.R94Q | Q9NP77 | protein_coding | tolerated(0.41) | benign(0.005) | TCGA-CM-6674-01 | Colorectum | colon adenocarcinoma | Male | <65 | I/II | Unknown | Unknown | SD |
| SSU72 | insertion | Frame_Shift_Ins | novel | c.245dupT | p.Leu82PhefsTer8 | p.L82Ffs*8 | Q9NP77 | protein_coding | TCGA-A6-5661-01 | Colorectum | colon adenocarcinoma | Female | >=65 | I/II | Unknown | Unknown | SD | ||
| SSU72 | SNV | Missense_Mutation | novel | c.85N>T | p.Arg29Trp | p.R29W | Q9NP77 | protein_coding | deleterious(0) | probably_damaging(0.97) | TCGA-A5-A0GI-01 | Endometrium | uterine corpus endometrioid carcinoma | Female | <65 | I/II | Unknown | Unknown | SD |
| SSU72 | SNV | Missense_Mutation | novel | c.316G>T | p.Asp106Tyr | p.D106Y | Q9NP77 | protein_coding | deleterious(0) | probably_damaging(0.999) | TCGA-AJ-A3EK-01 | Endometrium | uterine corpus endometrioid carcinoma | Female | <65 | I/II | Chemotherapy | carboplatin | CR |
| SSU72 | SNV | Missense_Mutation | novel | c.455C>T | p.Ala152Val | p.A152V | Q9NP77 | protein_coding | deleterious(0.01) | benign(0.396) | TCGA-AX-A1CE-01 | Endometrium | uterine corpus endometrioid carcinoma | Female | <65 | I/II | Unspecific | Paclitaxel | SD |
| SSU72 | SNV | Missense_Mutation | novel | c.505G>A | p.Glu169Lys | p.E169K | Q9NP77 | protein_coding | deleterious(0) | possibly_damaging(0.808) | TCGA-AX-A2HD-01 | Endometrium | uterine corpus endometrioid carcinoma | Female | >=65 | III/IV | Unknown | Unknown | SD |
| SSU72 | SNV | Missense_Mutation | c.554N>A | p.Arg185His | p.R185H | Q9NP77 | protein_coding | tolerated(0.28) | possibly_damaging(0.775) | TCGA-EY-A1GD-01 | Endometrium | uterine corpus endometrioid carcinoma | Female | <65 | I/II | Unknown | Unknown | SD |
| Page: 1 2 |
Top |
Related drugs of malignant transformation related genes |
| Identification of chemicals and drugs interact with genes involved in malignant transfromation |
| (DGIdb 4.0) |
| Entrez ID | Symbol | Category | Interaction Types | Drug Claim Name | Drug Name | PMIDs |
| Page: 1 |

Copyright 2023-Present -The University of Texas Health Science Center at Houston |