
|
|||||
|
 | |
| |
| |
| |
| |
| |
|
Gene: SSTR2 |
Gene summary for SSTR2 |
| Gene information | Species | Human | Gene symbol | SSTR2 | Gene ID | 6752 |
| Gene name | somatostatin receptor 2 | |
| Gene Alias | SSTR2 | |
| Cytomap | 17q25.1 | |
| Gene Type | protein-coding | GO ID | GO:0000003 | UniProtAcc | P30874 |
Top |
Malignant transformation analysis |
| Identification of the aberrant gene expression in precancerous and cancerous lesions by comparing the gene expression of stem-like cells in diseased tissues with normal stem cells |
| Entrez ID | Symbol | Replicates | Species | Organ | Tissue | Adj P-value | Log2FC | Malignancy |
| 6752 | SSTR2 | HCC1_Meng | Human | Liver | HCC | 3.66e-64 | 1.75e-01 | 0.0246 |
| 6752 | SSTR2 | HCC2 | Human | Liver | HCC | 4.47e-16 | 2.71e+00 | 0.5341 |
| 6752 | SSTR2 | HCC5 | Human | Liver | HCC | 8.83e-06 | 9.14e-01 | 0.4932 |
| 6752 | SSTR2 | Pt13.b | Human | Liver | HCC | 4.72e-03 | 2.46e-01 | 0.0251 |
| Page: 1 |
| Tissue | Expression Dynamics | Abbreviation |
| Liver | 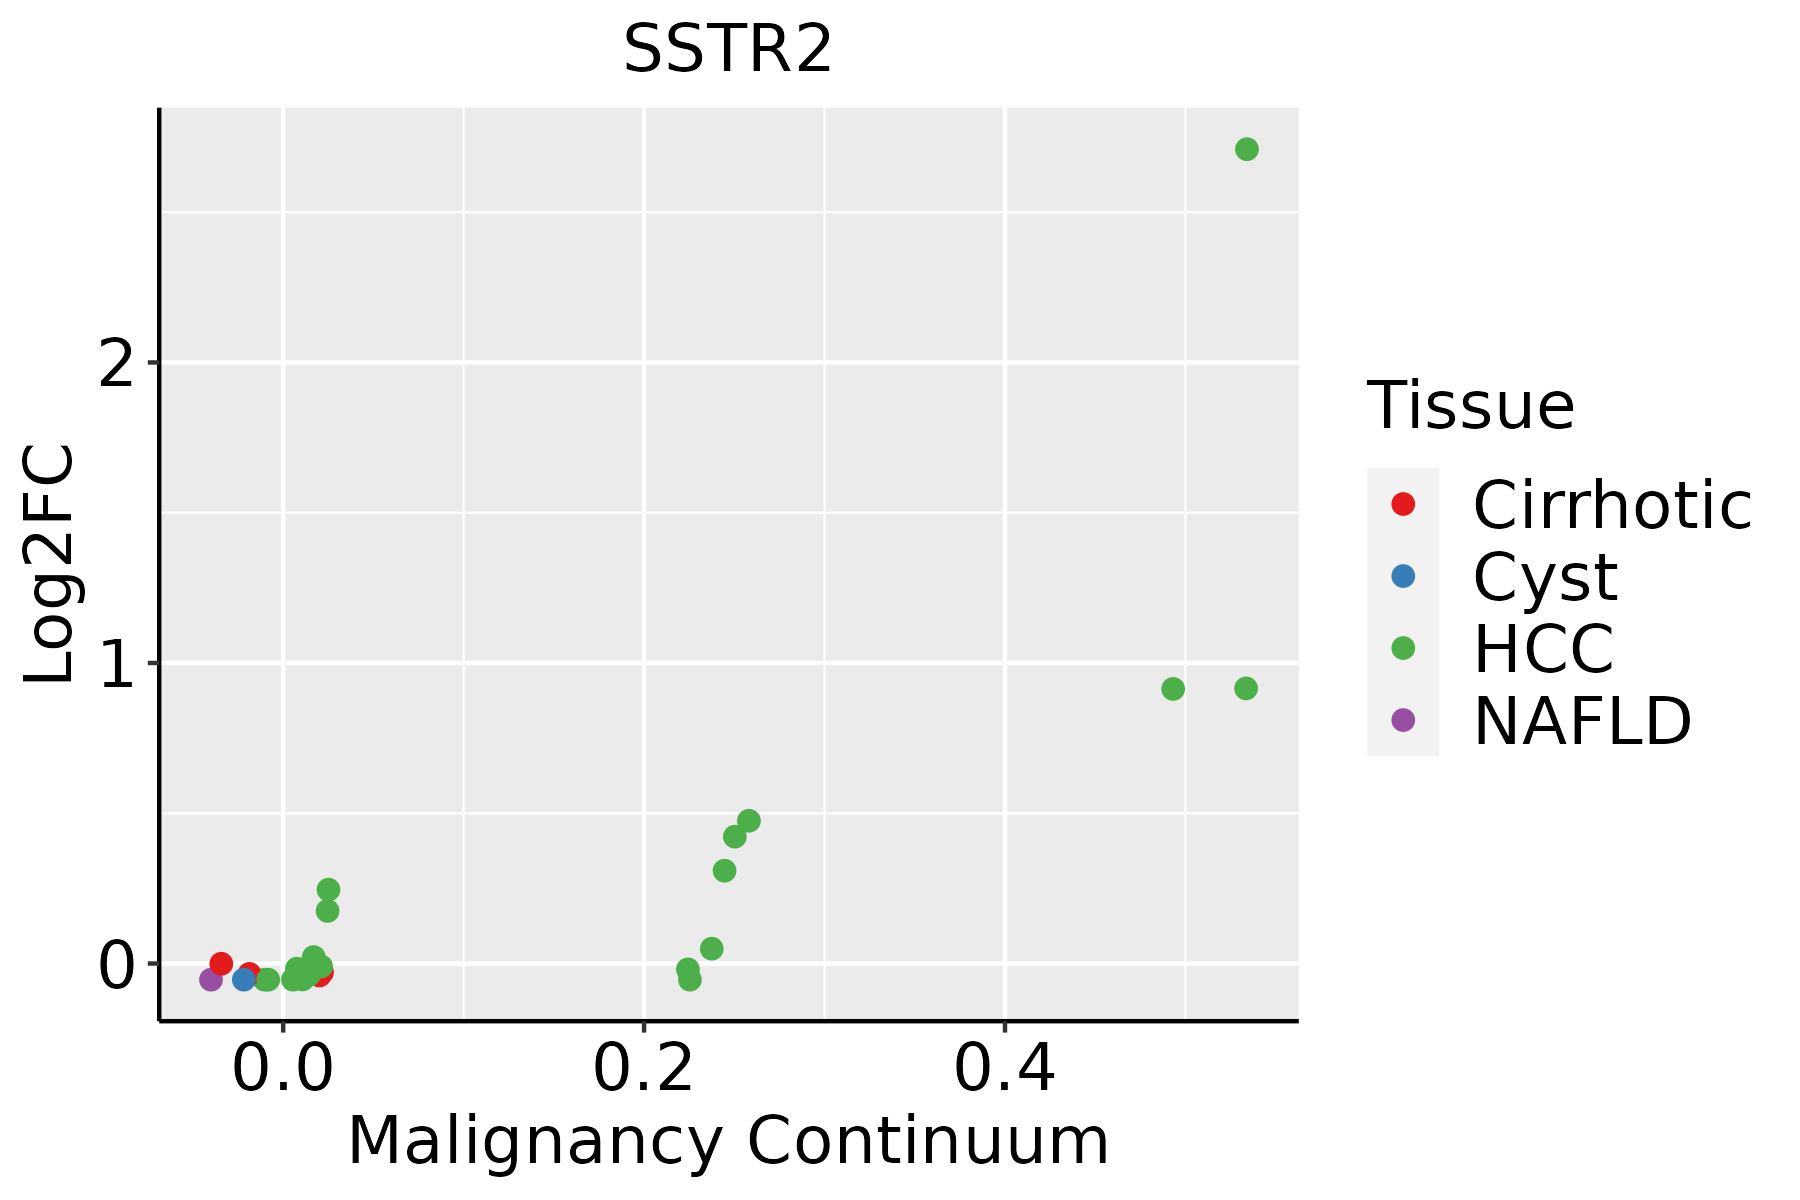 | HCC: Hepatocellular carcinoma |
| NAFLD: Non-alcoholic fatty liver disease |
| ∗log2FC in expression of this searched gene in stem-like cells from each diseased tissue sample relative to stem-like cells in normal samples in each tissue plotted against the malignancy continuum. Samples are colored based on if they are from different disease stage. |
Top |
Malignant transformation related pathway analysis |
| Find out the enriched GO biological processes and KEGG pathways involved in transition from healthy to precancer to cancer |
| Tissue | Disease Stage | Enriched GO biological Processes |
| Colorectum | AD |  |
| Colorectum | SER |  |
| Colorectum | MSS |  |
| Colorectum | MSI-H |  |
| Colorectum | FAP |  |
| ∗Top 15 enriched GO BP terms are showed in the bar plot of each disease state in each tissue. Each row represents a significant GO biological process which is colored according to the -log10(p.adjust). |
| Page: 1 2 3 4 5 6 7 8 9 |
| GO ID | Tissue | Disease Stage | Description | Gene Ratio | Bg Ratio | pvalue | p.adjust | Count |
| GO:003166722 | Liver | HCC | response to nutrient levels | 276/7958 | 474/18723 | 2.30e-12 | 1.08e-10 | 276 |
| GO:004854522 | Liver | HCC | response to steroid hormone | 206/7958 | 339/18723 | 6.81e-12 | 2.92e-10 | 206 |
| GO:007138322 | Liver | HCC | cellular response to steroid hormone stimulus | 128/7958 | 204/18723 | 3.92e-09 | 1.04e-07 | 128 |
| GO:004259421 | Liver | HCC | response to starvation | 121/7958 | 197/18723 | 6.08e-08 | 1.28e-06 | 121 |
| GO:005138421 | Liver | HCC | response to glucocorticoid | 90/7958 | 148/18723 | 5.18e-06 | 6.47e-05 | 90 |
| GO:003196021 | Liver | HCC | response to corticosteroid | 98/7958 | 167/18723 | 1.73e-05 | 1.87e-04 | 98 |
| GO:007138421 | Liver | HCC | cellular response to corticosteroid stimulus | 41/7958 | 61/18723 | 8.37e-05 | 7.36e-04 | 41 |
| GO:007138521 | Liver | HCC | cellular response to glucocorticoid stimulus | 38/7958 | 56/18723 | 1.11e-04 | 9.41e-04 | 38 |
| GO:000975521 | Liver | HCC | hormone-mediated signaling pathway | 106/7958 | 190/18723 | 1.45e-04 | 1.17e-03 | 106 |
| GO:00323552 | Liver | HCC | response to estradiol | 81/7958 | 141/18723 | 2.39e-04 | 1.79e-03 | 81 |
| Page: 1 |
| Pathway ID | Tissue | Disease Stage | Description | Gene Ratio | Bg Ratio | pvalue | p.adjust | qvalue | Count |
| Page: 1 |
Top |
Cell-cell communication analysis |
| Identification of potential cell-cell interactions between two cell types and their ligand-receptor pairs for different disease states |
| Ligand | Receptor | LRpair | Pathway | Tissue | Disease Stage |
| Page: 1 |
Top |
Single-cell gene regulatory network inference analysis |
| Find out the significant the regulons (TFs) and the target genes of each regulon across cell types for different disease states |
| TF | Cell Type | Tissue | Disease Stage | Target Gene | RSS | Regulon Activity |
| ∗The dot plots of a searched regulon are shown for all cell subpopulations in each disease state of each tissue based on the regulon specific score inferred using pySCENIC and by calculating the average expression. |
| Page: 1 |
Top |
Somatic mutation of malignant transformation related genes |
| Annotation of somatic variants for genes involved in malignant transformation |
| Hugo Symbol | Variant Class | Variant Classification | dbSNP RS | HGVSc | HGVSp | HGVSp Short | SWISSPROT | BIOTYPE | SIFT | PolyPhen | Tumor Sample Barcode | Tissue | Histology | Sex | Age | Stage | Therapy Types | Drugs | Outcome |
| SSTR2 | SNV | Missense_Mutation | c.460N>G | p.Arg154Gly | p.R154G | P30874 | protein_coding | deleterious(0) | probably_damaging(0.998) | TCGA-AN-A0FT-01 | Breast | breast invasive carcinoma | Female | <65 | I/II | Unknown | Unknown | SD | |
| SSTR2 | insertion | Frame_Shift_Ins | novel | c.1055_1056insACATATATTCCATCATTTAACCTTCATGACGCCCCCATGT | p.Thr353HisfsTer68 | p.T353Hfs*68 | P30874 | protein_coding | TCGA-AO-A0J9-01 | Breast | breast invasive carcinoma | Female | <65 | III/IV | Chemotherapy | cyclophosphamide | PD | ||
| SSTR2 | SNV | Missense_Mutation | c.829N>A | p.Val277Ile | p.V277I | P30874 | protein_coding | tolerated(1) | benign(0.028) | TCGA-AA-3672-01 | Colorectum | colon adenocarcinoma | Female | >=65 | III/IV | Unknown | Unknown | SD | |
| SSTR2 | SNV | Missense_Mutation | rs201497830 | c.470N>A | p.Arg157Gln | p.R157Q | P30874 | protein_coding | tolerated(0.28) | benign(0.056) | TCGA-AA-3984-01 | Colorectum | colon adenocarcinoma | Female | <65 | I/II | Unknown | Unknown | SD |
| SSTR2 | SNV | Missense_Mutation | rs779626588 | c.838N>A | p.Val280Ile | p.V280I | P30874 | protein_coding | tolerated(0.1) | possibly_damaging(0.832) | TCGA-D5-6920-01 | Colorectum | colon adenocarcinoma | Female | >=65 | I/II | Unknown | Unknown | SD |
| SSTR2 | SNV | Missense_Mutation | c.286C>A | p.Leu96Met | p.L96M | P30874 | protein_coding | deleterious(0) | probably_damaging(0.997) | TCGA-D5-6930-01 | Colorectum | colon adenocarcinoma | Male | >=65 | I/II | Unknown | Unknown | SD | |
| SSTR2 | SNV | Missense_Mutation | c.844N>G | p.Met282Val | p.M282V | P30874 | protein_coding | tolerated(0.87) | benign(0) | TCGA-WS-AB45-01 | Colorectum | colon adenocarcinoma | Female | <65 | I/II | Unknown | Unknown | SD | |
| SSTR2 | SNV | Missense_Mutation | rs779626588 | c.838N>A | p.Val280Ile | p.V280I | P30874 | protein_coding | tolerated(0.1) | possibly_damaging(0.832) | TCGA-AG-A002-01 | Colorectum | rectum adenocarcinoma | Male | <65 | I/II | Unknown | Unknown | SD |
| SSTR2 | SNV | Missense_Mutation | rs752640995 | c.473N>T | p.Thr158Met | p.T158M | P30874 | protein_coding | deleterious(0.04) | benign(0.019) | TCGA-AH-6544-01 | Colorectum | rectum adenocarcinoma | Male | <65 | III/IV | Chemotherapy | oxaliplatin | SD |
| SSTR2 | insertion | In_Frame_Ins | novel | c.971_972insGAATGTCCTCTGCTTGGTCAAGGTGAGGACATTCTGGAAGCTCTTCTT | p.Val332_Ser333insArgThrPheTrpLysLeuPheLeuAsnValLeuCysLeuValLysVal | p.V332_S333insRTFWKLFLNVLCLVKV | P30874 | protein_coding | TCGA-AA-A00N-01 | Colorectum | colon adenocarcinoma | Male | >=65 | I/II | Unknown | Unknown | PD |
| Page: 1 2 3 4 5 |
Top |
Related drugs of malignant transformation related genes |
| Identification of chemicals and drugs interact with genes involved in malignant transfromation |
| (DGIdb 4.0) |
| Entrez ID | Symbol | Category | Interaction Types | Drug Claim Name | Drug Name | PMIDs |
| 6752 | SSTR2 | G PROTEIN COUPLED RECEPTOR, DRUGGABLE GENOME | agonist | CHEMBL2103975 | VAPREOTIDE | |
| 6752 | SSTR2 | G PROTEIN COUPLED RECEPTOR, DRUGGABLE GENOME | INSULIN | INSULIN | 10614629 | |
| 6752 | SSTR2 | G PROTEIN COUPLED RECEPTOR, DRUGGABLE GENOME | Lanreotide acetate | |||
| 6752 | SSTR2 | G PROTEIN COUPLED RECEPTOR, DRUGGABLE GENOME | agonist | 135652642 | ||
| 6752 | SSTR2 | G PROTEIN COUPLED RECEPTOR, DRUGGABLE GENOME | agonist | CHEMBL3545188 | PASIREOTIDE PAMOATE | |
| 6752 | SSTR2 | G PROTEIN COUPLED RECEPTOR, DRUGGABLE GENOME | agonist | 135652031 | ||
| 6752 | SSTR2 | G PROTEIN COUPLED RECEPTOR, DRUGGABLE GENOME | agonist | CHEMBL1201184 | LANREOTIDE ACETATE | |
| 6752 | SSTR2 | G PROTEIN COUPLED RECEPTOR, DRUGGABLE GENOME | agonist | 135652022 | LANREOTIDE | |
| 6752 | SSTR2 | G PROTEIN COUPLED RECEPTOR, DRUGGABLE GENOME | agonist | 178102259 | ||
| 6752 | SSTR2 | G PROTEIN COUPLED RECEPTOR, DRUGGABLE GENOME | agonist | 178102257 |
| Page: 1 2 3 4 5 6 7 8 9 10 |

Copyright 2023-Present -The University of Texas Health Science Center at Houston |