
|
|||||
|
 | |
| |
| |
| |
| |
| |
|
Gene: SST |
Gene summary for SST |
| Gene information | Species | Human | Gene symbol | SST | Gene ID | 6750 |
| Gene name | somatostatin | |
| Gene Alias | SMST | |
| Cytomap | 3q27.3 | |
| Gene Type | protein-coding | GO ID | GO:0001101 | UniProtAcc | P61278 |
Top |
Malignant transformation analysis |
| Identification of the aberrant gene expression in precancerous and cancerous lesions by comparing the gene expression of stem-like cells in diseased tissues with normal stem cells |
| Entrez ID | Symbol | Replicates | Species | Organ | Tissue | Adj P-value | Log2FC | Malignancy |
| 6750 | SST | HTA12-15-2 | Human | Pancreas | PDAC | 4.77e-35 | 1.96e+00 | 0.2315 |
| 6750 | SST | HTA12-18-3 | Human | Pancreas | PDAC | 3.38e-08 | 1.51e+00 | 0.0716 |
| 6750 | SST | HTA12-23-1 | Human | Pancreas | PDAC | 3.54e-15 | 1.61e+00 | 0.3405 |
| 6750 | SST | HTA12-25-1 | Human | Pancreas | PDAC | 3.30e-12 | 1.30e+00 | 0.313 |
| 6750 | SST | HTA12-26-1 | Human | Pancreas | PDAC | 1.58e-33 | 1.61e+00 | 0.3728 |
| 6750 | SST | HTA12-29-1 | Human | Pancreas | PDAC | 4.25e-92 | 1.68e+00 | 0.3722 |
| 6750 | SST | HTA12-32-1 | Human | Pancreas | PDAC | 3.11e-04 | 1.41e+00 | 0.3624 |
| 6750 | SST | HTA12-9-1 | Human | Pancreas | PDAC | 3.85e-30 | 1.44e+00 | 0.1532 |
| 6750 | SST | HTA12-9-2 | Human | Pancreas | PDAC | 4.61e-12 | 1.23e+00 | 0.0835 |
| 6750 | SST | HTA12-9-3 | Human | Pancreas | PDAC | 6.37e-30 | 1.93e+00 | 0.2045 |
| 6750 | SST | 4347-EC | Human | Pancreas | PanIN | 7.20e-115 | 1.54e+00 | 0.0572 |
| 6750 | SST | 4741-EC1 | Human | Pancreas | PanIN | 1.92e-03 | 5.95e-01 | 0.0223 |
| 6750 | SST | 4741-EC2 | Human | Pancreas | PanIN | 1.33e-02 | 5.07e-01 | 0.0194 |
| 6750 | SST | DS20191261Tumor | Human | Pancreas | PDAC | 1.75e-07 | -8.19e-01 | 0.1367 |
| 6750 | SST | Pat25-A | Human | Stomach | CAG with IM | 3.78e-06 | -1.86e-02 | -0.1648 |
| 6750 | SST | NAG_3 | Human | Stomach | CSG | 5.40e-20 | 8.60e-01 | -0.2816 |
| 6750 | SST | CAG_1 | Human | Stomach | CAG | 1.67e-06 | 4.88e-01 | -0.3206 |
| 6750 | SST | CAG_2 | Human | Stomach | CAG | 4.07e-26 | 6.88e-01 | -0.2831 |
| 6750 | SST | CAG_3 | Human | Stomach | CAG | 1.41e-19 | 5.38e-01 | -0.2766 |
| 6750 | SST | WIM_2 | Human | Stomach | WIM | 3.10e-02 | 2.12e-01 | 0.1159 |
| Page: 1 |
| Tissue | Expression Dynamics | Abbreviation |
| GC | 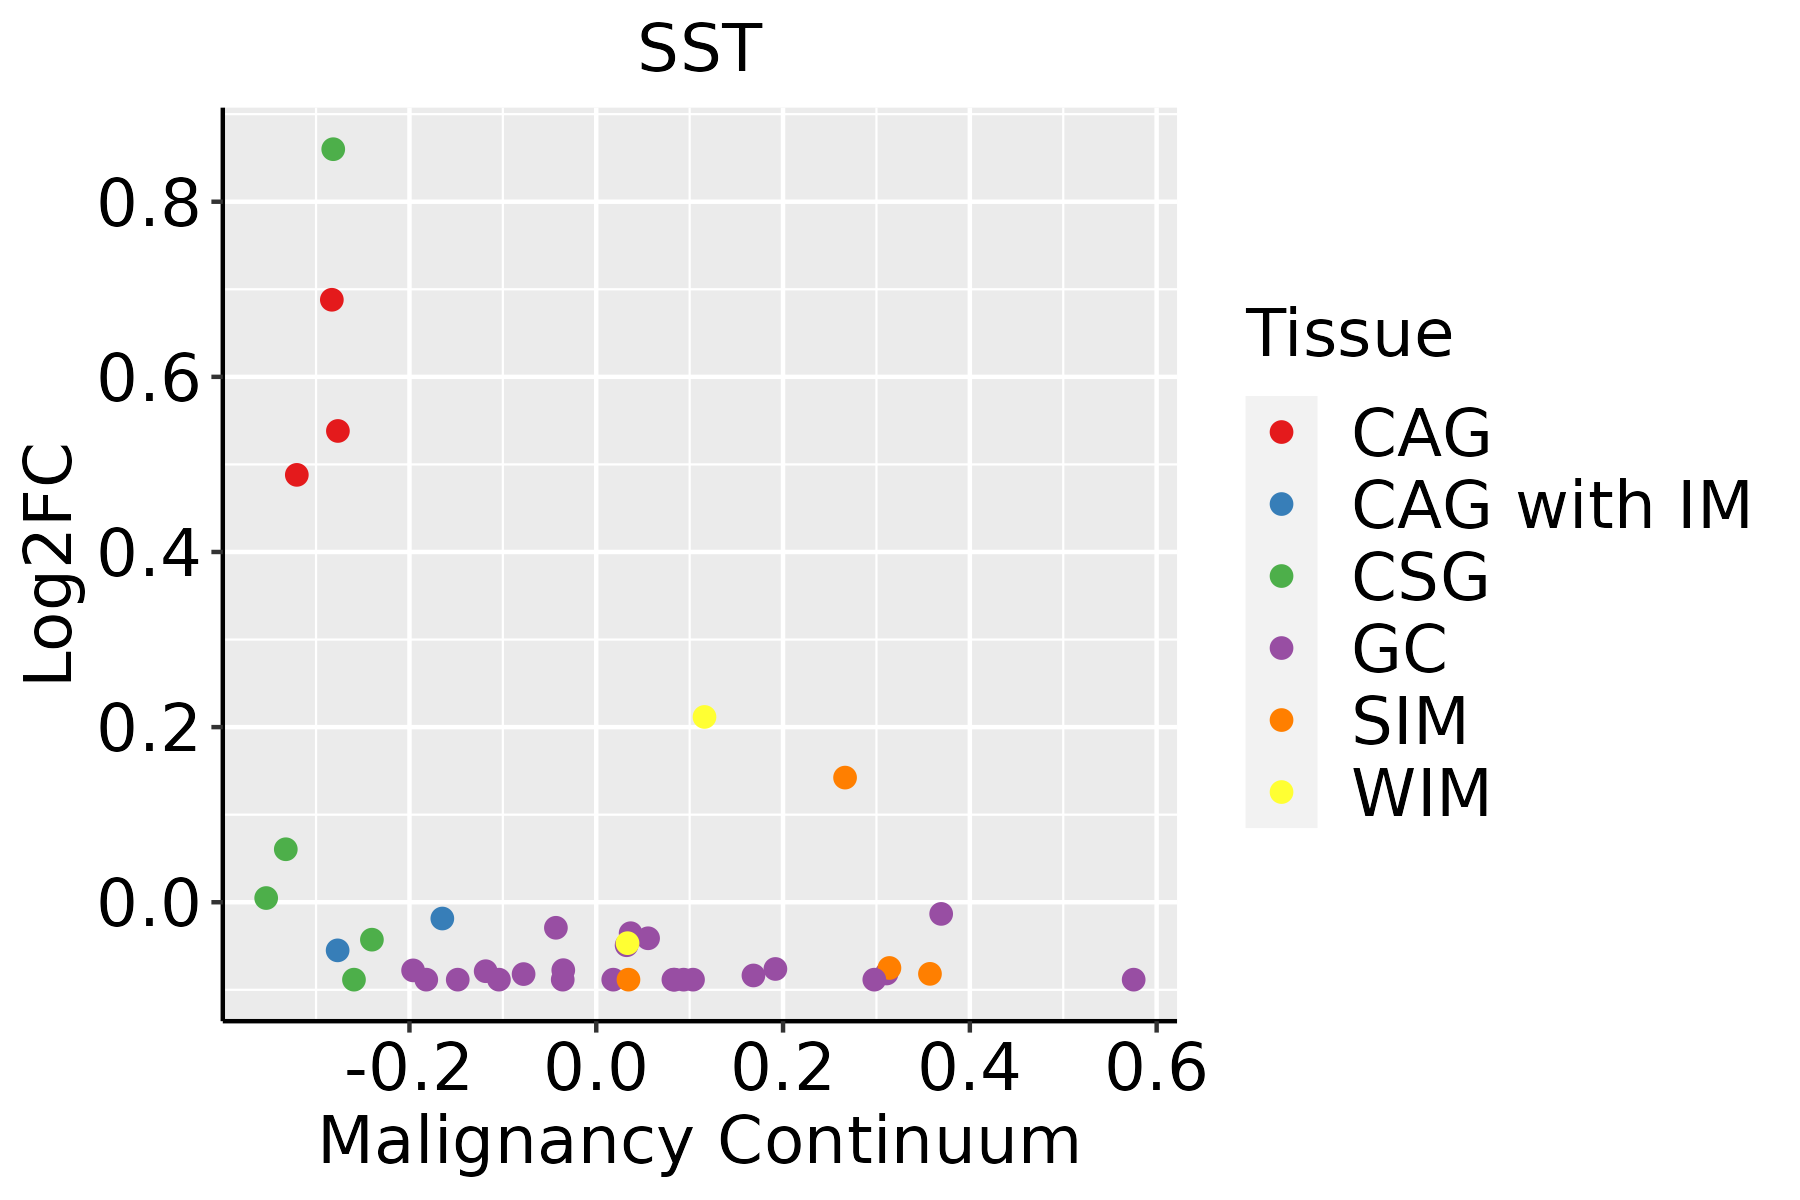 | CAG: Chronic atrophic gastritis |
| CAG with IM: Chronic atrophic gastritis with intestinal metaplasia | ||
| CSG: Chronic superficial gastritis | ||
| GC: Gastric cancer | ||
| SIM: Severe intestinal metaplasia | ||
| WIM: Wild intestinal metaplasia |
| ∗log2FC in expression of this searched gene in stem-like cells from each diseased tissue sample relative to stem-like cells in normal samples in each tissue plotted against the malignancy continuum. Samples are colored based on if they are from different disease stage. |
Top |
Malignant transformation related pathway analysis |
| Find out the enriched GO biological processes and KEGG pathways involved in transition from healthy to precancer to cancer |
| Tissue | Disease Stage | Enriched GO biological Processes |
| Colorectum | AD |  |
| Colorectum | SER |  |
| Colorectum | MSS |  |
| Colorectum | MSI-H |  |
| Colorectum | FAP |  |
| ∗Top 15 enriched GO BP terms are showed in the bar plot of each disease state in each tissue. Each row represents a significant GO biological process which is colored according to the -log10(p.adjust). |
| Page: 1 2 3 4 5 6 7 8 9 |
| GO ID | Tissue | Disease Stage | Description | Gene Ratio | Bg Ratio | pvalue | p.adjust | Count |
| GO:003166722 | Liver | HCC | response to nutrient levels | 276/7958 | 474/18723 | 2.30e-12 | 1.08e-10 | 276 |
| GO:004854522 | Liver | HCC | response to steroid hormone | 206/7958 | 339/18723 | 6.81e-12 | 2.92e-10 | 206 |
| GO:007138322 | Liver | HCC | cellular response to steroid hormone stimulus | 128/7958 | 204/18723 | 3.92e-09 | 1.04e-07 | 128 |
| GO:004259421 | Liver | HCC | response to starvation | 121/7958 | 197/18723 | 6.08e-08 | 1.28e-06 | 121 |
| GO:005138421 | Liver | HCC | response to glucocorticoid | 90/7958 | 148/18723 | 5.18e-06 | 6.47e-05 | 90 |
| GO:003196021 | Liver | HCC | response to corticosteroid | 98/7958 | 167/18723 | 1.73e-05 | 1.87e-04 | 98 |
| GO:007138421 | Liver | HCC | cellular response to corticosteroid stimulus | 41/7958 | 61/18723 | 8.37e-05 | 7.36e-04 | 41 |
| GO:007138521 | Liver | HCC | cellular response to glucocorticoid stimulus | 38/7958 | 56/18723 | 1.11e-04 | 9.41e-04 | 38 |
| GO:000975521 | Liver | HCC | hormone-mediated signaling pathway | 106/7958 | 190/18723 | 1.45e-04 | 1.17e-03 | 106 |
| GO:00323552 | Liver | HCC | response to estradiol | 81/7958 | 141/18723 | 2.39e-04 | 1.79e-03 | 81 |
| GO:00075861 | Stomach | CAG with IM | digestion | 29/1050 | 137/18723 | 4.42e-10 | 6.93e-08 | 29 |
| GO:000941011 | Stomach | CAG with IM | response to xenobiotic stimulus | 54/1050 | 462/18723 | 2.55e-07 | 1.60e-05 | 54 |
| GO:004854511 | Stomach | CAG with IM | response to steroid hormone | 40/1050 | 339/18723 | 7.19e-06 | 2.57e-04 | 40 |
| GO:00092661 | Stomach | CAG with IM | response to temperature stimulus | 25/1050 | 178/18723 | 2.09e-05 | 6.09e-04 | 25 |
| GO:003166711 | Stomach | CAG with IM | response to nutrient levels | 48/1050 | 474/18723 | 5.51e-05 | 1.38e-03 | 48 |
| GO:00094081 | Stomach | CAG with IM | response to heat | 16/1050 | 110/18723 | 4.13e-04 | 6.53e-03 | 16 |
| GO:00075841 | Stomach | CAG with IM | response to nutrient | 19/1050 | 174/18723 | 4.17e-03 | 3.57e-02 | 19 |
| GO:00075862 | Stomach | CSG | digestion | 25/1034 | 137/18723 | 1.15e-07 | 8.25e-06 | 25 |
| GO:000941021 | Stomach | CSG | response to xenobiotic stimulus | 53/1034 | 462/18723 | 3.69e-07 | 2.22e-05 | 53 |
| GO:004854521 | Stomach | CSG | response to steroid hormone | 40/1034 | 339/18723 | 4.99e-06 | 1.94e-04 | 40 |
| Page: 1 2 |
| Pathway ID | Tissue | Disease Stage | Description | Gene Ratio | Bg Ratio | pvalue | p.adjust | qvalue | Count |
| Page: 1 |
Top |
Cell-cell communication analysis |
| Identification of potential cell-cell interactions between two cell types and their ligand-receptor pairs for different disease states |
| Ligand | Receptor | LRpair | Pathway | Tissue | Disease Stage |
| Page: 1 |
Top |
Single-cell gene regulatory network inference analysis |
| Find out the significant the regulons (TFs) and the target genes of each regulon across cell types for different disease states |
| TF | Cell Type | Tissue | Disease Stage | Target Gene | RSS | Regulon Activity |
| ∗The dot plots of a searched regulon are shown for all cell subpopulations in each disease state of each tissue based on the regulon specific score inferred using pySCENIC and by calculating the average expression. |
| Page: 1 |
Top |
Somatic mutation of malignant transformation related genes |
| Annotation of somatic variants for genes involved in malignant transformation |
| Hugo Symbol | Variant Class | Variant Classification | dbSNP RS | HGVSc | HGVSp | HGVSp Short | SWISSPROT | BIOTYPE | SIFT | PolyPhen | Tumor Sample Barcode | Tissue | Histology | Sex | Age | Stage | Therapy Types | Drugs | Outcome |
| SST | SNV | Missense_Mutation | c.173N>T | p.Ser58Phe | p.S58F | P61278 | protein_coding | deleterious(0) | possibly_damaging(0.855) | TCGA-C8-A12K-01 | Breast | breast invasive carcinoma | Female | >=65 | I/II | Unknown | Unknown | SD | |
| SST | SNV | Missense_Mutation | rs763961867 | c.14N>A | p.Arg5His | p.R5H | P61278 | protein_coding | tolerated(0.13) | possibly_damaging(0.765) | TCGA-UC-A7PF-01 | Cervix | cervical & endocervical cancer | Female | <65 | I/II | Unknown | Unknown | SD |
| SST | SNV | Missense_Mutation | c.263N>T | p.Arg88Ile | p.R88I | P61278 | protein_coding | deleterious(0) | probably_damaging(0.991) | TCGA-AA-A00N-01 | Colorectum | colon adenocarcinoma | Male | >=65 | I/II | Unknown | Unknown | PD | |
| SST | SNV | Missense_Mutation | novel | c.43N>C | p.Ile15Leu | p.I15L | P61278 | protein_coding | tolerated(1) | benign(0) | TCGA-AM-5820-01 | Colorectum | colon adenocarcinoma | Female | <65 | I/II | Unknown | Unknown | SD |
| SST | SNV | Missense_Mutation | c.302N>A | p.Arg101His | p.R101H | P61278 | protein_coding | deleterious(0) | probably_damaging(0.998) | TCGA-AZ-4315-01 | Colorectum | colon adenocarcinoma | Male | <65 | I/II | Unknown | Unknown | SD | |
| SST | insertion | Frame_Shift_Ins | novel | c.44_45insTA | p.Val16ThrfsTer68 | p.V16Tfs*68 | P61278 | protein_coding | TCGA-AM-5820-01 | Colorectum | colon adenocarcinoma | Female | <65 | I/II | Unknown | Unknown | SD | ||
| SST | SNV | Missense_Mutation | c.13C>T | p.Arg5Cys | p.R5C | P61278 | protein_coding | deleterious(0) | possibly_damaging(0.828) | TCGA-AJ-A3BG-01 | Endometrium | uterine corpus endometrioid carcinoma | Female | >=65 | I/II | Chemotherapy | carboplatin | PD | |
| SST | SNV | Missense_Mutation | novel | c.181N>G | p.Asn61Asp | p.N61D | P61278 | protein_coding | tolerated(0.36) | benign(0.003) | TCGA-AX-A05Z-01 | Endometrium | uterine corpus endometrioid carcinoma | Female | <65 | III/IV | Chemotherapy | adriamycin | SD |
| SST | SNV | Missense_Mutation | rs149673471 | c.188N>T | p.Thr63Met | p.T63M | P61278 | protein_coding | deleterious(0.03) | benign(0.215) | TCGA-AX-A0IZ-01 | Endometrium | uterine corpus endometrioid carcinoma | Female | <65 | I/II | Unknown | Unknown | SD |
| SST | SNV | Missense_Mutation | rs778157951 | c.40N>C | p.Ser14Pro | p.S14P | P61278 | protein_coding | tolerated(0.23) | possibly_damaging(0.638) | TCGA-B5-A1MR-01 | Endometrium | uterine corpus endometrioid carcinoma | Female | >=65 | III/IV | Unknown | Unknown | SD |
| Page: 1 2 |
Top |
Related drugs of malignant transformation related genes |
| Identification of chemicals and drugs interact with genes involved in malignant transfromation |
| (DGIdb 4.0) |
| Entrez ID | Symbol | Category | Interaction Types | Drug Claim Name | Drug Name | PMIDs |
| 6750 | SST | HORMONE ACTIVITY, DRUGGABLE GENOME | ESTRADIOL BENZOATE | 10211766 | ||
| 6750 | SST | HORMONE ACTIVITY, DRUGGABLE GENOME | GANCICLOVIR | GANCICLOVIR | 10766345 | |
| 6750 | SST | HORMONE ACTIVITY, DRUGGABLE GENOME | STREPTOZOTOCIN | STREPTOZOCIN | 7664670 | |
| 6750 | SST | HORMONE ACTIVITY, DRUGGABLE GENOME | CAPTOPRIL | CAPTOPRIL | 2864479 | |
| 6750 | SST | HORMONE ACTIVITY, DRUGGABLE GENOME | FREUND&APOS;S ADJUVANT | 15146439 | ||
| 6750 | SST | HORMONE ACTIVITY, DRUGGABLE GENOME | ACETYLSALICYLIC ACID | 6108875 | ||
| 6750 | SST | HORMONE ACTIVITY, DRUGGABLE GENOME | VALINOMYCIN | VALINOMYCIN | 6129560 | |
| 6750 | SST | HORMONE ACTIVITY, DRUGGABLE GENOME | LITHIUM | LITHIUM | 2888503 | |
| 6750 | SST | HORMONE ACTIVITY, DRUGGABLE GENOME | VALPROIC ACID | 1972258 | ||
| 6750 | SST | HORMONE ACTIVITY, DRUGGABLE GENOME | BOMBESIN ANTAGONIST | 1976209 |
| Page: 1 2 |

Copyright 2023-Present -The University of Texas Health Science Center at Houston |