
|
|||||
|
 | |
| |
| |
| |
| |
| |
|
Gene: SSR3 |
Gene summary for SSR3 |
| Gene information | Species | Human | Gene symbol | SSR3 | Gene ID | 6747 |
| Gene name | signal sequence receptor subunit 3 | |
| Gene Alias | TRAPG | |
| Cytomap | 3q25.31 | |
| Gene Type | protein-coding | GO ID | GO:0006605 | UniProtAcc | Q9UNL2 |
Top |
Malignant transformation analysis |
| Identification of the aberrant gene expression in precancerous and cancerous lesions by comparing the gene expression of stem-like cells in diseased tissues with normal stem cells |
| Entrez ID | Symbol | Replicates | Species | Organ | Tissue | Adj P-value | Log2FC | Malignancy |
| 6747 | SSR3 | GSM4909285 | Human | Breast | IDC | 7.36e-42 | 7.08e-01 | 0.21 |
| 6747 | SSR3 | GSM4909286 | Human | Breast | IDC | 1.74e-06 | -3.17e-01 | 0.1081 |
| 6747 | SSR3 | GSM4909287 | Human | Breast | IDC | 5.81e-05 | 2.77e-01 | 0.2057 |
| 6747 | SSR3 | GSM4909288 | Human | Breast | IDC | 1.43e-04 | 2.22e-01 | 0.0988 |
| 6747 | SSR3 | GSM4909293 | Human | Breast | IDC | 2.66e-05 | 3.05e-01 | 0.1581 |
| 6747 | SSR3 | GSM4909294 | Human | Breast | IDC | 1.03e-03 | -2.66e-01 | 0.2022 |
| 6747 | SSR3 | GSM4909296 | Human | Breast | IDC | 3.19e-11 | 5.99e-02 | 0.1524 |
| 6747 | SSR3 | GSM4909297 | Human | Breast | IDC | 4.66e-16 | -2.14e-01 | 0.1517 |
| 6747 | SSR3 | GSM4909304 | Human | Breast | IDC | 1.59e-28 | 5.74e-01 | 0.1636 |
| 6747 | SSR3 | GSM4909311 | Human | Breast | IDC | 7.94e-37 | -2.97e-01 | 0.1534 |
| 6747 | SSR3 | GSM4909312 | Human | Breast | IDC | 2.99e-16 | 6.34e-02 | 0.1552 |
| 6747 | SSR3 | GSM4909313 | Human | Breast | IDC | 3.91e-04 | 7.14e-02 | 0.0391 |
| 6747 | SSR3 | GSM4909315 | Human | Breast | IDC | 7.54e-09 | 2.53e-01 | 0.21 |
| 6747 | SSR3 | GSM4909319 | Human | Breast | IDC | 1.02e-52 | -1.71e-01 | 0.1563 |
| 6747 | SSR3 | GSM4909320 | Human | Breast | IDC | 4.91e-04 | -4.30e-01 | 0.1575 |
| 6747 | SSR3 | GSM4909321 | Human | Breast | IDC | 5.80e-17 | -2.66e-01 | 0.1559 |
| 6747 | SSR3 | brca2 | Human | Breast | Precancer | 9.70e-04 | 2.21e-01 | -0.024 |
| 6747 | SSR3 | M2 | Human | Breast | IDC | 2.55e-08 | 3.01e-01 | 0.21 |
| 6747 | SSR3 | NCCBC14 | Human | Breast | DCIS | 6.62e-14 | -1.18e-01 | 0.2021 |
| 6747 | SSR3 | NCCBC2 | Human | Breast | DCIS | 2.56e-07 | 1.75e-01 | 0.1554 |
| Page: 1 2 3 4 5 6 7 8 9 10 11 12 |
| Tissue | Expression Dynamics | Abbreviation |
| Breast | 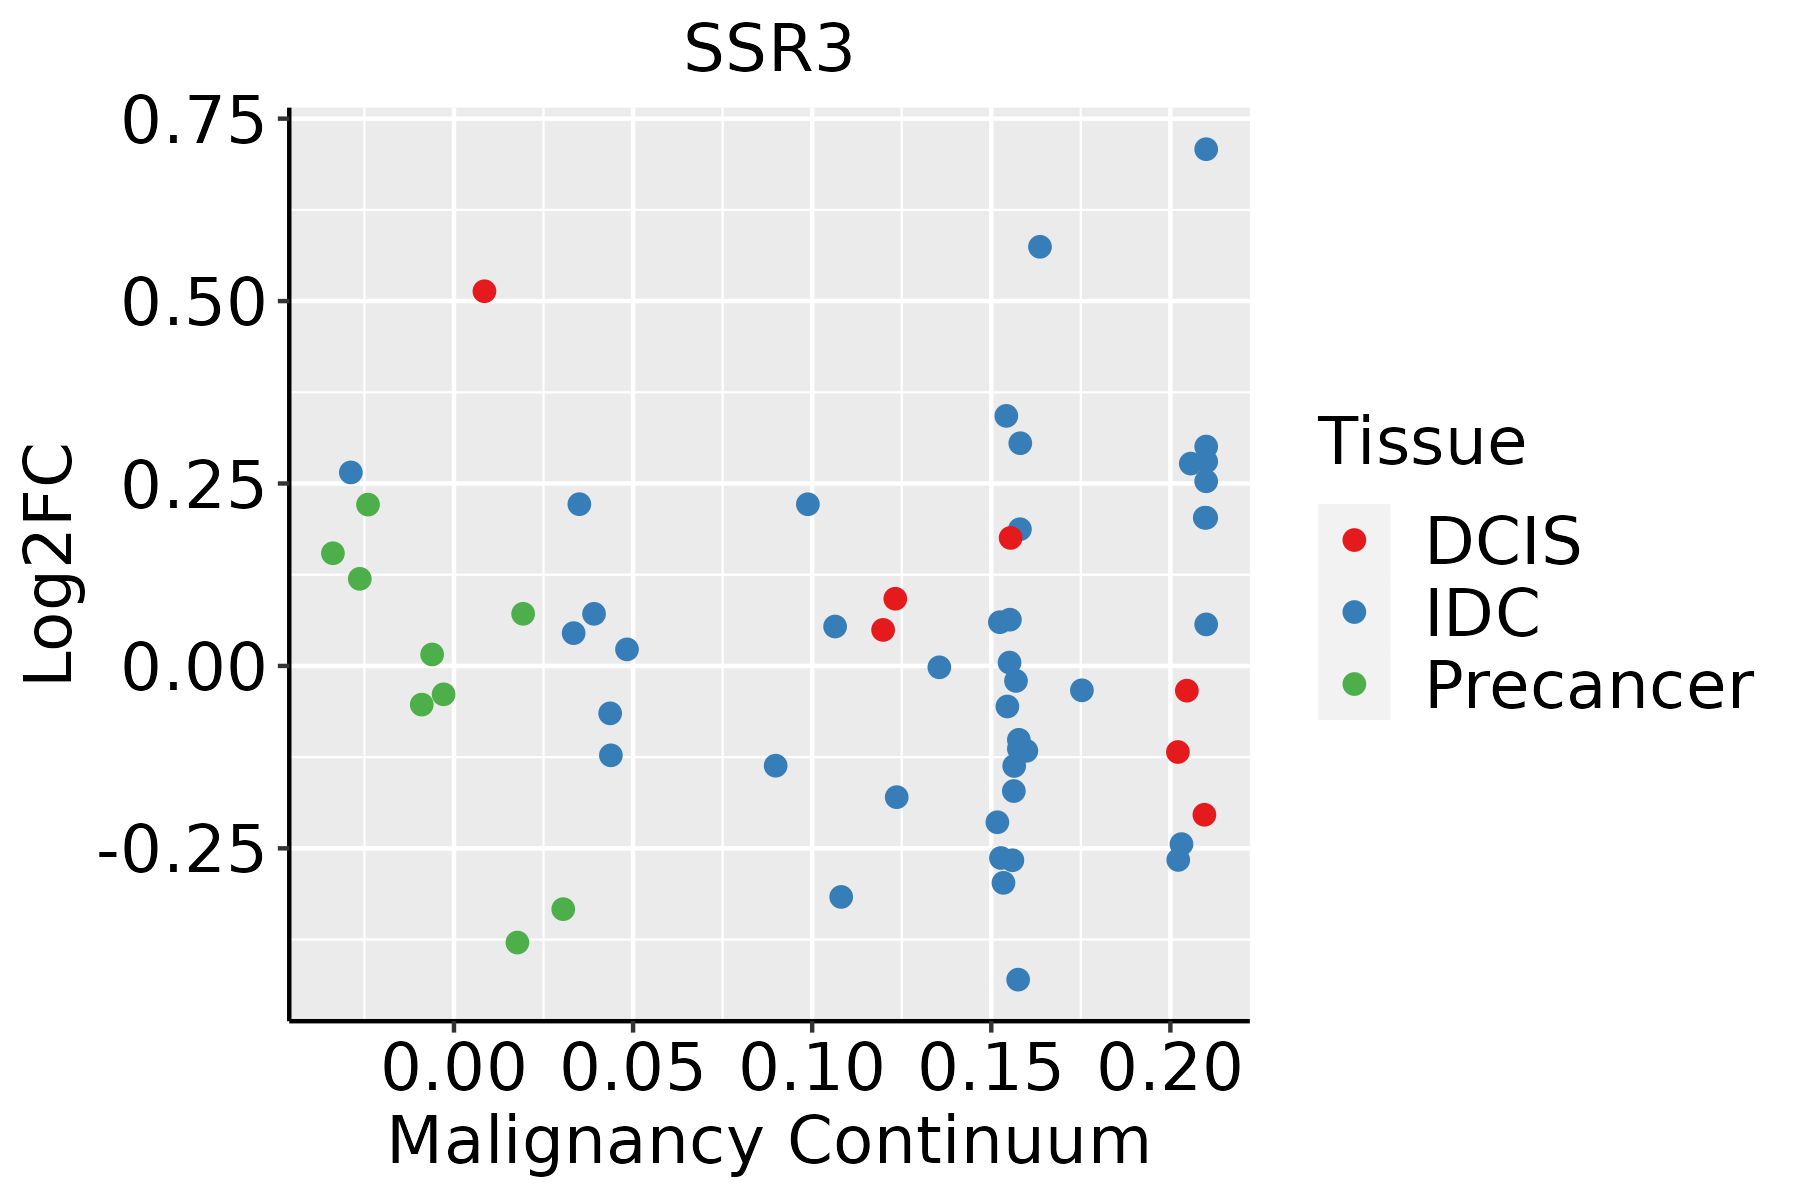 | IDC: Invasive ductal carcinoma |
| DCIS: Ductal carcinoma in situ | ||
| Precancer(BRCA1-mut): Precancerous lesion from BRCA1 mutation carriers | ||
| Cervix |  | CC: Cervix cancer |
| HSIL_HPV: HPV-infected high-grade squamous intraepithelial lesions | ||
| N_HPV: HPV-infected normal cervix | ||
| Colorectum (GSE201348) |  | FAP: Familial adenomatous polyposis |
| CRC: Colorectal cancer | ||
| Colorectum (HTA11) |  | AD: Adenomas |
| SER: Sessile serrated lesions | ||
| MSI-H: Microsatellite-high colorectal cancer | ||
| MSS: Microsatellite stable colorectal cancer | ||
| Endometrium |  | AEH: Atypical endometrial hyperplasia |
| EEC: Endometrioid Cancer | ||
| Esophagus | 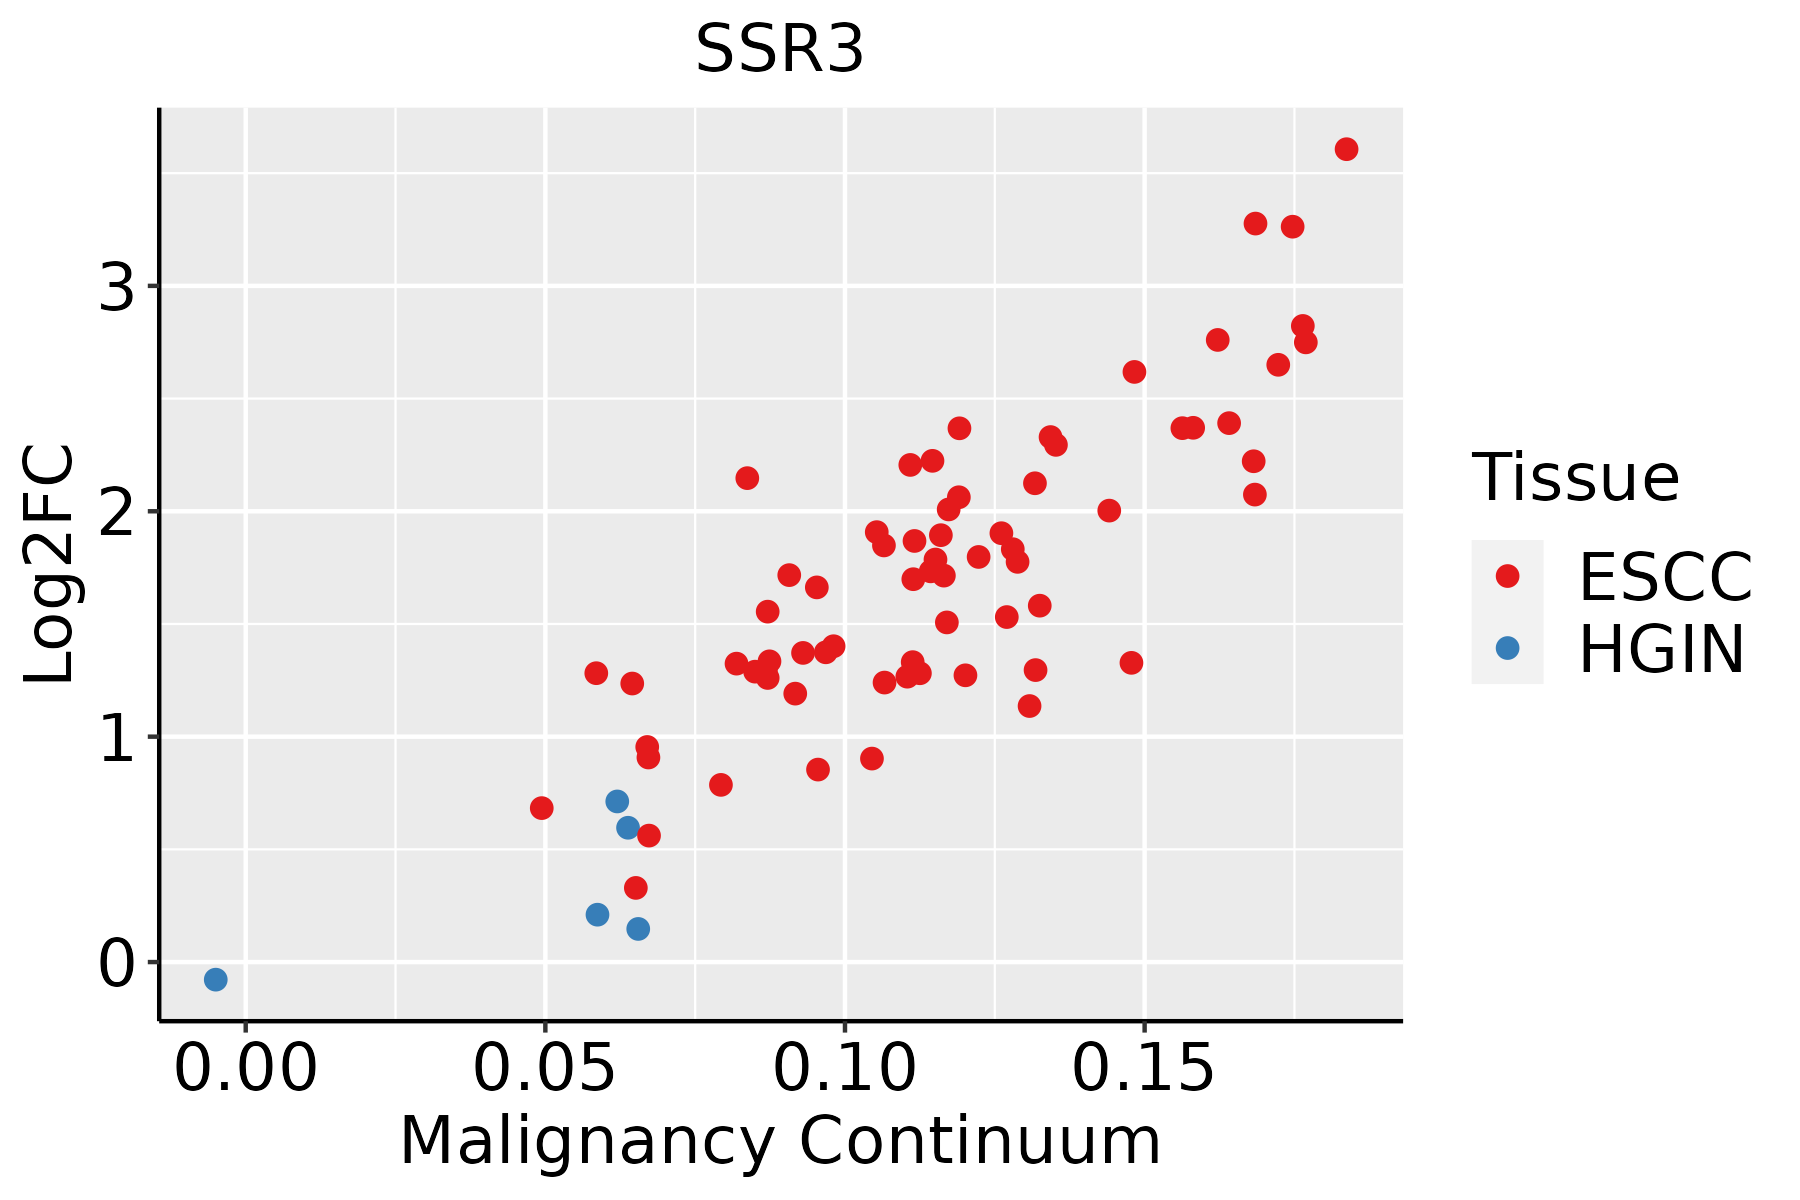 | ESCC: Esophageal squamous cell carcinoma |
| HGIN: High-grade intraepithelial neoplasias | ||
| LGIN: Low-grade intraepithelial neoplasias | ||
| Liver | 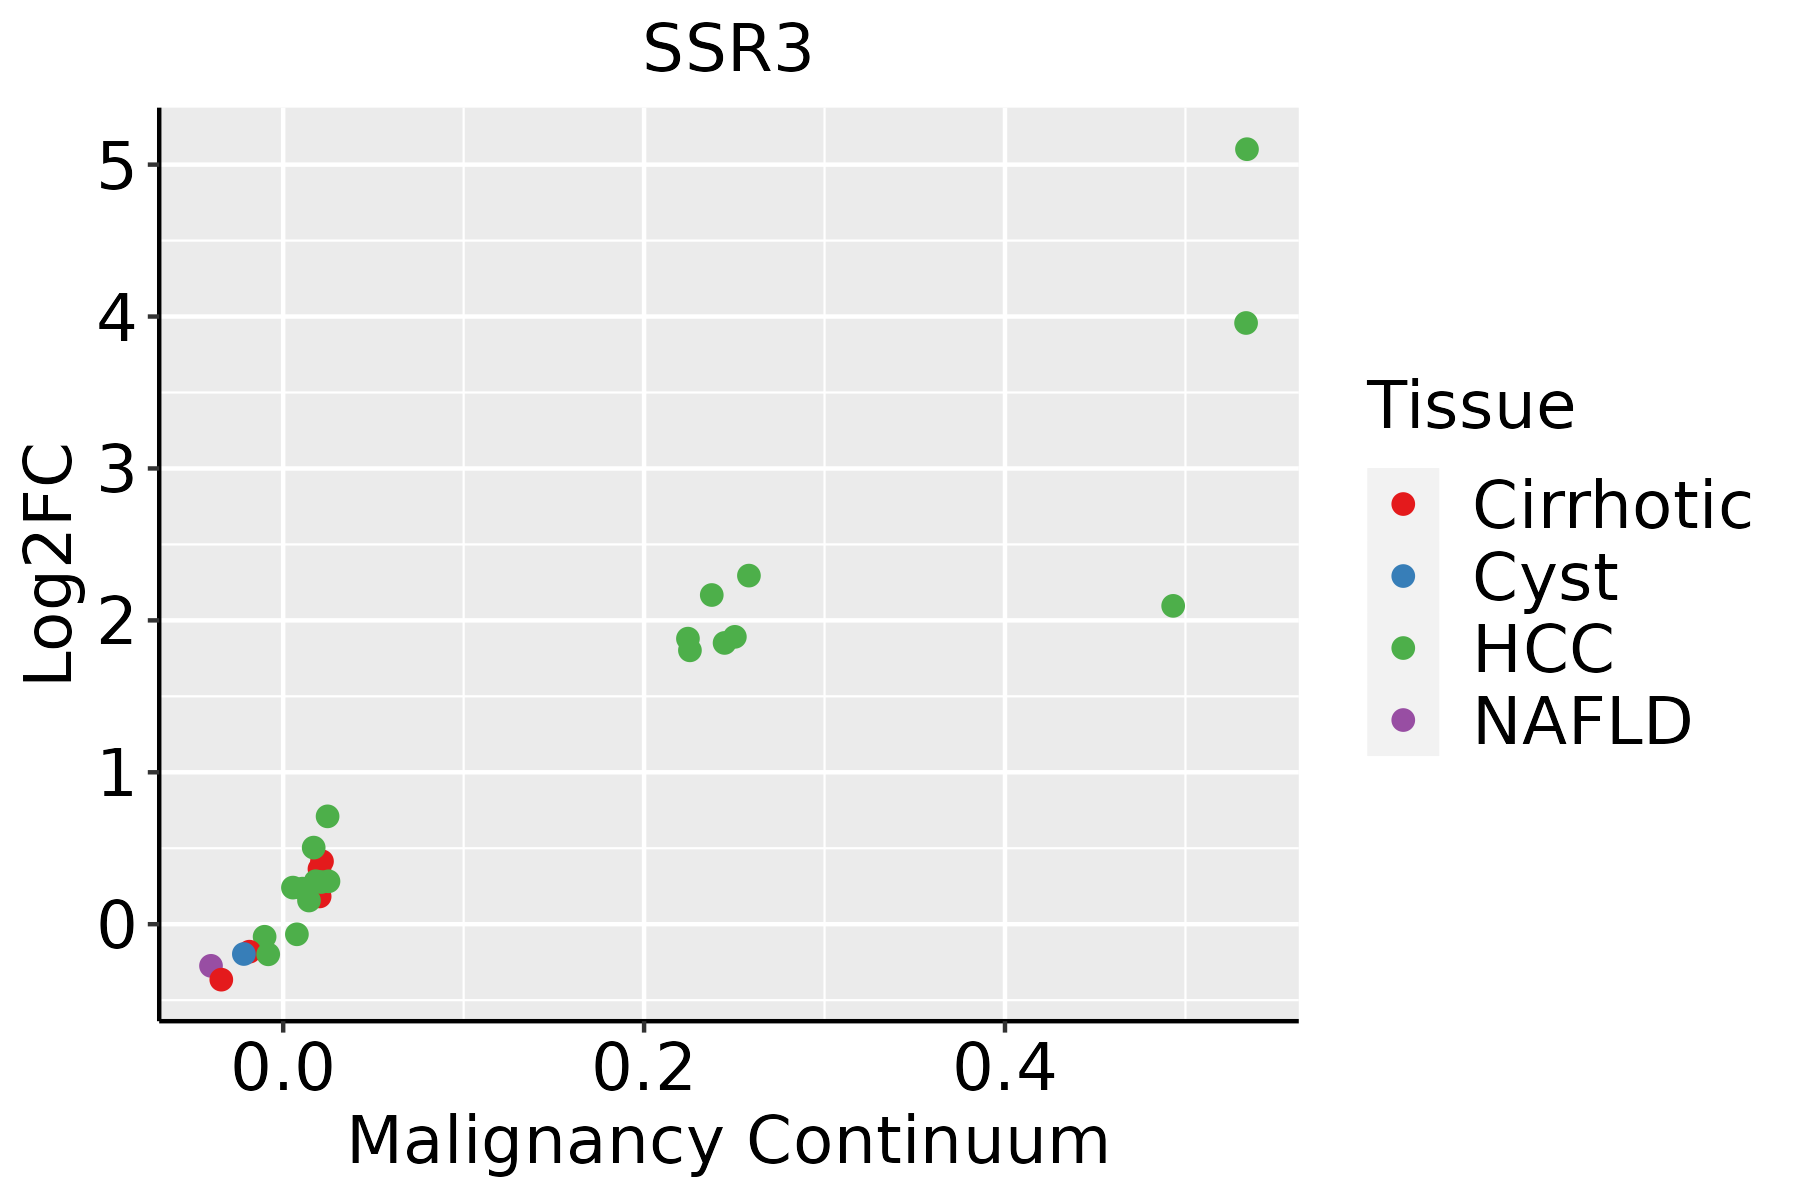 | HCC: Hepatocellular carcinoma |
| NAFLD: Non-alcoholic fatty liver disease | ||
| Oral Cavity | 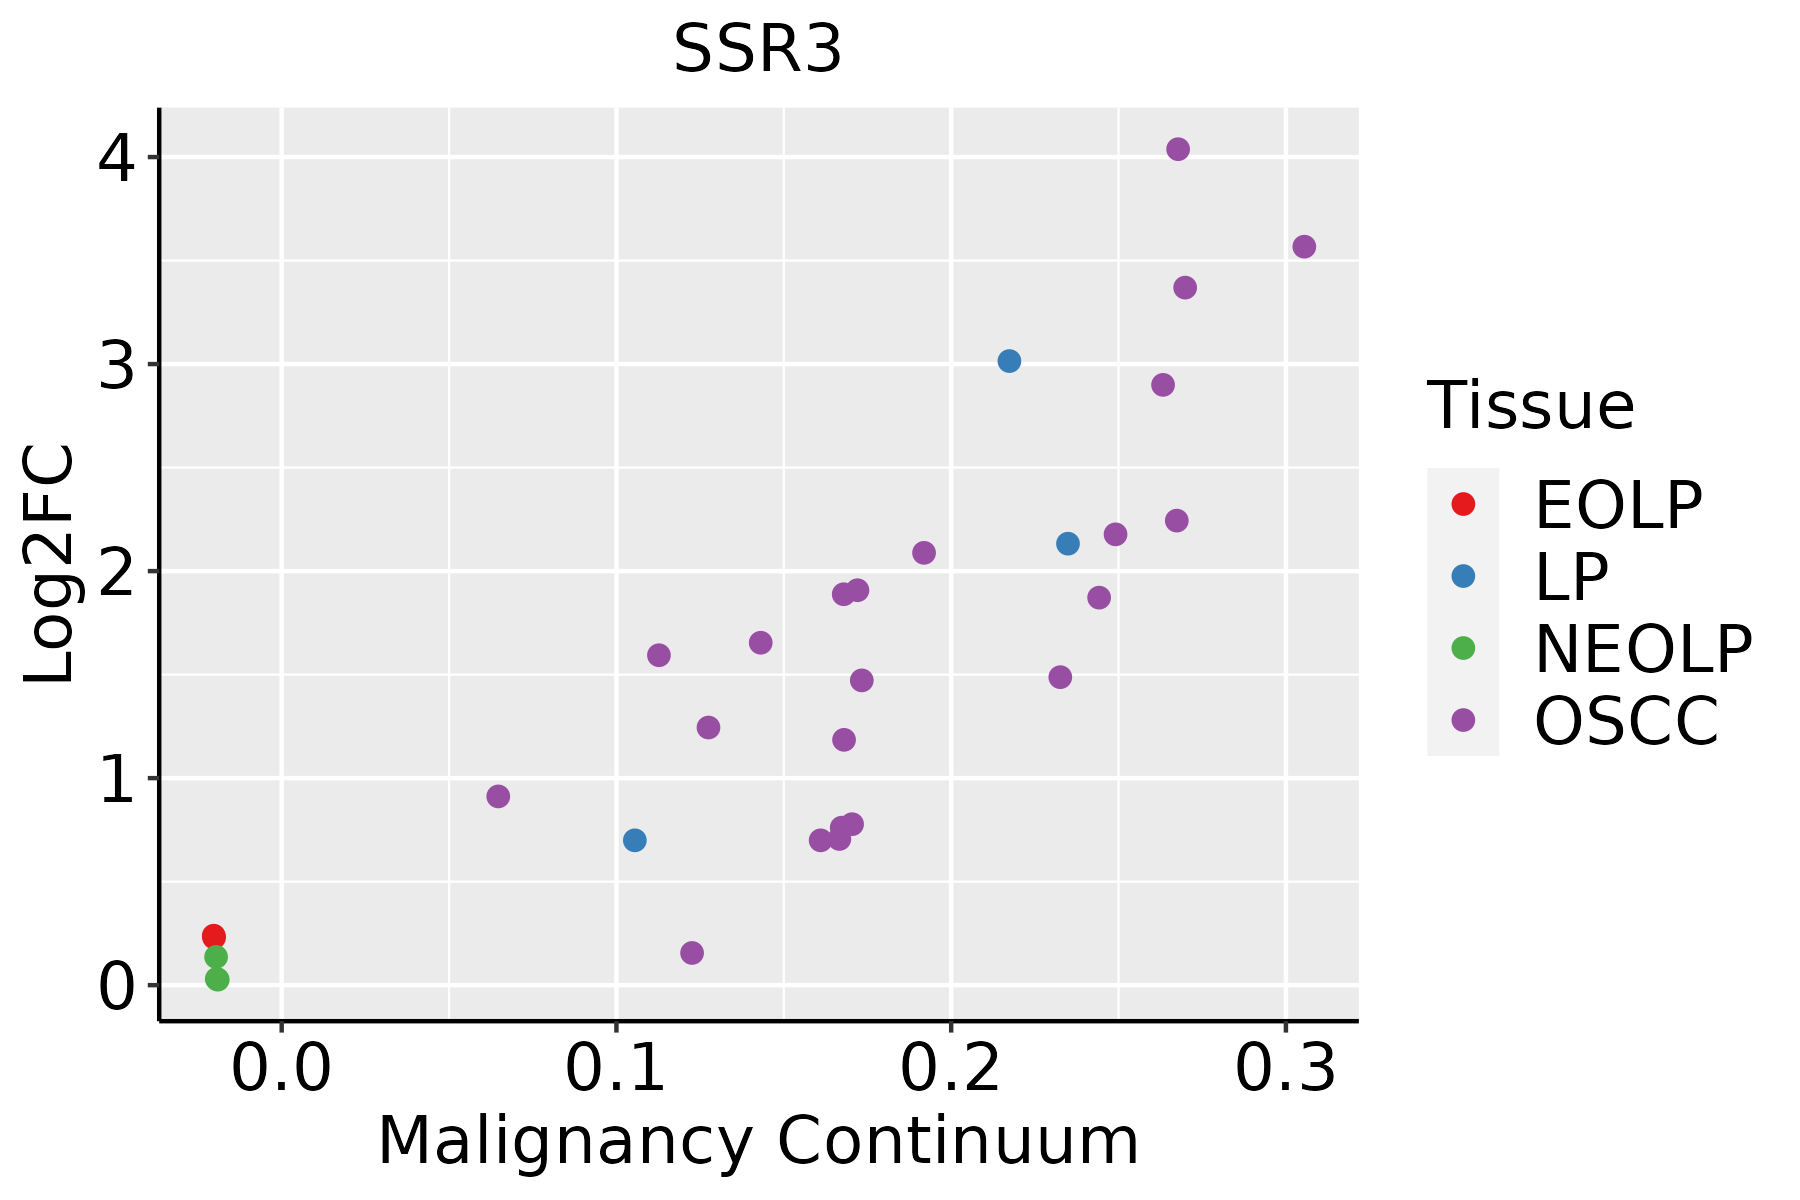 | EOLP: Erosive Oral lichen planus |
| LP: leukoplakia | ||
| NEOLP: Non-erosive oral lichen planus | ||
| OSCC: Oral squamous cell carcinoma | ||
| Prostate | 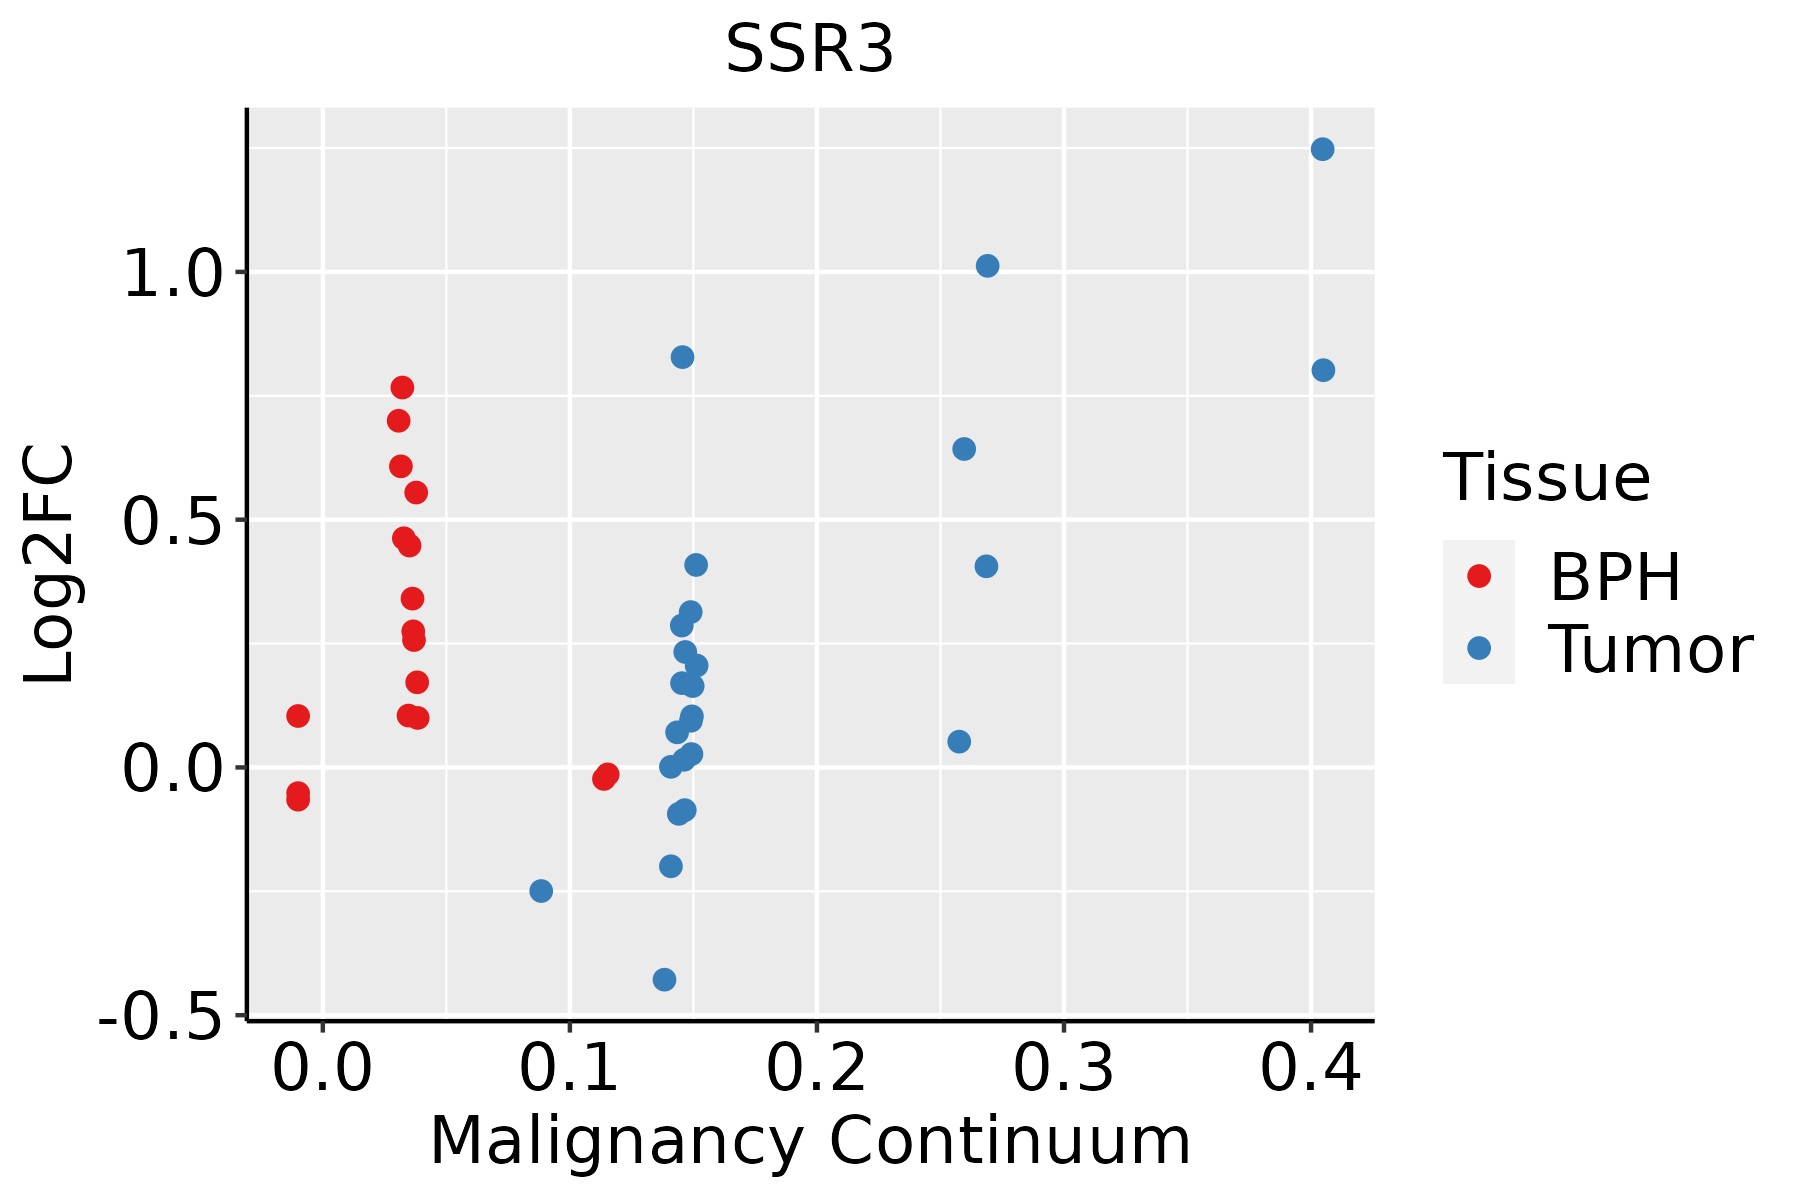 | BPH: Benign Prostatic Hyperplasia |
| Skin |  | AK: Actinic keratosis |
| cSCC: Cutaneous squamous cell carcinoma | ||
| SCCIS:squamous cell carcinoma in situ | ||
| Thyroid | 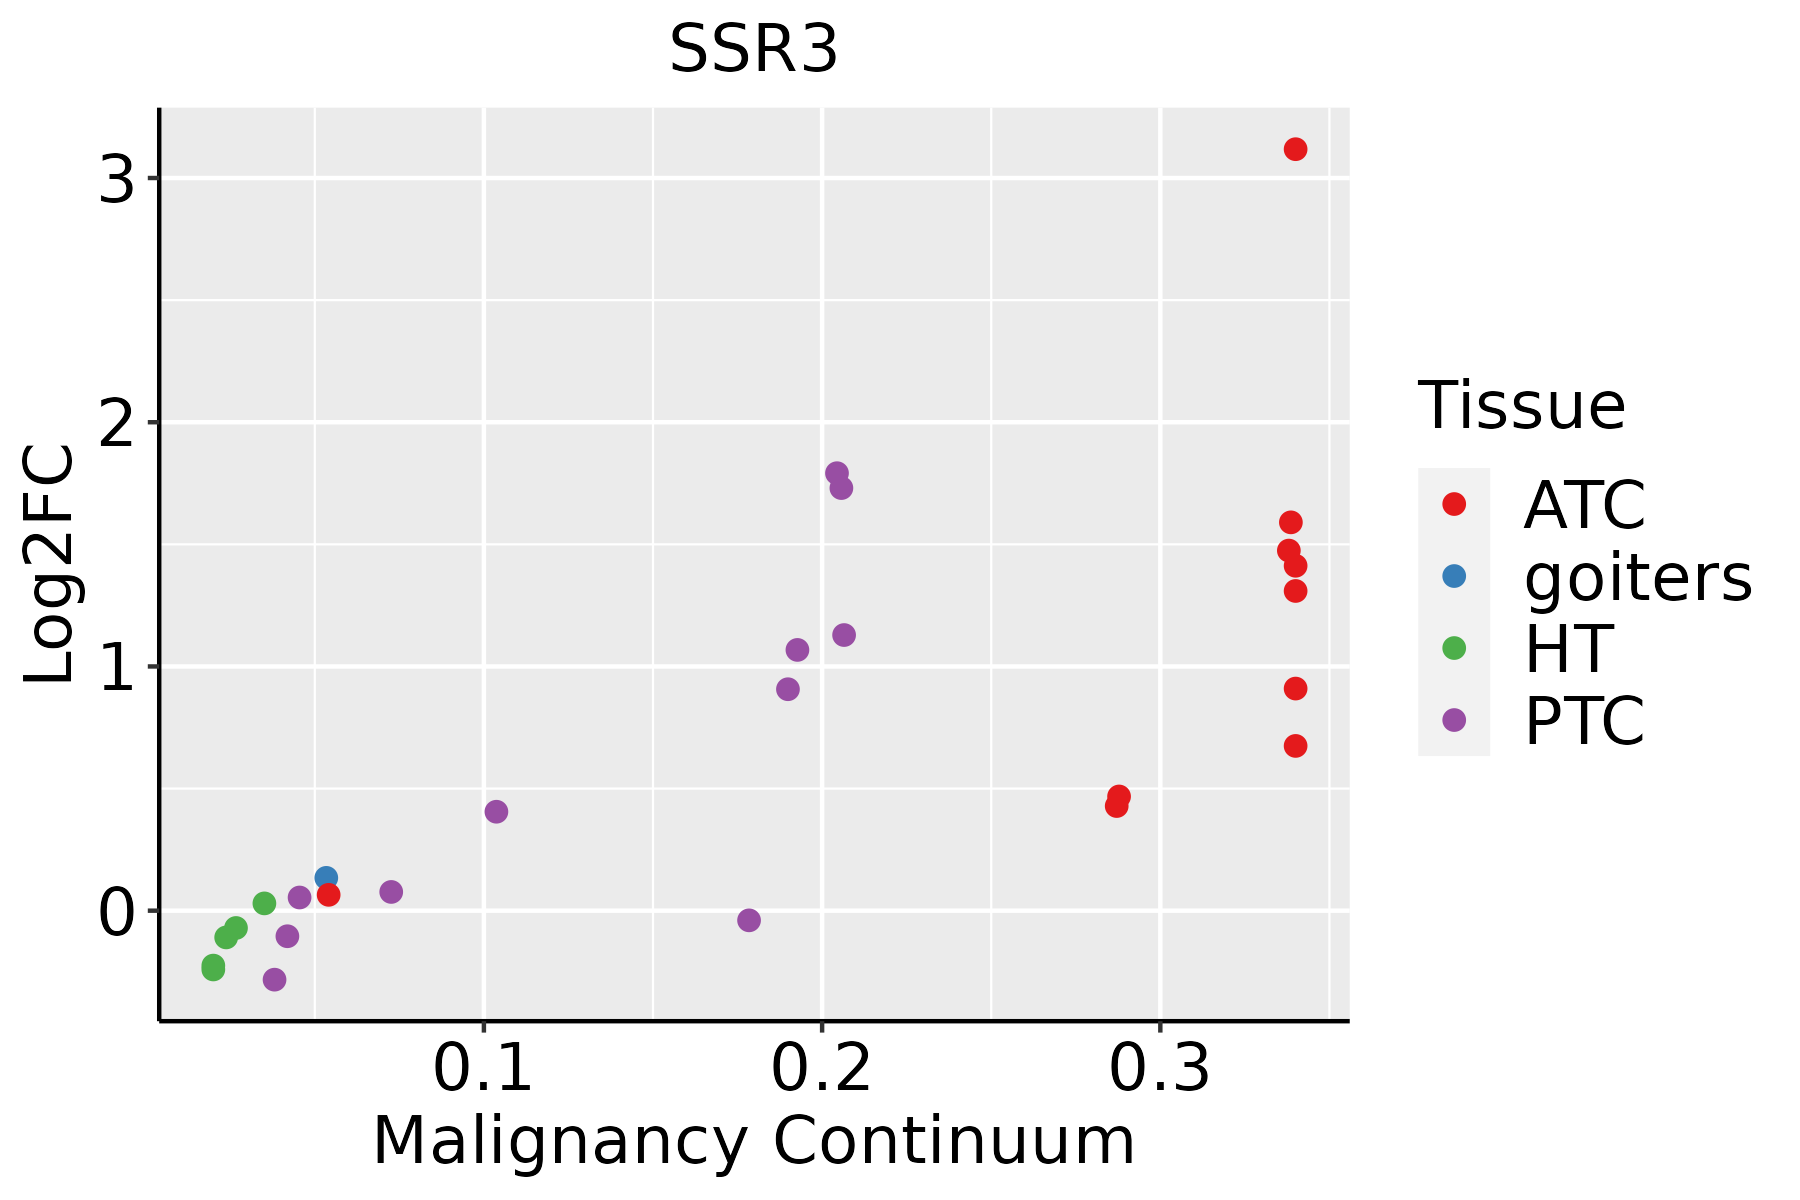 | ATC: Anaplastic thyroid cancer |
| HT: Hashimoto's thyroiditis | ||
| PTC: Papillary thyroid cancer |
| ∗log2FC in expression of this searched gene in stem-like cells from each diseased tissue sample relative to stem-like cells in normal samples in each tissue plotted against the malignancy continuum. Samples are colored based on if they are from different disease stage. |
Top |
Malignant transformation related pathway analysis |
| Find out the enriched GO biological processes and KEGG pathways involved in transition from healthy to precancer to cancer |
| Tissue | Disease Stage | Enriched GO biological Processes |
| Colorectum | AD |  |
| Colorectum | SER |  |
| Colorectum | MSS |  |
| Colorectum | MSI-H |  |
| Colorectum | FAP |  |
| ∗Top 15 enriched GO BP terms are showed in the bar plot of each disease state in each tissue. Each row represents a significant GO biological process which is colored according to the -log10(p.adjust). |
| Page: 1 2 3 4 5 6 7 8 9 |
| GO ID | Tissue | Disease Stage | Description | Gene Ratio | Bg Ratio | pvalue | p.adjust | Count |
| GO:00709725 | Breast | Precancer | protein localization to endoplasmic reticulum | 15/1080 | 74/18723 | 1.74e-05 | 4.17e-04 | 15 |
| GO:00066059 | Breast | Precancer | protein targeting | 33/1080 | 314/18723 | 6.50e-04 | 7.99e-03 | 33 |
| GO:00725948 | Breast | Precancer | establishment of protein localization to organelle | 41/1080 | 422/18723 | 7.75e-04 | 9.20e-03 | 41 |
| GO:007097213 | Breast | IDC | protein localization to endoplasmic reticulum | 18/1434 | 74/18723 | 8.58e-06 | 2.47e-04 | 18 |
| GO:000660514 | Breast | IDC | protein targeting | 43/1434 | 314/18723 | 1.44e-04 | 2.53e-03 | 43 |
| GO:007259413 | Breast | IDC | establishment of protein localization to organelle | 51/1434 | 422/18723 | 7.94e-04 | 9.55e-03 | 51 |
| GO:007097222 | Breast | DCIS | protein localization to endoplasmic reticulum | 18/1390 | 74/18723 | 5.57e-06 | 1.60e-04 | 18 |
| GO:000660523 | Breast | DCIS | protein targeting | 43/1390 | 314/18723 | 7.17e-05 | 1.41e-03 | 43 |
| GO:007259423 | Breast | DCIS | establishment of protein localization to organelle | 51/1390 | 422/18723 | 3.91e-04 | 5.40e-03 | 51 |
| GO:00725949 | Cervix | CC | establishment of protein localization to organelle | 99/2311 | 422/18723 | 1.23e-10 | 2.11e-08 | 99 |
| GO:000660510 | Cervix | CC | protein targeting | 68/2311 | 314/18723 | 2.17e-06 | 6.55e-05 | 68 |
| GO:00901509 | Cervix | CC | establishment of protein localization to membrane | 54/2311 | 260/18723 | 7.67e-05 | 1.05e-03 | 54 |
| GO:00709726 | Cervix | CC | protein localization to endoplasmic reticulum | 21/2311 | 74/18723 | 1.69e-04 | 2.00e-03 | 21 |
| GO:00725995 | Cervix | CC | establishment of protein localization to endoplasmic reticulum | 13/2311 | 46/18723 | 2.95e-03 | 1.94e-02 | 13 |
| GO:0072594 | Colorectum | AD | establishment of protein localization to organelle | 148/3918 | 422/18723 | 7.95e-12 | 1.04e-09 | 148 |
| GO:0090150 | Colorectum | AD | establishment of protein localization to membrane | 100/3918 | 260/18723 | 6.01e-11 | 6.33e-09 | 100 |
| GO:0006605 | Colorectum | AD | protein targeting | 105/3918 | 314/18723 | 1.39e-07 | 6.44e-06 | 105 |
| GO:0070972 | Colorectum | AD | protein localization to endoplasmic reticulum | 26/3918 | 74/18723 | 3.28e-03 | 2.40e-02 | 26 |
| GO:00725941 | Colorectum | SER | establishment of protein localization to organelle | 111/2897 | 422/18723 | 4.98e-09 | 4.49e-07 | 111 |
| GO:00901501 | Colorectum | SER | establishment of protein localization to membrane | 68/2897 | 260/18723 | 5.55e-06 | 2.01e-04 | 68 |
| Page: 1 2 3 4 5 6 7 |
| Pathway ID | Tissue | Disease Stage | Description | Gene Ratio | Bg Ratio | pvalue | p.adjust | qvalue | Count |
| hsa0414118 | Breast | Precancer | Protein processing in endoplasmic reticulum | 33/684 | 174/8465 | 2.78e-06 | 3.83e-05 | 2.94e-05 | 33 |
| hsa0414119 | Breast | Precancer | Protein processing in endoplasmic reticulum | 33/684 | 174/8465 | 2.78e-06 | 3.83e-05 | 2.94e-05 | 33 |
| hsa0414124 | Breast | IDC | Protein processing in endoplasmic reticulum | 36/867 | 174/8465 | 2.73e-05 | 2.86e-04 | 2.14e-04 | 36 |
| hsa0414134 | Breast | IDC | Protein processing in endoplasmic reticulum | 36/867 | 174/8465 | 2.73e-05 | 2.86e-04 | 2.14e-04 | 36 |
| hsa0414143 | Breast | DCIS | Protein processing in endoplasmic reticulum | 36/846 | 174/8465 | 1.60e-05 | 1.91e-04 | 1.41e-04 | 36 |
| hsa0414153 | Breast | DCIS | Protein processing in endoplasmic reticulum | 36/846 | 174/8465 | 1.60e-05 | 1.91e-04 | 1.41e-04 | 36 |
| hsa0414120 | Cervix | CC | Protein processing in endoplasmic reticulum | 55/1267 | 174/8465 | 1.74e-08 | 2.68e-07 | 1.58e-07 | 55 |
| hsa04141110 | Cervix | CC | Protein processing in endoplasmic reticulum | 55/1267 | 174/8465 | 1.74e-08 | 2.68e-07 | 1.58e-07 | 55 |
| hsa04141 | Colorectum | AD | Protein processing in endoplasmic reticulum | 80/2092 | 174/8465 | 5.96e-10 | 1.25e-08 | 7.96e-09 | 80 |
| hsa041411 | Colorectum | AD | Protein processing in endoplasmic reticulum | 80/2092 | 174/8465 | 5.96e-10 | 1.25e-08 | 7.96e-09 | 80 |
| hsa041412 | Colorectum | SER | Protein processing in endoplasmic reticulum | 60/1580 | 174/8465 | 4.20e-07 | 7.33e-06 | 5.32e-06 | 60 |
| hsa041413 | Colorectum | SER | Protein processing in endoplasmic reticulum | 60/1580 | 174/8465 | 4.20e-07 | 7.33e-06 | 5.32e-06 | 60 |
| hsa041414 | Colorectum | MSS | Protein processing in endoplasmic reticulum | 75/1875 | 174/8465 | 3.78e-10 | 8.44e-09 | 5.17e-09 | 75 |
| hsa041415 | Colorectum | MSS | Protein processing in endoplasmic reticulum | 75/1875 | 174/8465 | 3.78e-10 | 8.44e-09 | 5.17e-09 | 75 |
| hsa041416 | Colorectum | MSI-H | Protein processing in endoplasmic reticulum | 46/797 | 174/8465 | 4.53e-11 | 9.78e-10 | 8.19e-10 | 46 |
| hsa041417 | Colorectum | MSI-H | Protein processing in endoplasmic reticulum | 46/797 | 174/8465 | 4.53e-11 | 9.78e-10 | 8.19e-10 | 46 |
| hsa0414126 | Endometrium | AEH | Protein processing in endoplasmic reticulum | 62/1197 | 174/8465 | 5.97e-13 | 1.39e-11 | 1.01e-11 | 62 |
| hsa04141111 | Endometrium | AEH | Protein processing in endoplasmic reticulum | 62/1197 | 174/8465 | 5.97e-13 | 1.39e-11 | 1.01e-11 | 62 |
| hsa0414127 | Endometrium | EEC | Protein processing in endoplasmic reticulum | 64/1237 | 174/8465 | 2.17e-13 | 5.09e-12 | 3.80e-12 | 64 |
| hsa0414136 | Endometrium | EEC | Protein processing in endoplasmic reticulum | 64/1237 | 174/8465 | 2.17e-13 | 5.09e-12 | 3.80e-12 | 64 |
| Page: 1 2 |
Top |
Cell-cell communication analysis |
| Identification of potential cell-cell interactions between two cell types and their ligand-receptor pairs for different disease states |
| Ligand | Receptor | LRpair | Pathway | Tissue | Disease Stage |
| Page: 1 |
Top |
Single-cell gene regulatory network inference analysis |
| Find out the significant the regulons (TFs) and the target genes of each regulon across cell types for different disease states |
| TF | Cell Type | Tissue | Disease Stage | Target Gene | RSS | Regulon Activity |
| ∗The dot plots of a searched regulon are shown for all cell subpopulations in each disease state of each tissue based on the regulon specific score inferred using pySCENIC and by calculating the average expression. |
| Page: 1 |
Top |
Somatic mutation of malignant transformation related genes |
| Annotation of somatic variants for genes involved in malignant transformation |
| Hugo Symbol | Variant Class | Variant Classification | dbSNP RS | HGVSc | HGVSp | HGVSp Short | SWISSPROT | BIOTYPE | SIFT | PolyPhen | Tumor Sample Barcode | Tissue | Histology | Sex | Age | Stage | Therapy Types | Drugs | Outcome |
| SSR3 | SNV | Missense_Mutation | rs148305354 | c.305N>A | p.Arg102Gln | p.R102Q | Q9UNL2 | protein_coding | tolerated(0.26) | benign(0.024) | TCGA-AN-A046-01 | Breast | breast invasive carcinoma | Female | >=65 | I/II | Unknown | Unknown | SD |
| SSR3 | SNV | Missense_Mutation | c.230N>G | p.Tyr77Cys | p.Y77C | Q9UNL2 | protein_coding | tolerated(0.12) | probably_damaging(1) | TCGA-C5-A1BN-01 | Cervix | cervical & endocervical cancer | Female | <65 | I/II | Chemotherapy | cisplatin | PD | |
| SSR3 | SNV | Missense_Mutation | rs778705186 | c.167T>C | p.Ile56Thr | p.I56T | Q9UNL2 | protein_coding | tolerated(0.34) | benign(0.005) | TCGA-EA-A1QS-01 | Cervix | cervical & endocervical cancer | Female | <65 | I/II | Unknown | Unknown | SD |
| SSR3 | SNV | Missense_Mutation | rs758900330 | c.571N>A | p.Ala191Thr | p.A191T | Q9UNL2 | protein_coding | deleterious(0.02) | probably_damaging(0.993) | TCGA-VS-A94Z-01 | Cervix | cervical & endocervical cancer | Female | <65 | I/II | Chemotherapy | cisplatin | CR |
| SSR3 | SNV | Missense_Mutation | c.234N>T | p.Lys78Asn | p.K78N | Q9UNL2 | protein_coding | deleterious(0.05) | probably_damaging(0.932) | TCGA-AA-3510-01 | Colorectum | colon adenocarcinoma | Male | >=65 | I/II | Unknown | Unknown | SD | |
| SSR3 | SNV | Missense_Mutation | c.113N>C | p.Ile38Thr | p.I38T | Q9UNL2 | protein_coding | deleterious(0) | benign(0.338) | TCGA-G4-6628-01 | Colorectum | colon adenocarcinoma | Male | >=65 | I/II | Unknown | Unknown | SD | |
| SSR3 | SNV | Missense_Mutation | rs779736180 | c.341N>A | p.Arg114Gln | p.R114Q | Q9UNL2 | protein_coding | tolerated(0.17) | possibly_damaging(0.859) | TCGA-NH-A5IV-01 | Colorectum | colon adenocarcinoma | Female | >=65 | I/II | Unknown | Unknown | SD |
| SSR3 | SNV | Missense_Mutation | rs772542660 | c.146N>A | p.Arg49Gln | p.R49Q | Q9UNL2 | protein_coding | tolerated(0.06) | benign(0.26) | TCGA-EI-6917-01 | Colorectum | rectum adenocarcinoma | Male | <65 | III/IV | Chemotherapy | 5fluorouracil+oxaciplatina+l-folinian | SD |
| SSR3 | SNV | Missense_Mutation | rs758900330 | c.571N>A | p.Ala191Thr | p.A191T | Q9UNL2 | protein_coding | deleterious(0.02) | probably_damaging(0.993) | TCGA-A5-A0G1-01 | Endometrium | uterine corpus endometrioid carcinoma | Female | >=65 | I/II | Unknown | Unknown | SD |
| SSR3 | SNV | Missense_Mutation | novel | c.5N>T | p.Ala2Val | p.A2V | Q9UNL2 | protein_coding | tolerated_low_confidence(0.06) | possibly_damaging(0.493) | TCGA-AP-A1DV-01 | Endometrium | uterine corpus endometrioid carcinoma | Female | <65 | I/II | Unknown | Unknown | SD |
| Page: 1 2 3 |
Top |
Related drugs of malignant transformation related genes |
| Identification of chemicals and drugs interact with genes involved in malignant transfromation |
| (DGIdb 4.0) |
| Entrez ID | Symbol | Category | Interaction Types | Drug Claim Name | Drug Name | PMIDs |
| Page: 1 |

Copyright 2023-Present -The University of Texas Health Science Center at Houston |