
|
|||||
|
 | |
| |
| |
| |
| |
| |
|
Gene: SSR1 |
Gene summary for SSR1 |
| Gene information | Species | Human | Gene symbol | SSR1 | Gene ID | 6745 |
| Gene name | signal sequence receptor subunit 1 | |
| Gene Alias | TRAPA | |
| Cytomap | 6p24.3 | |
| Gene Type | protein-coding | GO ID | GO:0006605 | UniProtAcc | C9JBX5 |
Top |
Malignant transformation analysis |
| Identification of the aberrant gene expression in precancerous and cancerous lesions by comparing the gene expression of stem-like cells in diseased tissues with normal stem cells |
| Entrez ID | Symbol | Replicates | Species | Organ | Tissue | Adj P-value | Log2FC | Malignancy |
| 6745 | SSR1 | HTA11_347_2000001011 | Human | Colorectum | AD | 5.42e-13 | 5.25e-01 | -0.1954 |
| 6745 | SSR1 | HTA11_99999970781_79442 | Human | Colorectum | MSS | 9.42e-10 | 5.32e-01 | 0.294 |
| 6745 | SSR1 | HTA11_99999965062_69753 | Human | Colorectum | MSI-H | 3.58e-08 | 1.46e+00 | 0.3487 |
| 6745 | SSR1 | HTA11_99999965104_69814 | Human | Colorectum | MSS | 2.50e-15 | 9.04e-01 | 0.281 |
| 6745 | SSR1 | HTA11_99999971662_82457 | Human | Colorectum | MSS | 3.32e-17 | 7.34e-01 | 0.3859 |
| 6745 | SSR1 | A015-C-203 | Human | Colorectum | FAP | 9.49e-05 | -1.18e-01 | -0.1294 |
| 6745 | SSR1 | A001-C-108 | Human | Colorectum | FAP | 3.62e-03 | -1.12e-01 | -0.0272 |
| 6745 | SSR1 | A015-C-104 | Human | Colorectum | FAP | 1.27e-06 | -1.46e-01 | -0.1899 |
| 6745 | SSR1 | A001-C-203 | Human | Colorectum | FAP | 3.11e-02 | -1.52e-01 | -0.0481 |
| 6745 | SSR1 | A002-C-116 | Human | Colorectum | FAP | 4.51e-04 | -9.56e-02 | -0.0452 |
| 6745 | SSR1 | A014-C-008 | Human | Colorectum | FAP | 2.25e-02 | -2.18e-01 | -0.191 |
| 6745 | SSR1 | AEH-subject1 | Human | Endometrium | AEH | 7.57e-11 | -3.36e-01 | -0.3059 |
| 6745 | SSR1 | AEH-subject2 | Human | Endometrium | AEH | 2.62e-10 | -3.30e-01 | -0.2525 |
| 6745 | SSR1 | AEH-subject3 | Human | Endometrium | AEH | 1.82e-11 | -3.55e-01 | -0.2576 |
| 6745 | SSR1 | AEH-subject4 | Human | Endometrium | AEH | 1.96e-09 | -2.87e-01 | -0.2657 |
| 6745 | SSR1 | AEH-subject5 | Human | Endometrium | AEH | 1.25e-03 | -2.27e-01 | -0.2953 |
| 6745 | SSR1 | EEC-subject1 | Human | Endometrium | EEC | 2.01e-11 | -3.24e-01 | -0.2682 |
| 6745 | SSR1 | EEC-subject2 | Human | Endometrium | EEC | 1.05e-17 | -4.03e-01 | -0.2607 |
| 6745 | SSR1 | EEC-subject3 | Human | Endometrium | EEC | 2.13e-29 | -3.98e-01 | -0.2525 |
| 6745 | SSR1 | EEC-subject4 | Human | Endometrium | EEC | 8.09e-04 | -2.86e-01 | -0.2571 |
| Page: 1 2 3 4 5 6 7 8 9 |
| Tissue | Expression Dynamics | Abbreviation |
| Colorectum (GSE201348) | 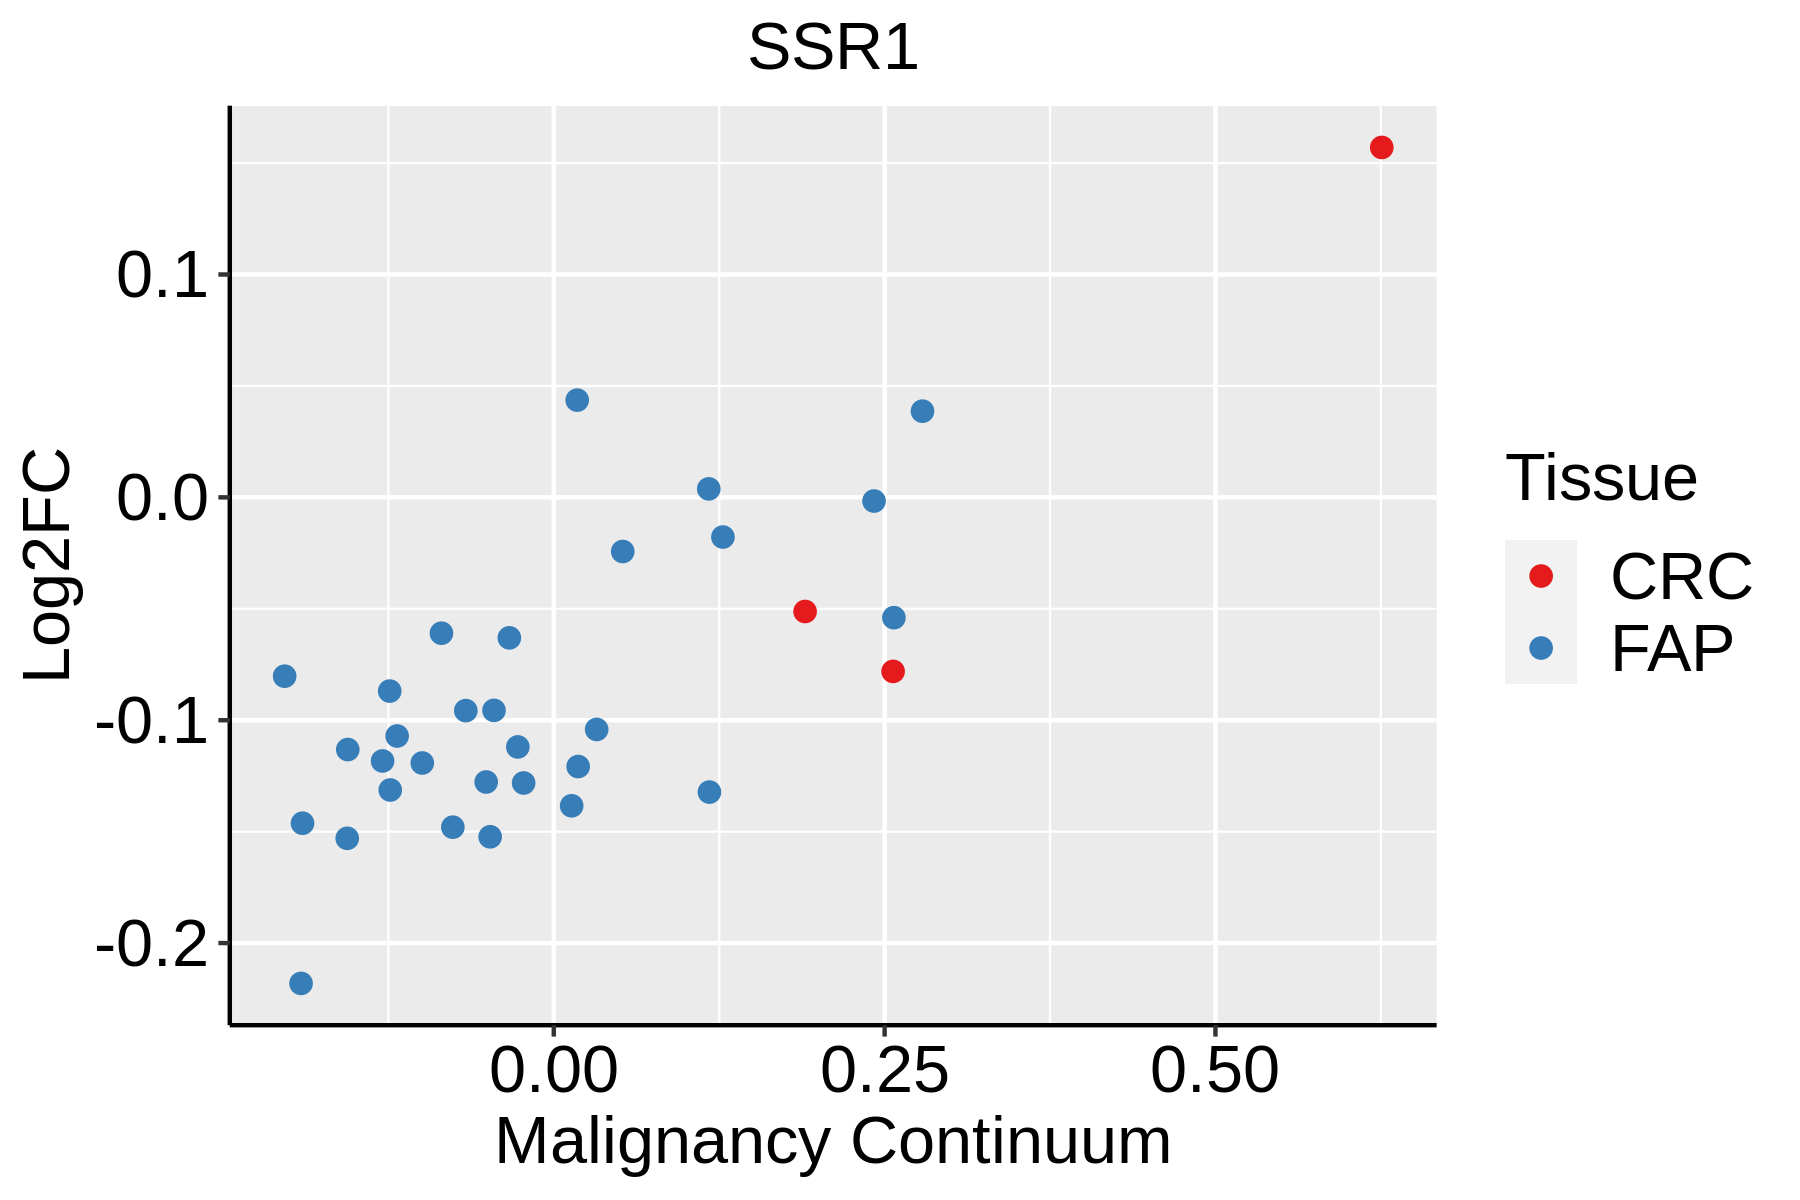 | FAP: Familial adenomatous polyposis |
| CRC: Colorectal cancer | ||
| Colorectum (HTA11) |  | AD: Adenomas |
| SER: Sessile serrated lesions | ||
| MSI-H: Microsatellite-high colorectal cancer | ||
| MSS: Microsatellite stable colorectal cancer | ||
| Endometrium | 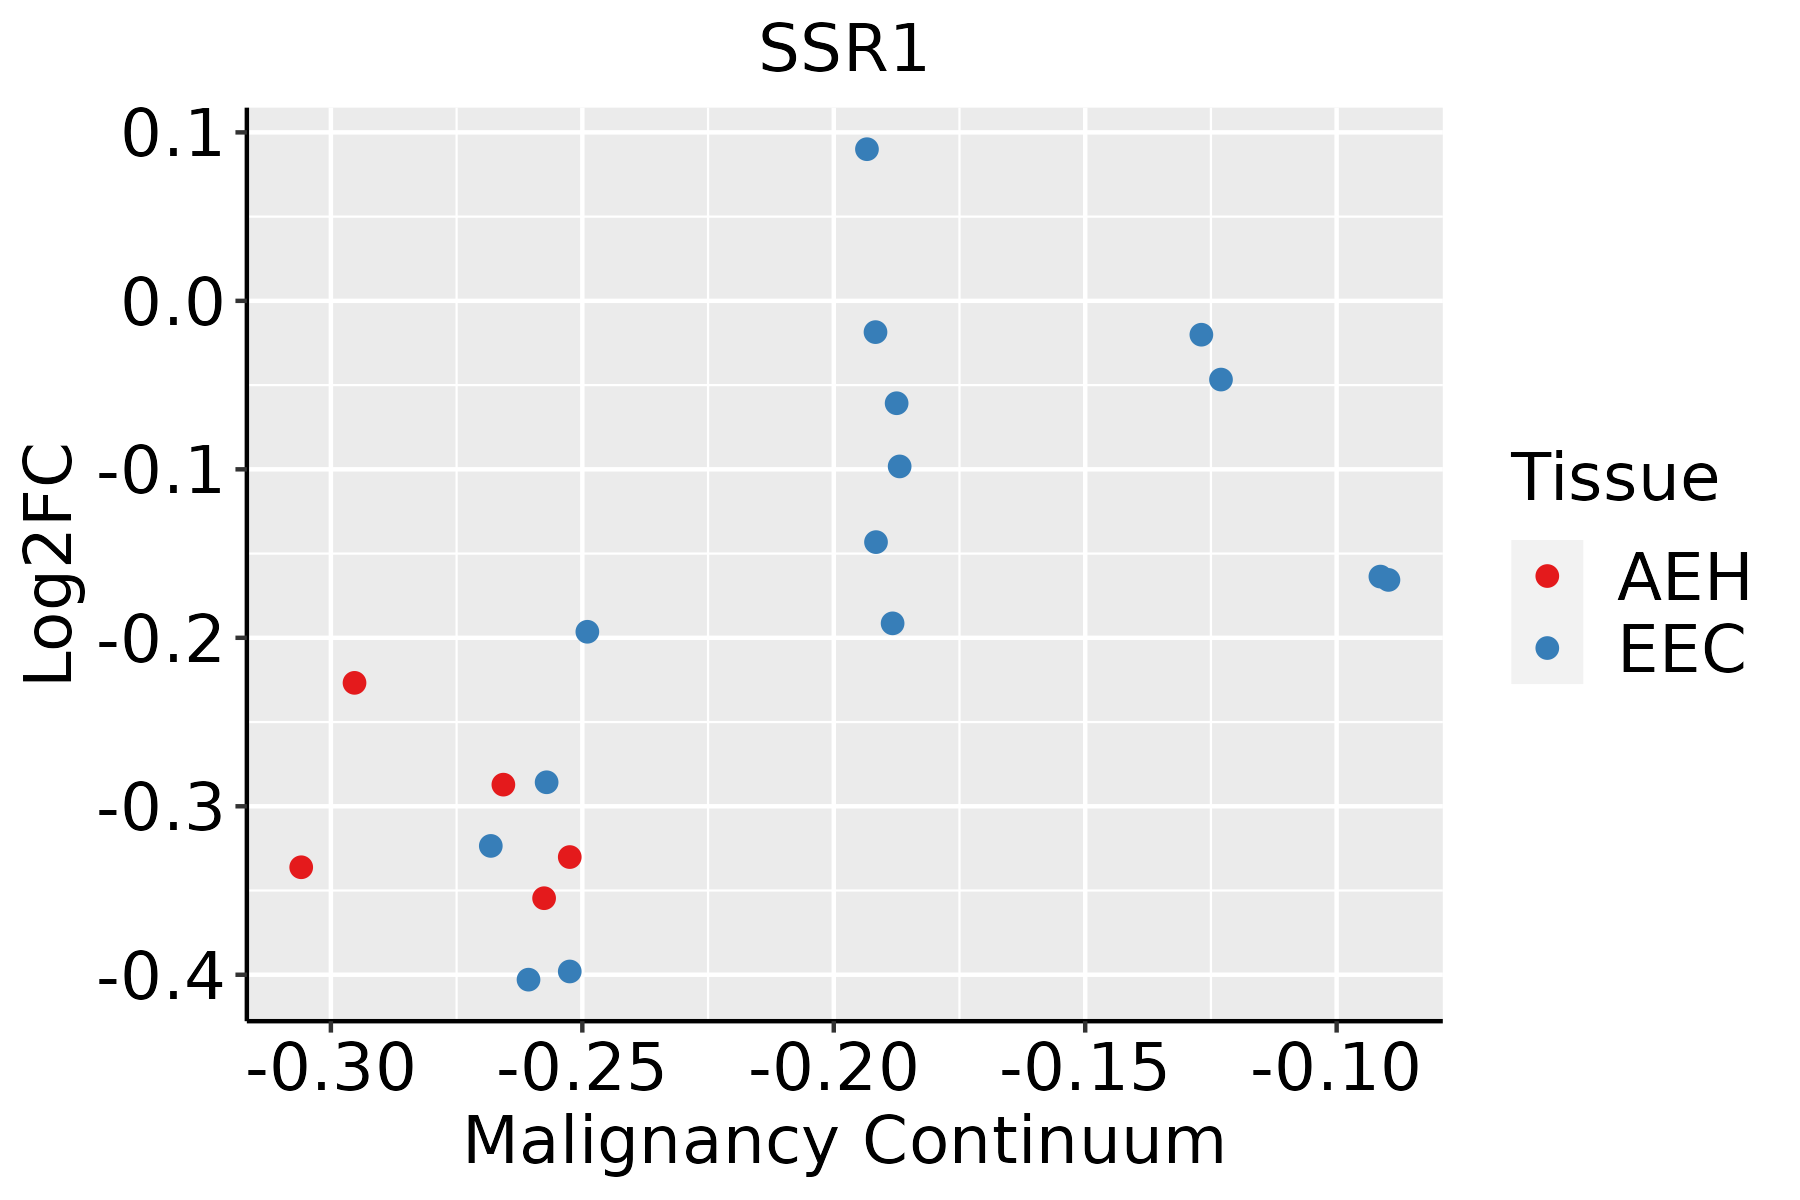 | AEH: Atypical endometrial hyperplasia |
| EEC: Endometrioid Cancer | ||
| Esophagus | 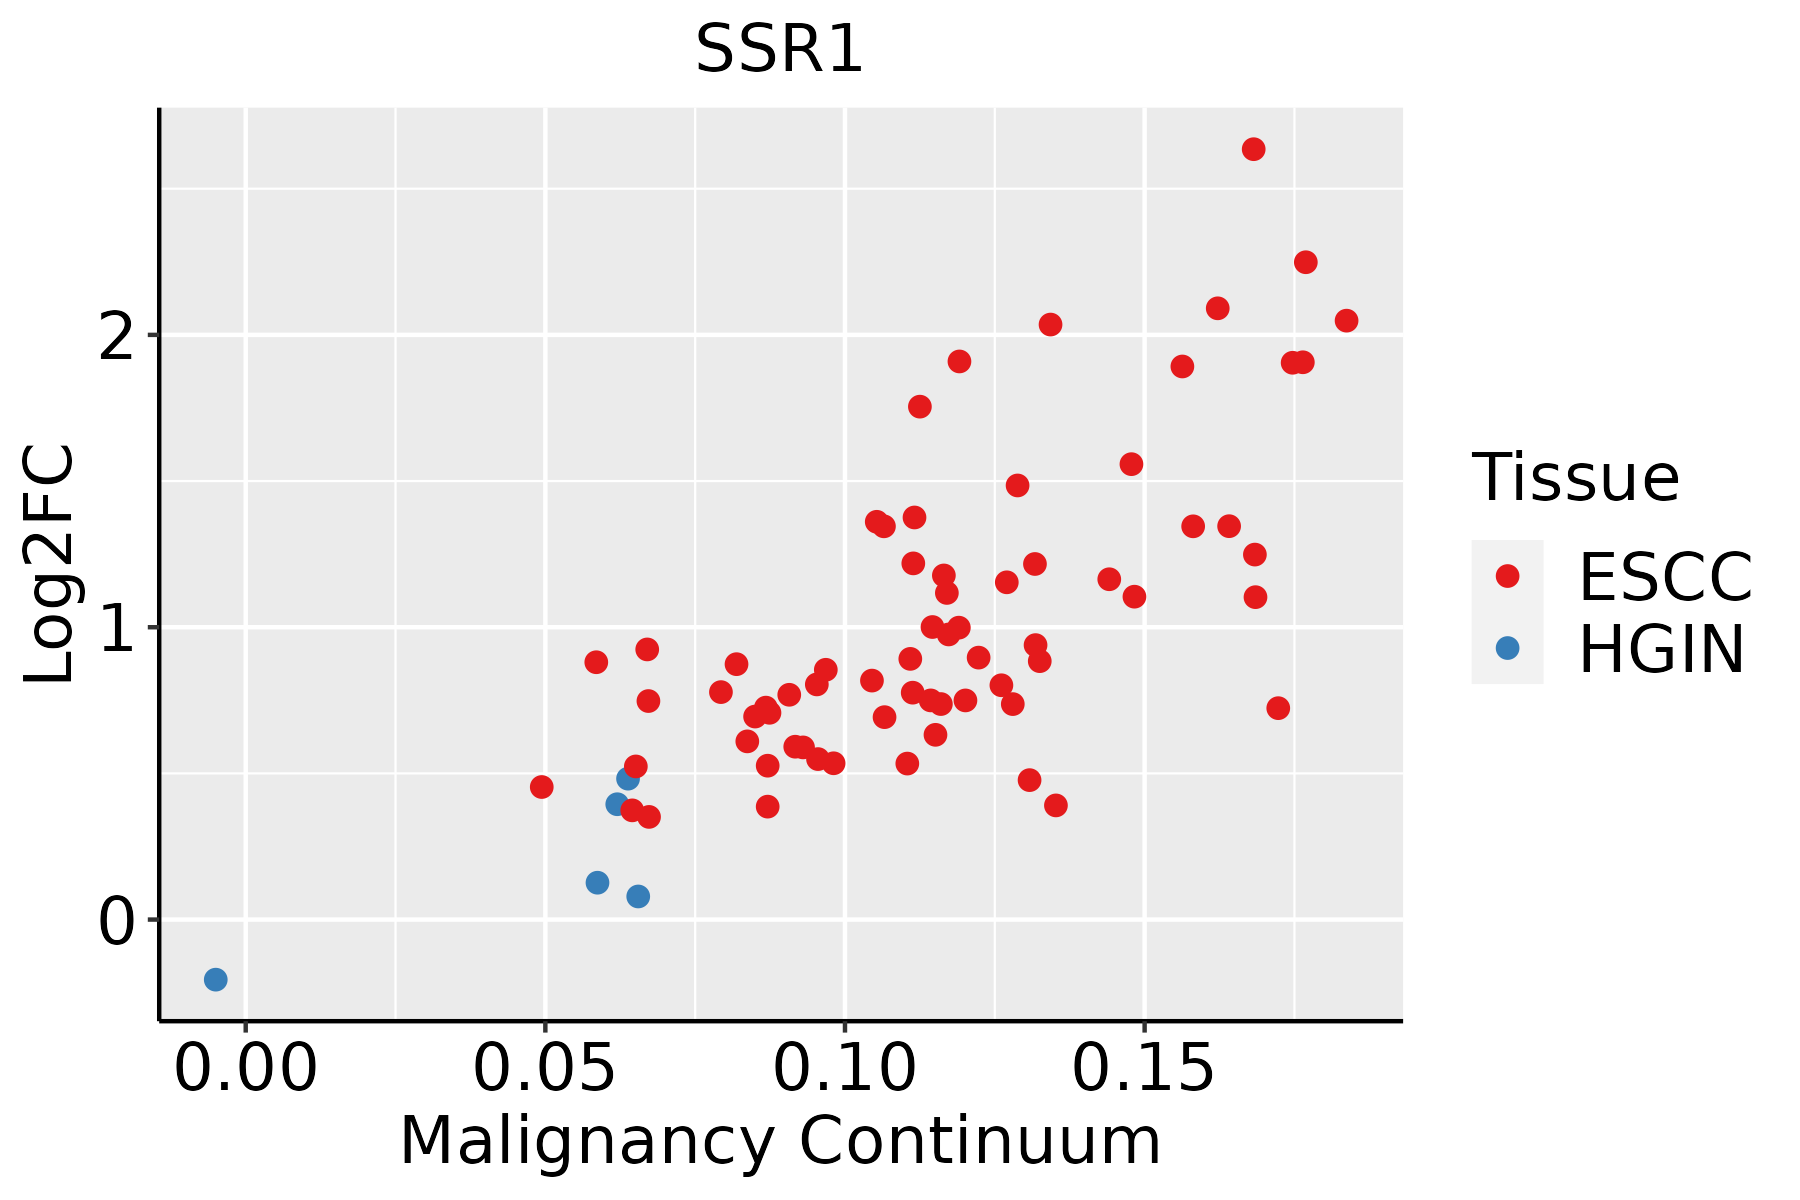 | ESCC: Esophageal squamous cell carcinoma |
| HGIN: High-grade intraepithelial neoplasias | ||
| LGIN: Low-grade intraepithelial neoplasias | ||
| Liver | 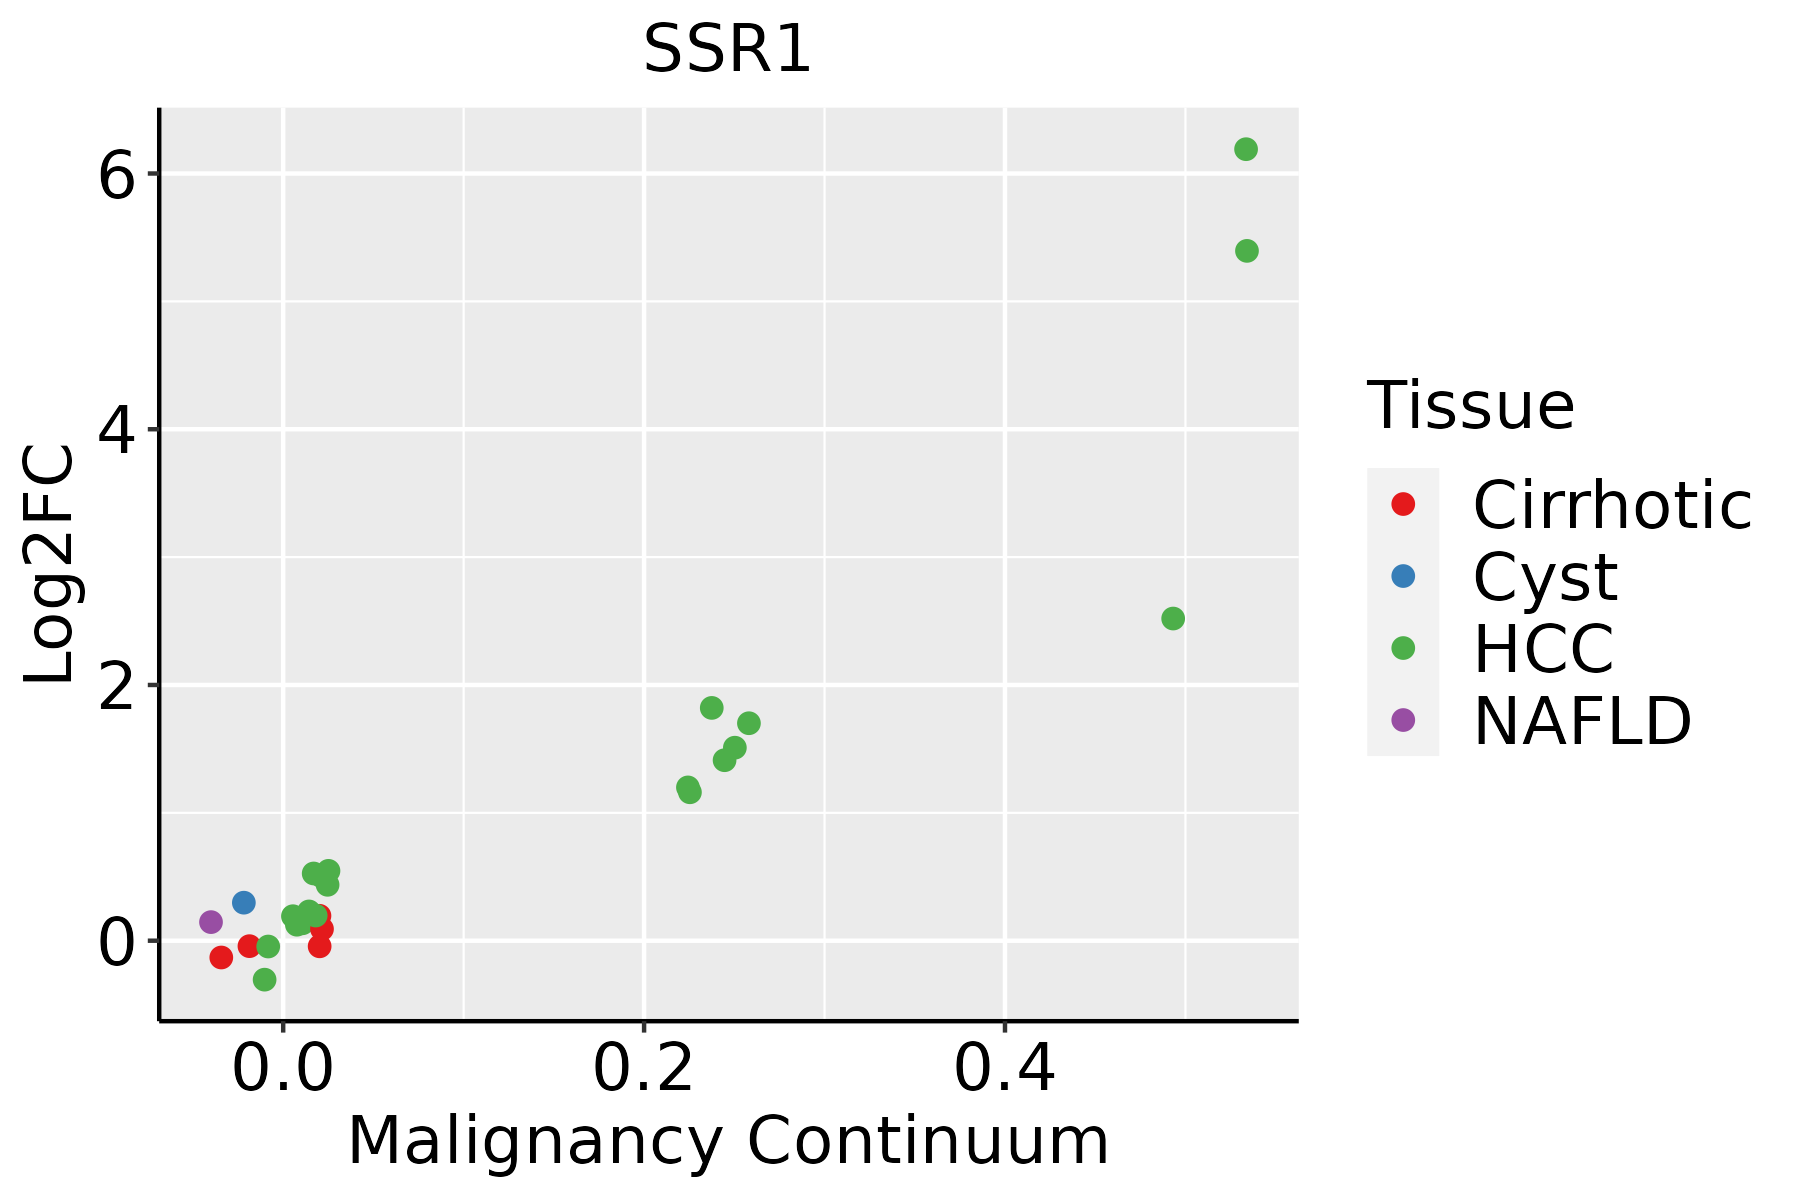 | HCC: Hepatocellular carcinoma |
| NAFLD: Non-alcoholic fatty liver disease | ||
| Oral Cavity | 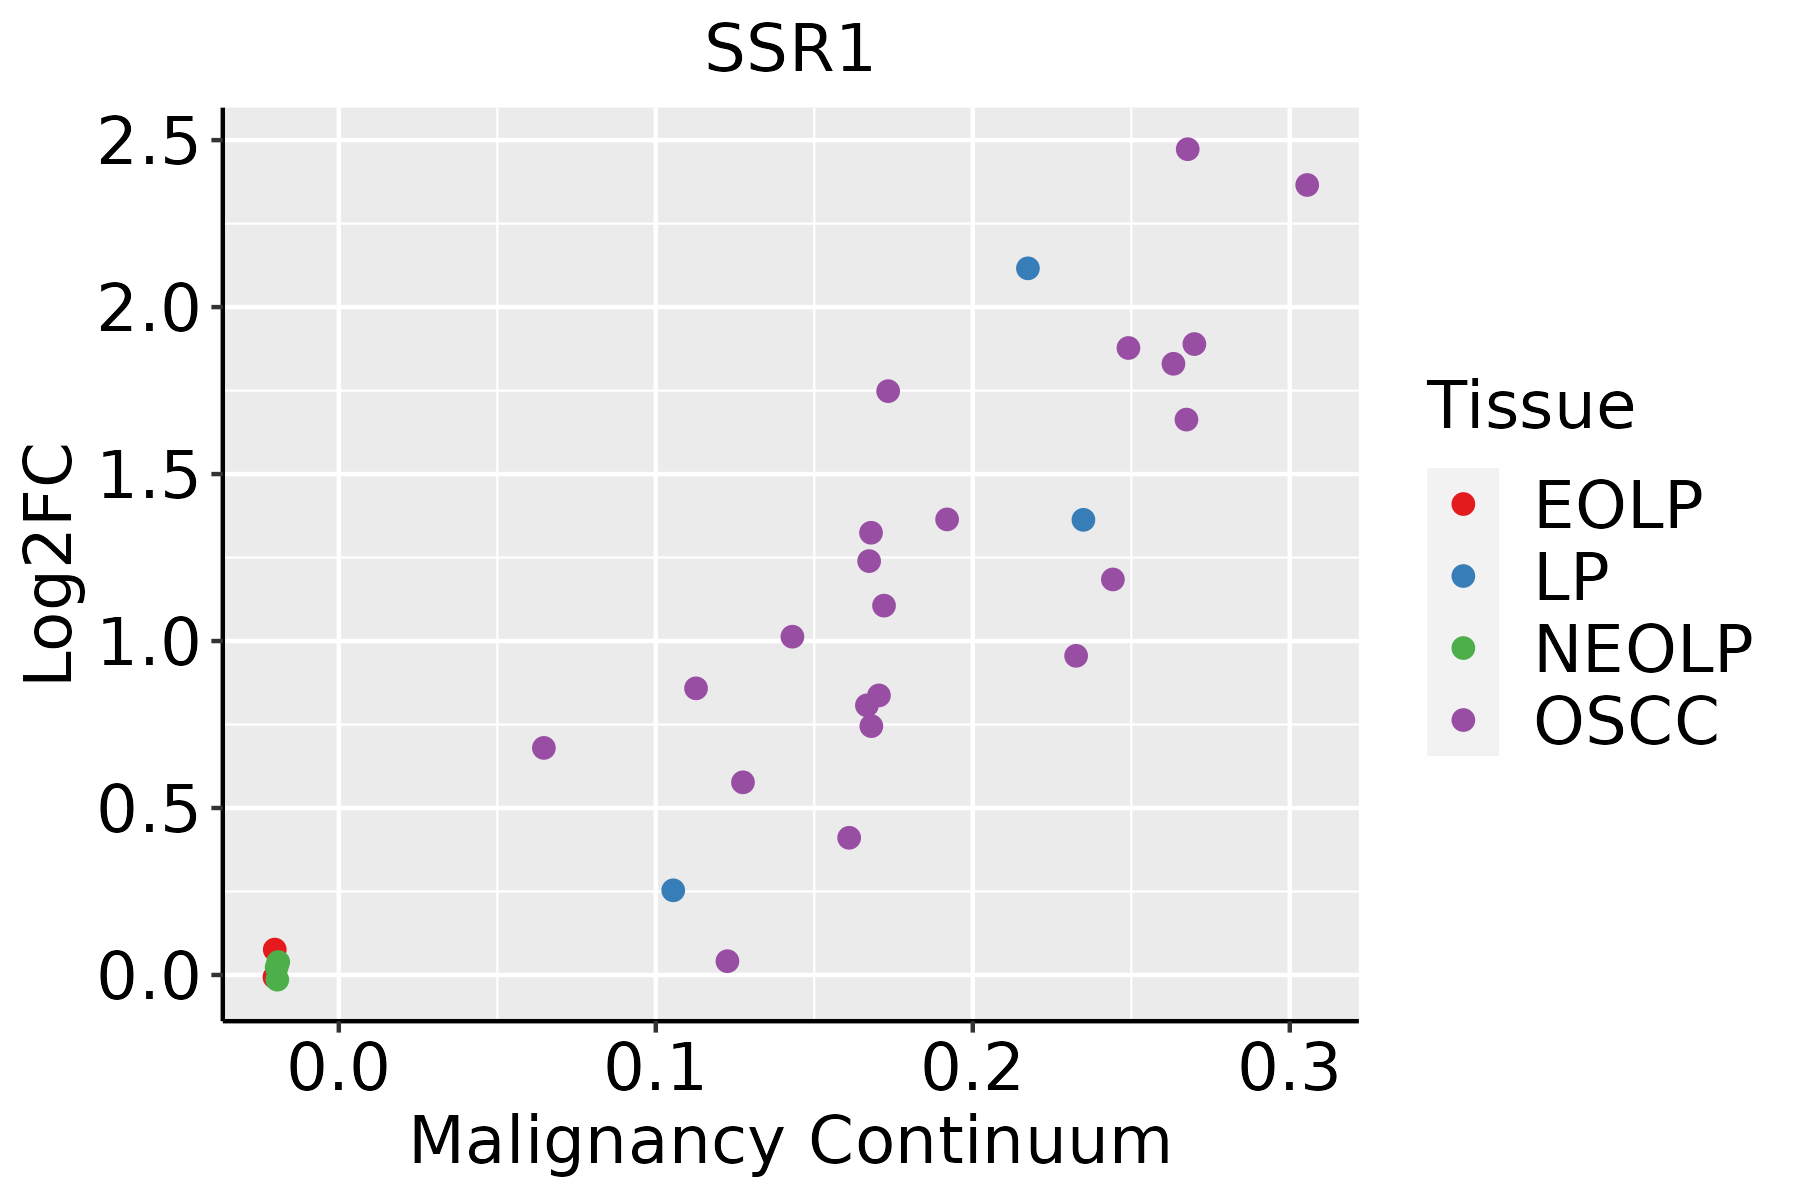 | EOLP: Erosive Oral lichen planus |
| LP: leukoplakia | ||
| NEOLP: Non-erosive oral lichen planus | ||
| OSCC: Oral squamous cell carcinoma | ||
| Prostate |  | BPH: Benign Prostatic Hyperplasia |
| Skin |  | AK: Actinic keratosis |
| cSCC: Cutaneous squamous cell carcinoma | ||
| SCCIS:squamous cell carcinoma in situ | ||
| Thyroid | 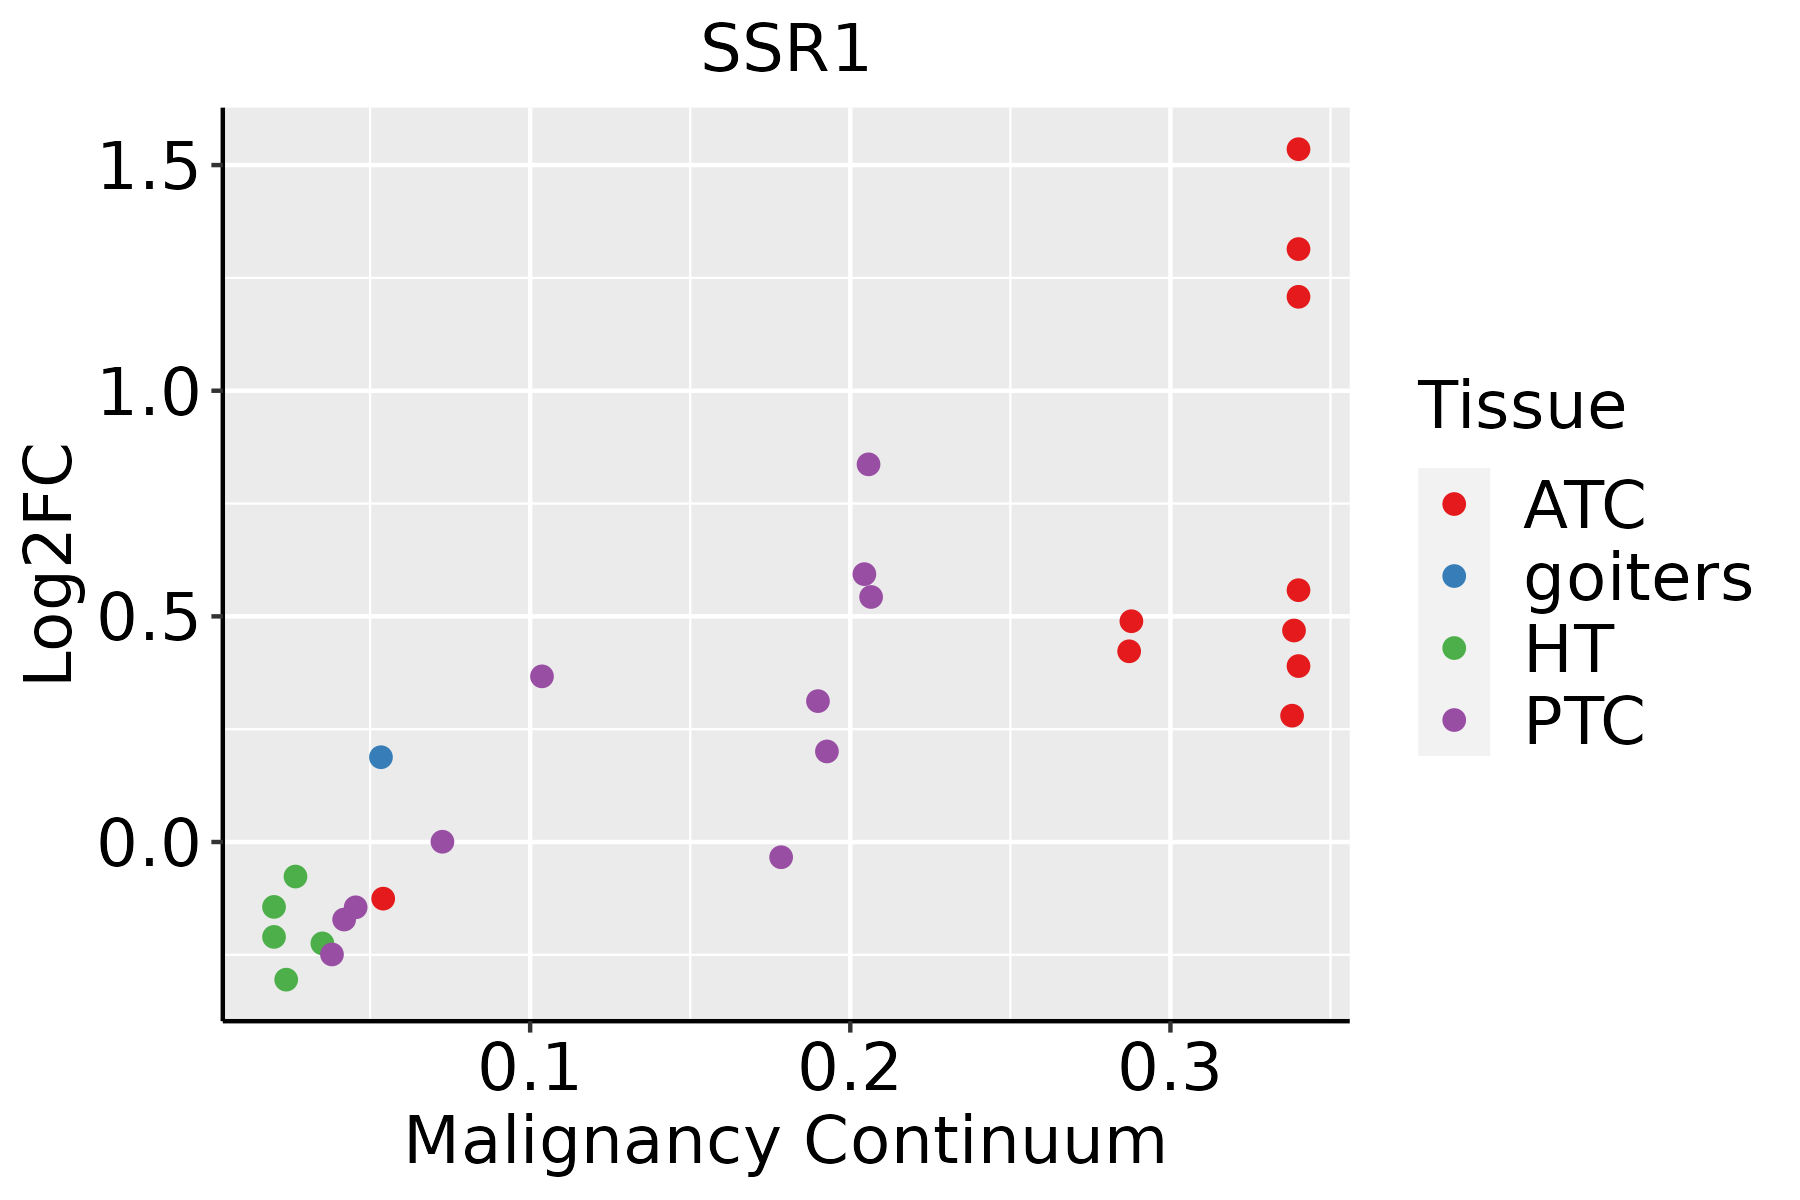 | ATC: Anaplastic thyroid cancer |
| HT: Hashimoto's thyroiditis | ||
| PTC: Papillary thyroid cancer |
| ∗log2FC in expression of this searched gene in stem-like cells from each diseased tissue sample relative to stem-like cells in normal samples in each tissue plotted against the malignancy continuum. Samples are colored based on if they are from different disease stage. |
Top |
Malignant transformation related pathway analysis |
| Find out the enriched GO biological processes and KEGG pathways involved in transition from healthy to precancer to cancer |
| Tissue | Disease Stage | Enriched GO biological Processes |
| Colorectum | AD |  |
| Colorectum | SER |  |
| Colorectum | MSS |  |
| Colorectum | MSI-H |  |
| Colorectum | FAP |  |
| ∗Top 15 enriched GO BP terms are showed in the bar plot of each disease state in each tissue. Each row represents a significant GO biological process which is colored according to the -log10(p.adjust). |
| Page: 1 2 3 4 5 6 7 8 9 |
| GO ID | Tissue | Disease Stage | Description | Gene Ratio | Bg Ratio | pvalue | p.adjust | Count |
| GO:0090150 | Colorectum | AD | establishment of protein localization to membrane | 100/3918 | 260/18723 | 6.01e-11 | 6.33e-09 | 100 |
| GO:0006605 | Colorectum | AD | protein targeting | 105/3918 | 314/18723 | 1.39e-07 | 6.44e-06 | 105 |
| GO:00901502 | Colorectum | MSS | establishment of protein localization to membrane | 90/3467 | 260/18723 | 4.11e-10 | 3.49e-08 | 90 |
| GO:00066052 | Colorectum | MSS | protein targeting | 97/3467 | 314/18723 | 6.76e-08 | 3.46e-06 | 97 |
| GO:00066053 | Colorectum | MSI-H | protein targeting | 44/1319 | 314/18723 | 9.50e-06 | 4.55e-04 | 44 |
| GO:0006613 | Colorectum | MSI-H | cotranslational protein targeting to membrane | 8/1319 | 31/18723 | 1.08e-03 | 1.84e-02 | 8 |
| GO:00901503 | Colorectum | MSI-H | establishment of protein localization to membrane | 32/1319 | 260/18723 | 1.47e-03 | 2.23e-02 | 32 |
| GO:00901504 | Colorectum | FAP | establishment of protein localization to membrane | 69/2622 | 260/18723 | 6.40e-08 | 4.54e-06 | 69 |
| GO:00066054 | Colorectum | FAP | protein targeting | 74/2622 | 314/18723 | 3.21e-06 | 1.17e-04 | 74 |
| GO:0006612 | Colorectum | FAP | protein targeting to membrane | 30/2622 | 131/18723 | 3.95e-03 | 2.75e-02 | 30 |
| GO:000660516 | Endometrium | AEH | protein targeting | 68/2100 | 314/18723 | 6.30e-08 | 3.38e-06 | 68 |
| GO:009015010 | Endometrium | AEH | establishment of protein localization to membrane | 51/2100 | 260/18723 | 4.74e-05 | 7.85e-04 | 51 |
| GO:00066133 | Endometrium | AEH | cotranslational protein targeting to membrane | 9/2100 | 31/18723 | 5.59e-03 | 3.44e-02 | 9 |
| GO:000660517 | Endometrium | EEC | protein targeting | 69/2168 | 314/18723 | 9.61e-08 | 4.69e-06 | 69 |
| GO:009015015 | Endometrium | EEC | establishment of protein localization to membrane | 52/2168 | 260/18723 | 5.46e-05 | 8.64e-04 | 52 |
| GO:000661311 | Endometrium | EEC | cotranslational protein targeting to membrane | 10/2168 | 31/18723 | 1.89e-03 | 1.45e-02 | 10 |
| GO:0006605111 | Esophagus | ESCC | protein targeting | 229/8552 | 314/18723 | 4.93e-23 | 1.01e-20 | 229 |
| GO:0090150110 | Esophagus | ESCC | establishment of protein localization to membrane | 182/8552 | 260/18723 | 1.27e-15 | 8.19e-14 | 182 |
| GO:00066124 | Esophagus | ESCC | protein targeting to membrane | 83/8552 | 131/18723 | 3.31e-05 | 2.73e-04 | 83 |
| GO:00066057 | Liver | Cirrhotic | protein targeting | 148/4634 | 314/18723 | 3.86e-18 | 6.20e-16 | 148 |
| Page: 1 2 3 |
| Pathway ID | Tissue | Disease Stage | Description | Gene Ratio | Bg Ratio | pvalue | p.adjust | qvalue | Count |
| hsa04141 | Colorectum | AD | Protein processing in endoplasmic reticulum | 80/2092 | 174/8465 | 5.96e-10 | 1.25e-08 | 7.96e-09 | 80 |
| hsa041411 | Colorectum | AD | Protein processing in endoplasmic reticulum | 80/2092 | 174/8465 | 5.96e-10 | 1.25e-08 | 7.96e-09 | 80 |
| hsa041414 | Colorectum | MSS | Protein processing in endoplasmic reticulum | 75/1875 | 174/8465 | 3.78e-10 | 8.44e-09 | 5.17e-09 | 75 |
| hsa041415 | Colorectum | MSS | Protein processing in endoplasmic reticulum | 75/1875 | 174/8465 | 3.78e-10 | 8.44e-09 | 5.17e-09 | 75 |
| hsa041416 | Colorectum | MSI-H | Protein processing in endoplasmic reticulum | 46/797 | 174/8465 | 4.53e-11 | 9.78e-10 | 8.19e-10 | 46 |
| hsa041417 | Colorectum | MSI-H | Protein processing in endoplasmic reticulum | 46/797 | 174/8465 | 4.53e-11 | 9.78e-10 | 8.19e-10 | 46 |
| hsa041418 | Colorectum | FAP | Protein processing in endoplasmic reticulum | 50/1404 | 174/8465 | 3.64e-05 | 3.68e-04 | 2.24e-04 | 50 |
| hsa041419 | Colorectum | FAP | Protein processing in endoplasmic reticulum | 50/1404 | 174/8465 | 3.64e-05 | 3.68e-04 | 2.24e-04 | 50 |
| hsa0414126 | Endometrium | AEH | Protein processing in endoplasmic reticulum | 62/1197 | 174/8465 | 5.97e-13 | 1.39e-11 | 1.01e-11 | 62 |
| hsa04141111 | Endometrium | AEH | Protein processing in endoplasmic reticulum | 62/1197 | 174/8465 | 5.97e-13 | 1.39e-11 | 1.01e-11 | 62 |
| hsa0414127 | Endometrium | EEC | Protein processing in endoplasmic reticulum | 64/1237 | 174/8465 | 2.17e-13 | 5.09e-12 | 3.80e-12 | 64 |
| hsa0414136 | Endometrium | EEC | Protein processing in endoplasmic reticulum | 64/1237 | 174/8465 | 2.17e-13 | 5.09e-12 | 3.80e-12 | 64 |
| hsa04141211 | Esophagus | ESCC | Protein processing in endoplasmic reticulum | 147/4205 | 174/8465 | 3.29e-22 | 1.10e-19 | 5.64e-20 | 147 |
| hsa04141310 | Esophagus | ESCC | Protein processing in endoplasmic reticulum | 147/4205 | 174/8465 | 3.29e-22 | 1.10e-19 | 5.64e-20 | 147 |
| hsa0414114 | Liver | Cirrhotic | Protein processing in endoplasmic reticulum | 114/2530 | 174/8465 | 1.16e-22 | 9.67e-21 | 5.96e-21 | 114 |
| hsa0414115 | Liver | Cirrhotic | Protein processing in endoplasmic reticulum | 114/2530 | 174/8465 | 1.16e-22 | 9.67e-21 | 5.96e-21 | 114 |
| hsa0414122 | Liver | HCC | Protein processing in endoplasmic reticulum | 146/4020 | 174/8465 | 7.34e-24 | 2.46e-21 | 1.37e-21 | 146 |
| hsa0414132 | Liver | HCC | Protein processing in endoplasmic reticulum | 146/4020 | 174/8465 | 7.34e-24 | 2.46e-21 | 1.37e-21 | 146 |
| hsa0414130 | Oral cavity | OSCC | Protein processing in endoplasmic reticulum | 143/3704 | 174/8465 | 6.82e-26 | 2.28e-23 | 1.16e-23 | 143 |
| hsa04141113 | Oral cavity | OSCC | Protein processing in endoplasmic reticulum | 143/3704 | 174/8465 | 6.82e-26 | 2.28e-23 | 1.16e-23 | 143 |
| Page: 1 2 |
Top |
Cell-cell communication analysis |
| Identification of potential cell-cell interactions between two cell types and their ligand-receptor pairs for different disease states |
| Ligand | Receptor | LRpair | Pathway | Tissue | Disease Stage |
| Page: 1 |
Top |
Single-cell gene regulatory network inference analysis |
| Find out the significant the regulons (TFs) and the target genes of each regulon across cell types for different disease states |
| TF | Cell Type | Tissue | Disease Stage | Target Gene | RSS | Regulon Activity |
| ∗The dot plots of a searched regulon are shown for all cell subpopulations in each disease state of each tissue based on the regulon specific score inferred using pySCENIC and by calculating the average expression. |
| Page: 1 |
Top |
Somatic mutation of malignant transformation related genes |
| Annotation of somatic variants for genes involved in malignant transformation |
| Hugo Symbol | Variant Class | Variant Classification | dbSNP RS | HGVSc | HGVSp | HGVSp Short | SWISSPROT | BIOTYPE | SIFT | PolyPhen | Tumor Sample Barcode | Tissue | Histology | Sex | Age | Stage | Therapy Types | Drugs | Outcome |
| SSR1 | SNV | Missense_Mutation | c.109G>C | p.Glu37Gln | p.E37Q | P43307 | protein_coding | tolerated(0.14) | possibly_damaging(0.766) | TCGA-AC-A23H-01 | Breast | breast invasive carcinoma | Female | >=65 | I/II | Unknown | Unknown | PD | |
| SSR1 | SNV | Missense_Mutation | rs780878023 | c.419T>C | p.Leu140Pro | p.L140P | P43307 | protein_coding | deleterious(0) | probably_damaging(0.959) | TCGA-E2-A14N-01 | Breast | breast invasive carcinoma | Female | <65 | I/II | Chemotherapy | cyclophosphamide | SD |
| SSR1 | deletion | Frame_Shift_Del | novel | c.545delN | p.Gly182AlafsTer22 | p.G182Afs*22 | P43307 | protein_coding | TCGA-EW-A2FV-01 | Breast | breast invasive carcinoma | Female | <65 | III/IV | Chemotherapy | docetaxel | SD | ||
| SSR1 | SNV | Missense_Mutation | novel | c.373C>T | p.Arg125Cys | p.R125C | P43307 | protein_coding | deleterious(0) | possibly_damaging(0.465) | TCGA-2W-A8YY-01 | Cervix | cervical & endocervical cancer | Female | <65 | I/II | Chemotherapy | cisplatin | CR |
| SSR1 | SNV | Missense_Mutation | c.496N>A | p.Gly166Arg | p.G166R | P43307 | protein_coding | deleterious(0) | probably_damaging(0.998) | TCGA-AA-3672-01 | Colorectum | colon adenocarcinoma | Female | >=65 | III/IV | Unknown | Unknown | SD | |
| SSR1 | SNV | Missense_Mutation | novel | c.166N>C | p.Val56Leu | p.V56L | P43307 | protein_coding | deleterious(0.02) | benign(0.035) | TCGA-AA-3877-01 | Colorectum | colon adenocarcinoma | Female | >=65 | I/II | Unknown | Unknown | SD |
| SSR1 | SNV | Missense_Mutation | c.803N>T | p.Ser268Leu | p.S268L | P43307 | protein_coding | deleterious(0) | possibly_damaging(0.762) | TCGA-AA-A010-01 | Colorectum | colon adenocarcinoma | Female | <65 | I/II | Chemotherapy | folinic | CR | |
| SSR1 | SNV | Missense_Mutation | novel | c.587N>G | p.Val196Gly | p.V196G | P43307 | protein_coding | deleterious(0) | possibly_damaging(0.664) | TCGA-AZ-4315-01 | Colorectum | colon adenocarcinoma | Male | <65 | I/II | Unknown | Unknown | SD |
| SSR1 | SNV | Missense_Mutation | rs777732061 | c.620N>T | p.Thr207Ile | p.T207I | P43307 | protein_coding | deleterious(0.03) | probably_damaging(0.974) | TCGA-G4-6297-01 | Colorectum | colon adenocarcinoma | Female | <65 | III/IV | Chemotherapy | fluorouracil | PD |
| SSR1 | SNV | Missense_Mutation | novel | c.528C>A | p.Asn176Lys | p.N176K | P43307 | protein_coding | deleterious(0.01) | possibly_damaging(0.872) | TCGA-A5-A7WJ-01 | Endometrium | uterine corpus endometrioid carcinoma | Female | <65 | I/II | Unknown | Unknown | SD |
| Page: 1 2 3 |
Top |
Related drugs of malignant transformation related genes |
| Identification of chemicals and drugs interact with genes involved in malignant transfromation |
| (DGIdb 4.0) |
| Entrez ID | Symbol | Category | Interaction Types | Drug Claim Name | Drug Name | PMIDs |
| Page: 1 |

Copyright 2023-Present -The University of Texas Health Science Center at Houston |