
|
|||||
|
 | |
| |
| |
| |
| |
| |
|
Gene: SSPN |
Gene summary for SSPN |
| Gene information | Species | Human | Gene symbol | SSPN | Gene ID | 8082 |
| Gene name | sarcospan | |
| Gene Alias | DAGA5 | |
| Cytomap | 12p12.1 | |
| Gene Type | protein-coding | GO ID | GO:0003008 | UniProtAcc | Q14714 |
Top |
Malignant transformation analysis |
| Identification of the aberrant gene expression in precancerous and cancerous lesions by comparing the gene expression of stem-like cells in diseased tissues with normal stem cells |
| Entrez ID | Symbol | Replicates | Species | Organ | Tissue | Adj P-value | Log2FC | Malignancy |
| 8082 | SSPN | AEH-subject1 | Human | Endometrium | AEH | 5.19e-10 | -3.41e-01 | -0.3059 |
| 8082 | SSPN | AEH-subject2 | Human | Endometrium | AEH | 1.42e-10 | -3.05e-01 | -0.2525 |
| 8082 | SSPN | AEH-subject3 | Human | Endometrium | AEH | 1.38e-11 | -3.84e-01 | -0.2576 |
| 8082 | SSPN | AEH-subject4 | Human | Endometrium | AEH | 2.64e-11 | -3.81e-01 | -0.2657 |
| 8082 | SSPN | AEH-subject5 | Human | Endometrium | AEH | 5.58e-17 | -4.58e-01 | -0.2953 |
| 8082 | SSPN | EEC-subject1 | Human | Endometrium | EEC | 9.03e-16 | -4.13e-01 | -0.2682 |
| 8082 | SSPN | EEC-subject2 | Human | Endometrium | EEC | 9.68e-17 | -4.58e-01 | -0.2607 |
| 8082 | SSPN | EEC-subject3 | Human | Endometrium | EEC | 1.73e-21 | -4.31e-01 | -0.2525 |
| 8082 | SSPN | EEC-subject4 | Human | Endometrium | EEC | 3.98e-14 | -4.27e-01 | -0.2571 |
| 8082 | SSPN | EEC-subject5 | Human | Endometrium | EEC | 1.21e-15 | -4.27e-01 | -0.249 |
| 8082 | SSPN | GSM5276934 | Human | Endometrium | EEC | 1.12e-02 | -2.22e-01 | -0.0913 |
| 8082 | SSPN | GSM5276935 | Human | Endometrium | EEC | 4.46e-24 | -4.79e-01 | -0.123 |
| 8082 | SSPN | GSM5276937 | Human | Endometrium | EEC | 3.28e-07 | -2.79e-01 | -0.0897 |
| 8082 | SSPN | GSM6177620_NYU_UCEC1_lib1_lib1 | Human | Endometrium | EEC | 6.87e-25 | -4.61e-01 | -0.1869 |
| 8082 | SSPN | GSM6177620_NYU_UCEC1_lib2_lib2 | Human | Endometrium | EEC | 1.05e-24 | -4.45e-01 | -0.1875 |
| 8082 | SSPN | GSM6177620_NYU_UCEC1_lib3_lib3 | Human | Endometrium | EEC | 4.39e-27 | -4.44e-01 | -0.1883 |
| 8082 | SSPN | GSM6177621_NYU_UCEC2_lib1_lib1 | Human | Endometrium | EEC | 1.16e-34 | -5.05e-01 | -0.1934 |
| 8082 | SSPN | GSM6177622_NYU_UCEC3_lib1_lib1 | Human | Endometrium | EEC | 7.96e-31 | -4.98e-01 | -0.1917 |
| 8082 | SSPN | GSM6177622_NYU_UCEC3_lib2_lib2 | Human | Endometrium | EEC | 6.81e-37 | -5.08e-01 | -0.1916 |
| 8082 | SSPN | GSM6177623_NYU_UCEC3_Vis | Human | Endometrium | EEC | 1.12e-20 | -4.52e-01 | -0.1269 |
| Page: 1 2 3 4 5 |
| Tissue | Expression Dynamics | Abbreviation |
| Endometrium | 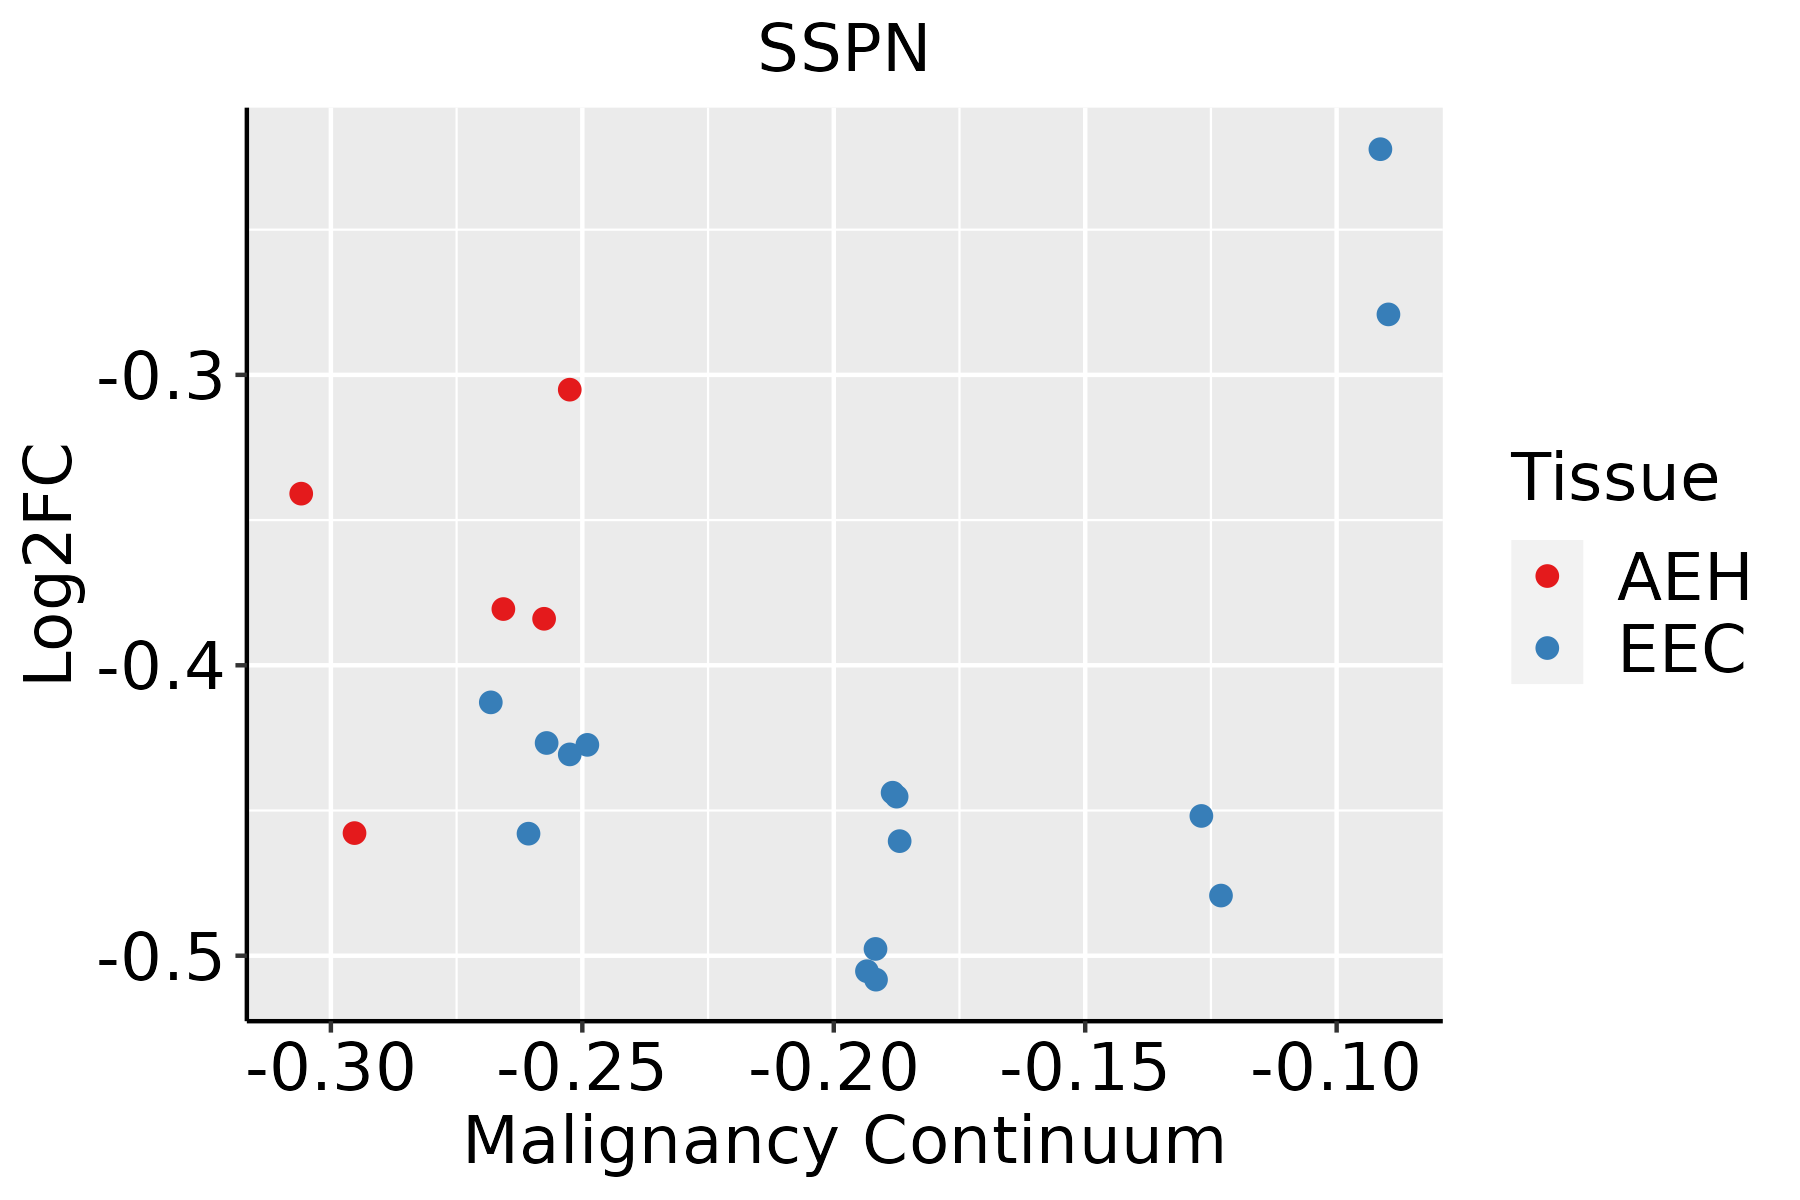 | AEH: Atypical endometrial hyperplasia |
| EEC: Endometrioid Cancer | ||
| Esophagus | 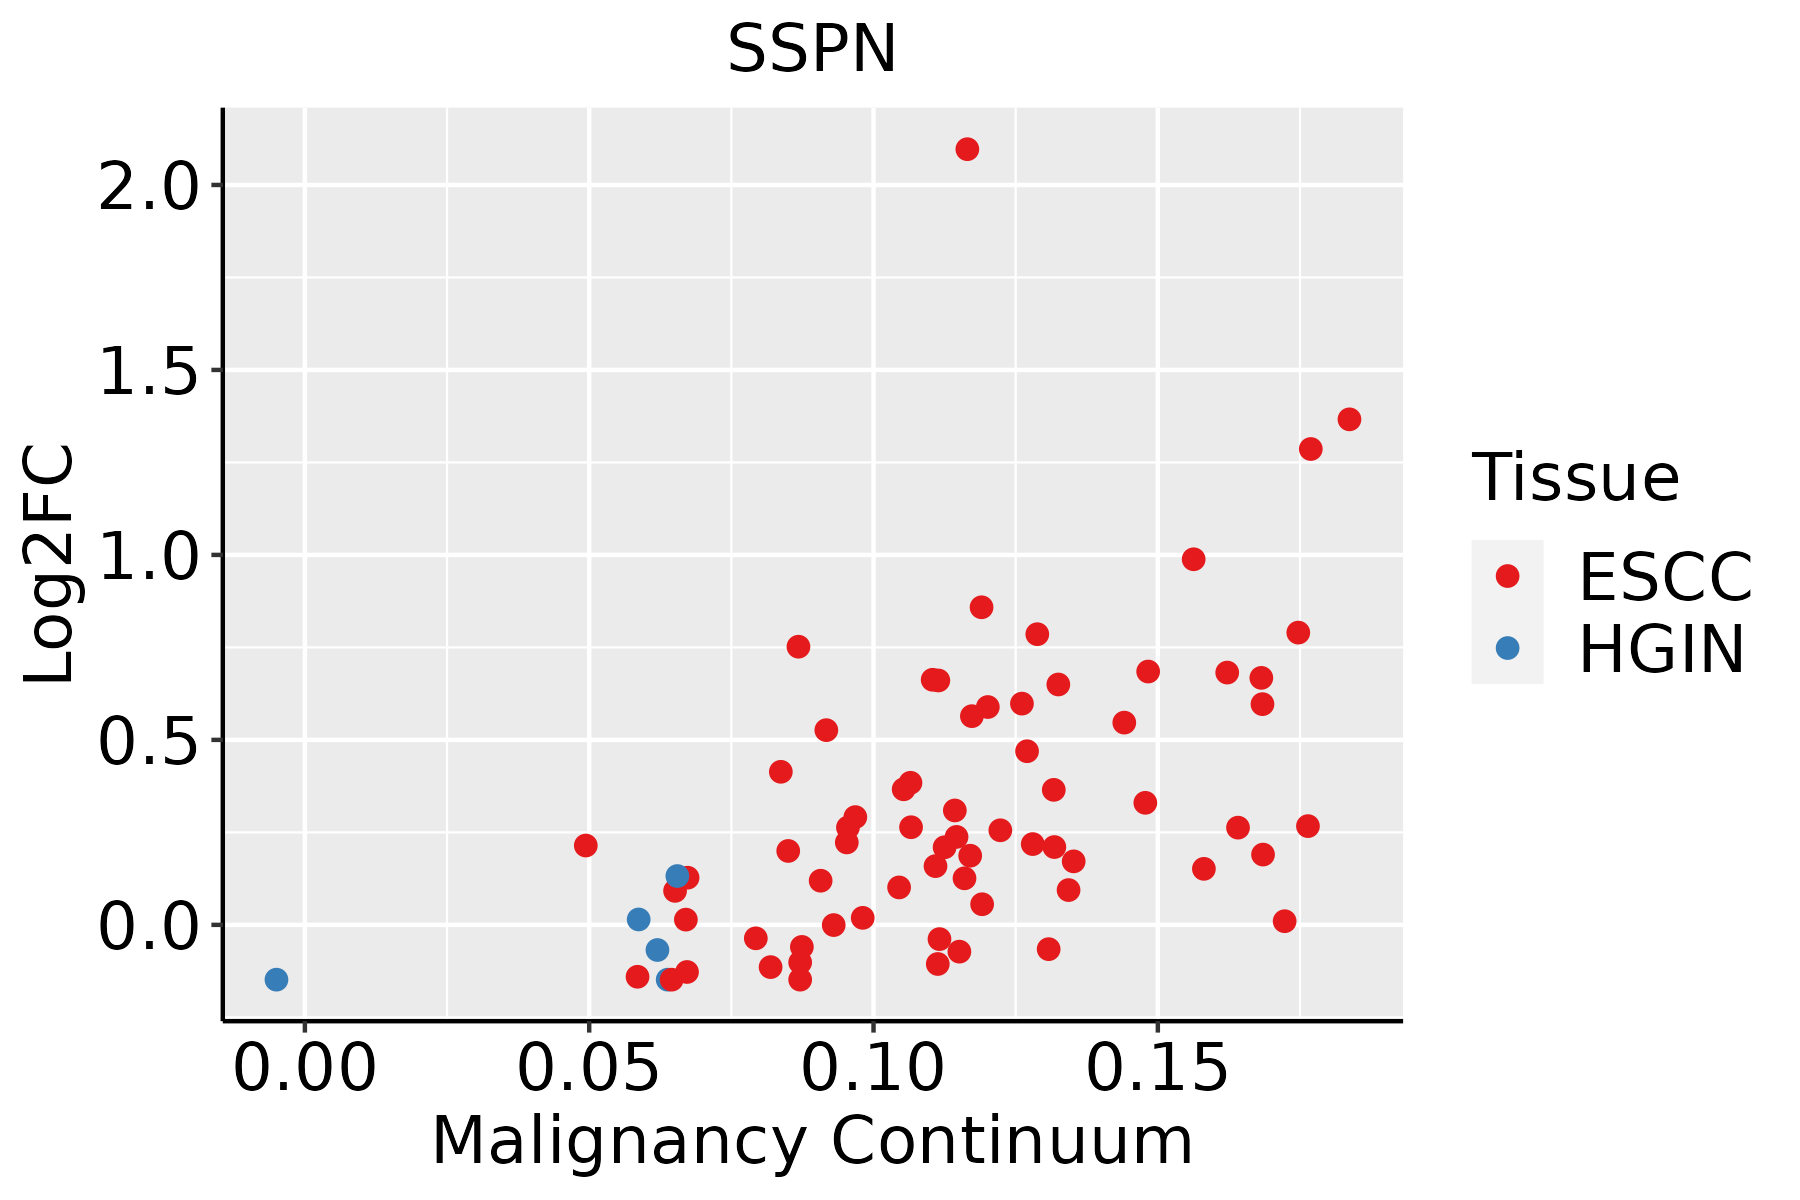 | ESCC: Esophageal squamous cell carcinoma |
| HGIN: High-grade intraepithelial neoplasias | ||
| LGIN: Low-grade intraepithelial neoplasias | ||
| Oral Cavity |  | EOLP: Erosive Oral lichen planus |
| LP: leukoplakia | ||
| NEOLP: Non-erosive oral lichen planus | ||
| OSCC: Oral squamous cell carcinoma | ||
| Thyroid |  | ATC: Anaplastic thyroid cancer |
| HT: Hashimoto's thyroiditis | ||
| PTC: Papillary thyroid cancer |
| ∗log2FC in expression of this searched gene in stem-like cells from each diseased tissue sample relative to stem-like cells in normal samples in each tissue plotted against the malignancy continuum. Samples are colored based on if they are from different disease stage. |
Top |
Malignant transformation related pathway analysis |
| Find out the enriched GO biological processes and KEGG pathways involved in transition from healthy to precancer to cancer |
| Tissue | Disease Stage | Enriched GO biological Processes |
| Colorectum | AD |  |
| Colorectum | SER |  |
| Colorectum | MSS |  |
| Colorectum | MSI-H |  |
| Colorectum | FAP |  |
| ∗Top 15 enriched GO BP terms are showed in the bar plot of each disease state in each tissue. Each row represents a significant GO biological process which is colored according to the -log10(p.adjust). |
| Page: 1 2 3 4 5 6 7 8 9 |
| GO ID | Tissue | Disease Stage | Description | Gene Ratio | Bg Ratio | pvalue | p.adjust | Count |
| GO:00030126 | Endometrium | AEH | muscle system process | 78/2100 | 452/18723 | 6.89e-05 | 1.06e-03 | 78 |
| GO:0006936 | Endometrium | AEH | muscle contraction | 59/2100 | 347/18723 | 7.32e-04 | 6.99e-03 | 59 |
| GO:000301213 | Endometrium | EEC | muscle system process | 79/2168 | 452/18723 | 1.16e-04 | 1.55e-03 | 79 |
| GO:00069361 | Endometrium | EEC | muscle contraction | 59/2168 | 347/18723 | 1.57e-03 | 1.26e-02 | 59 |
| Page: 1 |
| Pathway ID | Tissue | Disease Stage | Description | Gene Ratio | Bg Ratio | pvalue | p.adjust | qvalue | Count |
| Page: 1 |
Top |
Cell-cell communication analysis |
| Identification of potential cell-cell interactions between two cell types and their ligand-receptor pairs for different disease states |
| Ligand | Receptor | LRpair | Pathway | Tissue | Disease Stage |
| Page: 1 |
Top |
Single-cell gene regulatory network inference analysis |
| Find out the significant the regulons (TFs) and the target genes of each regulon across cell types for different disease states |
| TF | Cell Type | Tissue | Disease Stage | Target Gene | RSS | Regulon Activity |
| ∗The dot plots of a searched regulon are shown for all cell subpopulations in each disease state of each tissue based on the regulon specific score inferred using pySCENIC and by calculating the average expression. |
| Page: 1 |
Top |
Somatic mutation of malignant transformation related genes |
| Annotation of somatic variants for genes involved in malignant transformation |
| Hugo Symbol | Variant Class | Variant Classification | dbSNP RS | HGVSc | HGVSp | HGVSp Short | SWISSPROT | BIOTYPE | SIFT | PolyPhen | Tumor Sample Barcode | Tissue | Histology | Sex | Age | Stage | Therapy Types | Drugs | Outcome |
| SSPN | insertion | Nonsense_Mutation | novel | c.470_471insGCCCAACATCTGGATGGCAAGTGAAAATGTGATCAGGGTTTAAGAA | p.Thr158ProfsTer14 | p.T158Pfs*14 | Q14714 | protein_coding | TCGA-A8-A07Z-01 | Breast | breast invasive carcinoma | Female | >=65 | I/II | Unspecific | Exemestane | SD | ||
| SSPN | insertion | Nonsense_Mutation | novel | c.420_421insCAGTGA | p.Val140_Ala141insGlnTer | p.V140_A141insQ* | Q14714 | protein_coding | TCGA-A8-A0A6-01 | Breast | breast invasive carcinoma | Female | <65 | III/IV | Chemotherapy | epirubicin | CR | ||
| SSPN | insertion | In_Frame_Ins | novel | c.422_423insTGAGATCAAGCCACTGCACTCTGT | p.Ala141_Phe142insGluIleLysProLeuHisSerVal | p.A141_F142insEIKPLHSV | Q14714 | protein_coding | TCGA-A8-A0A6-01 | Breast | breast invasive carcinoma | Female | <65 | III/IV | Chemotherapy | epirubicin | CR | ||
| SSPN | SNV | Missense_Mutation | c.521N>T | p.Arg174Met | p.R174M | Q14714 | protein_coding | deleterious(0) | probably_damaging(1) | TCGA-AD-A5EJ-01 | Colorectum | colon adenocarcinoma | Female | >=65 | I/II | Unknown | Unknown | SD | |
| SSPN | SNV | Missense_Mutation | novel | c.457T>C | p.Phe153Leu | p.F153L | Q14714 | protein_coding | tolerated(0.14) | benign(0.009) | TCGA-DM-A28F-01 | Colorectum | colon adenocarcinoma | Male | >=65 | III/IV | Unknown | Unknown | SD |
| SSPN | SNV | Missense_Mutation | novel | c.421N>A | p.Ala141Thr | p.A141T | Q14714 | protein_coding | deleterious(0) | probably_damaging(0.976) | TCGA-B5-A3FC-01 | Endometrium | uterine corpus endometrioid carcinoma | Female | <65 | I/II | Unknown | Unknown | SD |
| SSPN | SNV | Missense_Mutation | novel | c.313N>T | p.Leu105Phe | p.L105F | Q14714 | protein_coding | tolerated(0.19) | probably_damaging(0.946) | TCGA-BG-A222-01 | Endometrium | uterine corpus endometrioid carcinoma | Female | <65 | I/II | Unknown | Unknown | SD |
| SSPN | SNV | Missense_Mutation | novel | c.709N>A | p.Glu237Lys | p.E237K | Q14714 | protein_coding | tolerated(0.08) | benign(0) | TCGA-D1-A16X-01 | Endometrium | uterine corpus endometrioid carcinoma | Female | <65 | I/II | Unknown | Unknown | SD |
| SSPN | SNV | Missense_Mutation | novel | c.337N>A | p.Glu113Lys | p.E113K | Q14714 | protein_coding | deleterious(0) | probably_damaging(0.999) | TCGA-D1-A17Q-01 | Endometrium | uterine corpus endometrioid carcinoma | Female | <65 | I/II | Unknown | Unknown | SD |
| SSPN | SNV | Missense_Mutation | novel | c.451A>G | p.Thr151Ala | p.T151A | Q14714 | protein_coding | tolerated(0.15) | benign(0.003) | TCGA-EO-A3B0-01 | Endometrium | uterine corpus endometrioid carcinoma | Female | <65 | III/IV | Unknown | Unknown | SD |
| Page: 1 2 |
Top |
Related drugs of malignant transformation related genes |
| Identification of chemicals and drugs interact with genes involved in malignant transfromation |
| (DGIdb 4.0) |
| Entrez ID | Symbol | Category | Interaction Types | Drug Claim Name | Drug Name | PMIDs |
| Page: 1 |

Copyright 2023-Present -The University of Texas Health Science Center at Houston |