| Tissue | Expression Dynamics | Abbreviation |
| Liver |  | HCC: Hepatocellular carcinoma |
| NAFLD: Non-alcoholic fatty liver disease |
| Lung | 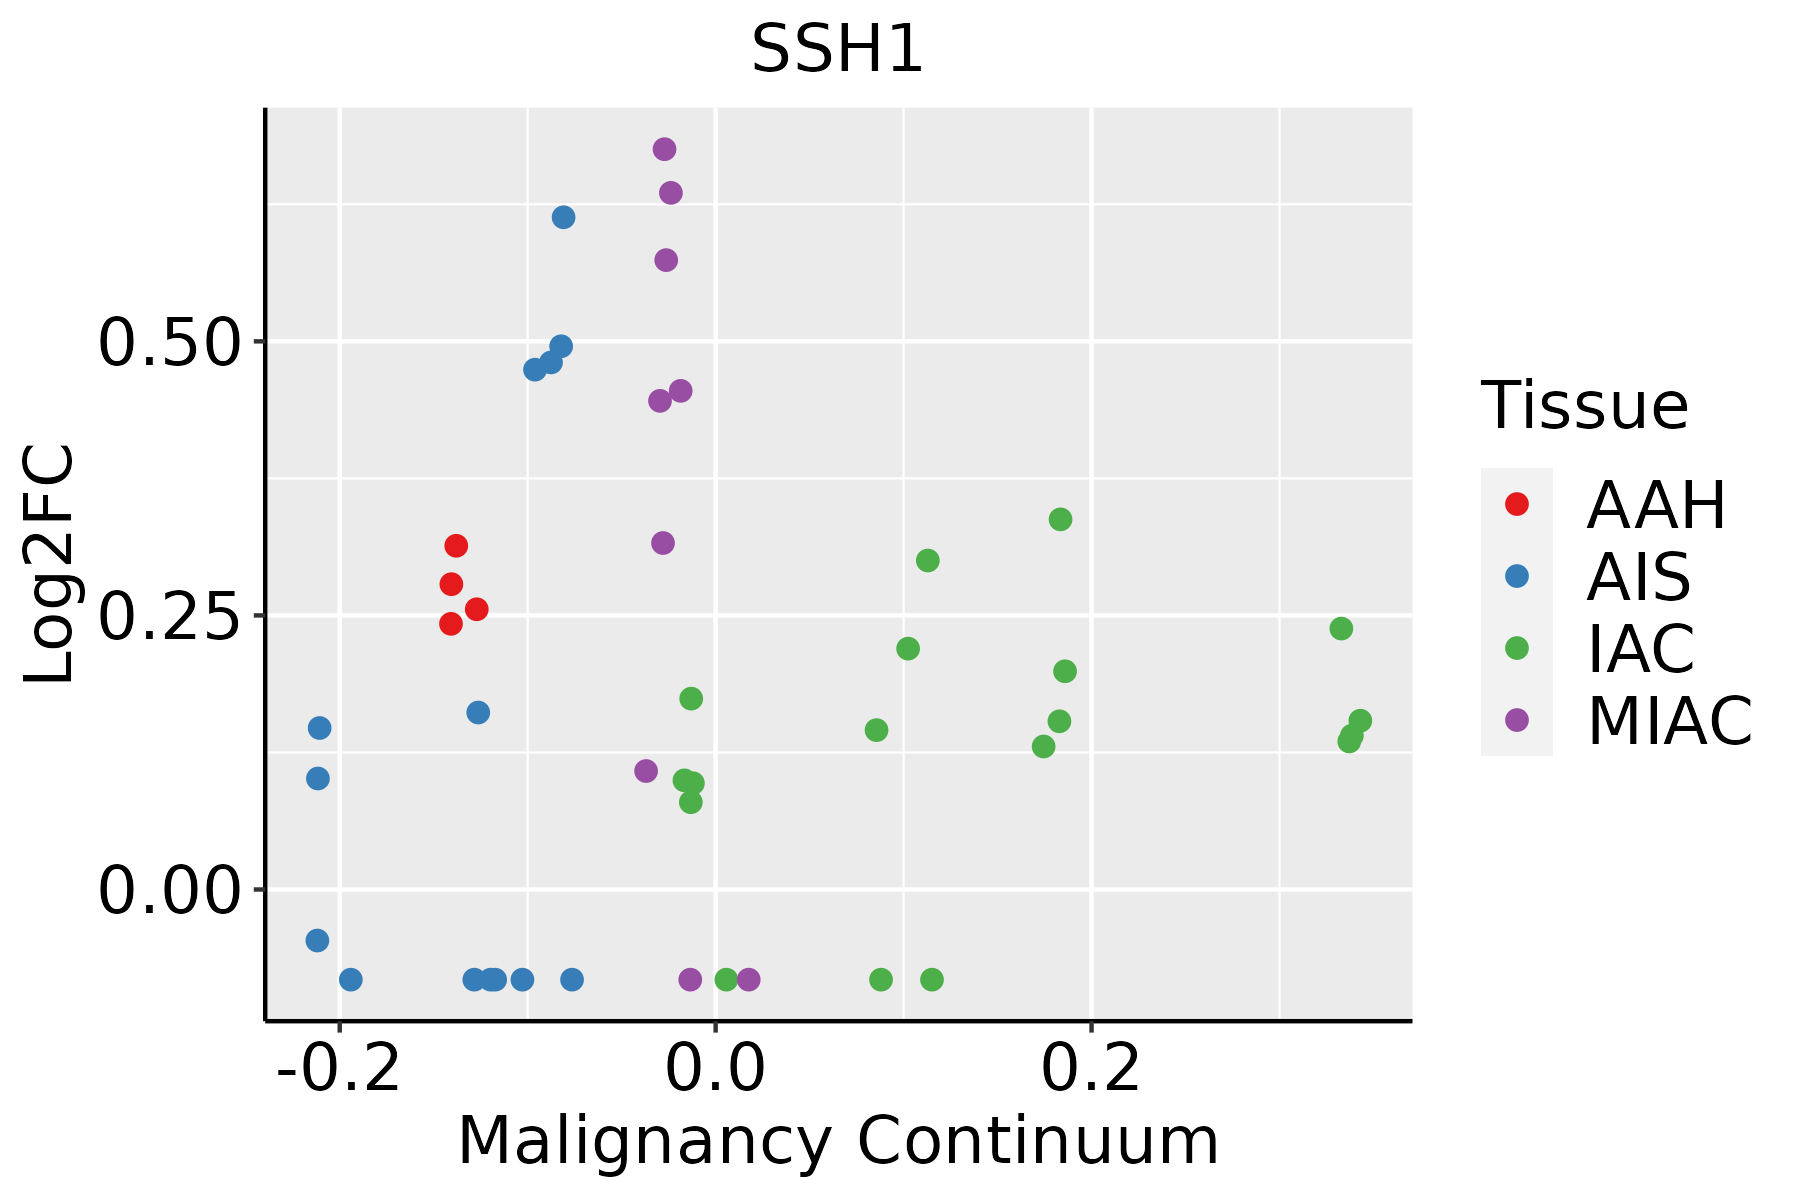 | AAH: Atypical adenomatous hyperplasia |
| AIS: Adenocarcinoma in situ |
| IAC: Invasive lung adenocarcinoma |
| MIA: Minimally invasive adenocarcinoma |
| Oral Cavity |  | EOLP: Erosive Oral lichen planus |
| LP: leukoplakia |
| NEOLP: Non-erosive oral lichen planus |
| OSCC: Oral squamous cell carcinoma |
| Prostate |  | BPH: Benign Prostatic Hyperplasia |
| Thyroid | 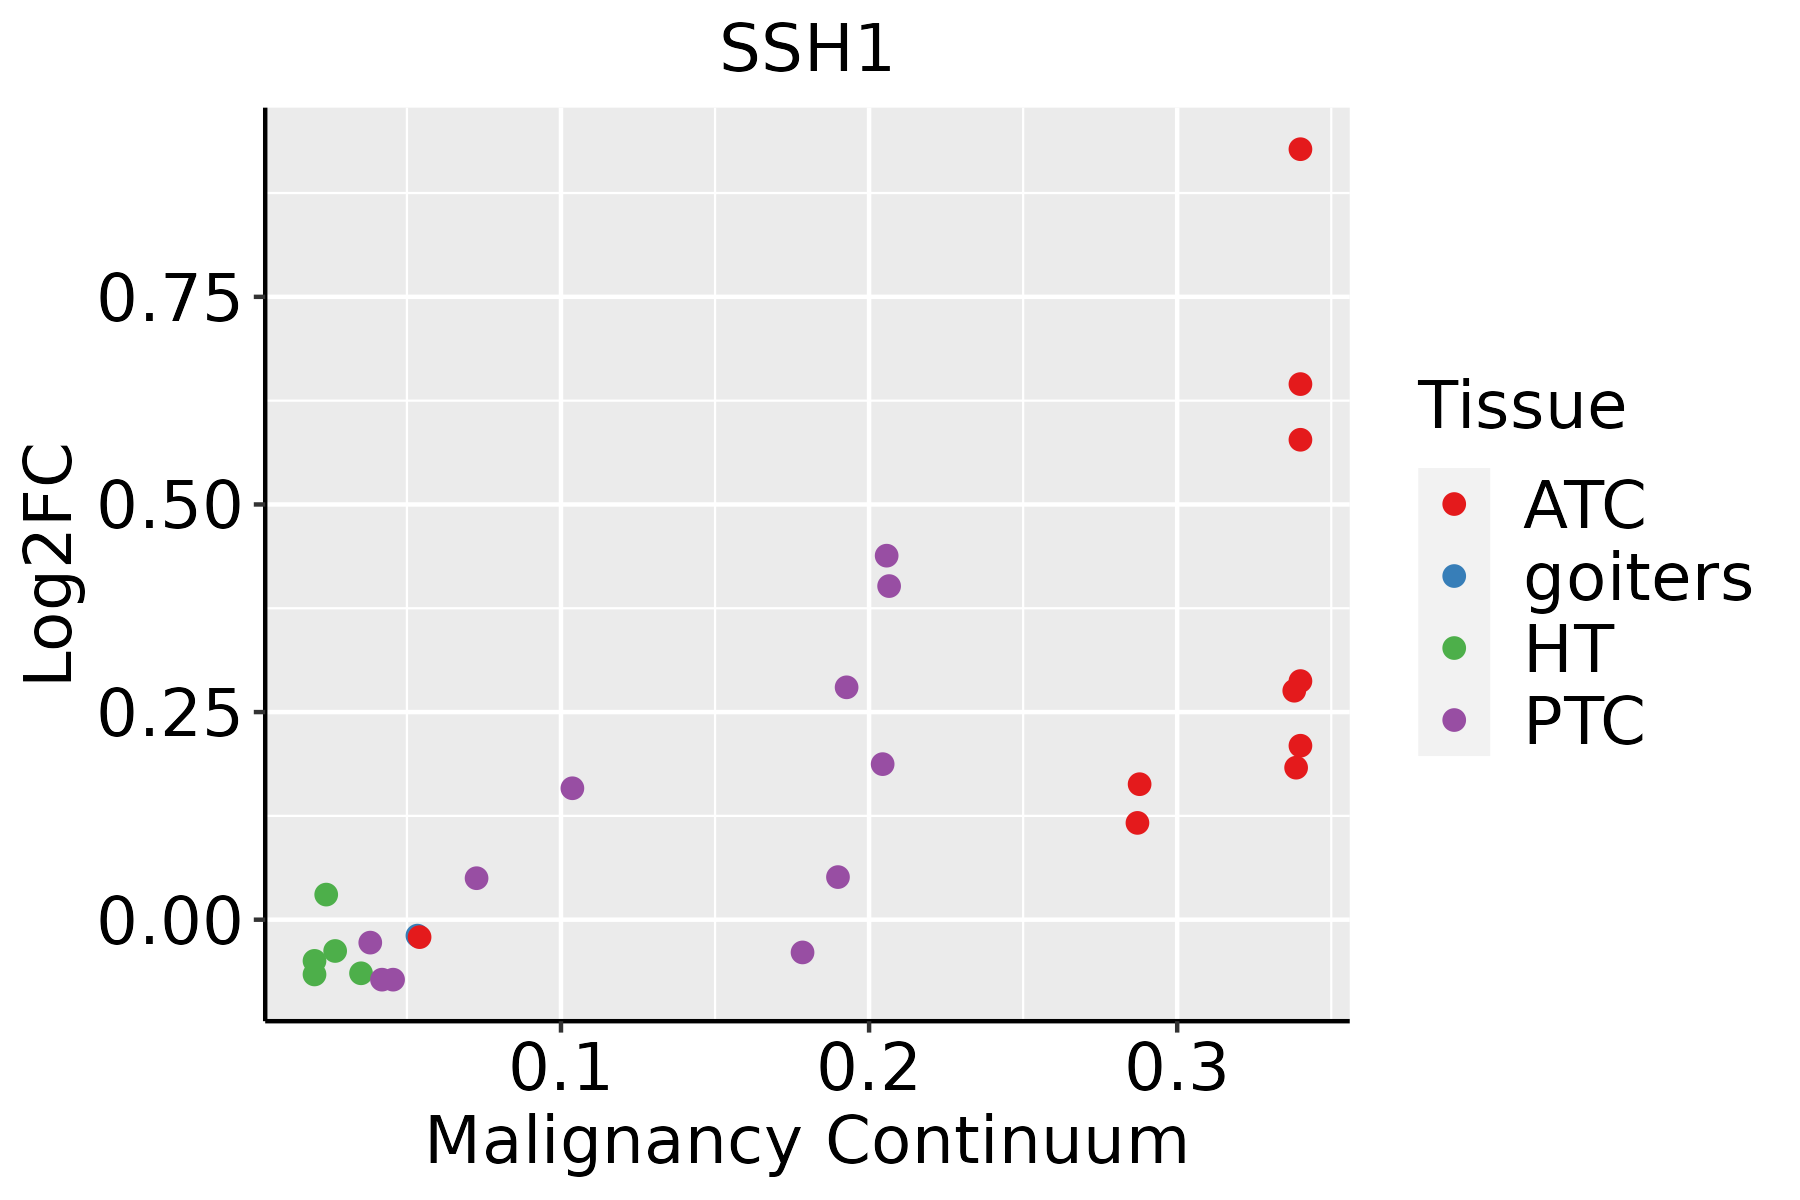 | ATC: Anaplastic thyroid cancer |
| HT: Hashimoto's thyroiditis |
| PTC: Papillary thyroid cancer |
| GO ID | Tissue | Disease Stage | Description | Gene Ratio | Bg Ratio | pvalue | p.adjust | Count |
| GO:00070157 | Liver | NAFLD | actin filament organization | 78/1882 | 442/18723 | 5.44e-07 | 3.21e-05 | 78 |
| GO:19029037 | Liver | NAFLD | regulation of supramolecular fiber organization | 66/1882 | 383/18723 | 8.97e-06 | 2.96e-04 | 66 |
| GO:00163115 | Liver | NAFLD | dephosphorylation | 69/1882 | 417/18723 | 2.27e-05 | 6.23e-04 | 69 |
| GO:00329707 | Liver | NAFLD | regulation of actin filament-based process | 66/1882 | 397/18723 | 2.92e-05 | 7.72e-04 | 66 |
| GO:00064706 | Liver | NAFLD | protein dephosphorylation | 50/1882 | 281/18723 | 4.53e-05 | 1.09e-03 | 50 |
| GO:00329567 | Liver | NAFLD | regulation of actin cytoskeleton organization | 60/1882 | 358/18723 | 5.20e-05 | 1.20e-03 | 60 |
| GO:01100537 | Liver | NAFLD | regulation of actin filament organization | 49/1882 | 278/18723 | 6.88e-05 | 1.46e-03 | 49 |
| GO:00466837 | Liver | NAFLD | response to organophosphorus | 28/1882 | 131/18723 | 9.05e-05 | 1.82e-03 | 28 |
| GO:00432547 | Liver | NAFLD | regulation of protein-containing complex assembly | 66/1882 | 428/18723 | 2.83e-04 | 4.53e-03 | 66 |
| GO:00140747 | Liver | NAFLD | response to purine-containing compound | 29/1882 | 148/18723 | 3.34e-04 | 5.13e-03 | 29 |
| GO:00512587 | Liver | NAFLD | protein polymerization | 49/1882 | 297/18723 | 3.54e-04 | 5.36e-03 | 49 |
| GO:00322717 | Liver | NAFLD | regulation of protein polymerization | 38/1882 | 233/18723 | 1.90e-03 | 1.93e-02 | 38 |
| GO:00081547 | Liver | NAFLD | actin polymerization or depolymerization | 36/1882 | 218/18723 | 1.98e-03 | 1.98e-02 | 36 |
| GO:00325356 | Liver | NAFLD | regulation of cellular component size | 55/1882 | 383/18723 | 4.31e-03 | 3.55e-02 | 55 |
| GO:00300417 | Liver | NAFLD | actin filament polymerization | 31/1882 | 191/18723 | 5.06e-03 | 3.96e-02 | 31 |
| GO:00709977 | Liver | NAFLD | neuron death | 52/1882 | 361/18723 | 5.08e-03 | 3.96e-02 | 52 |
| GO:0014911 | Liver | NAFLD | positive regulation of smooth muscle cell migration | 11/1882 | 47/18723 | 5.92e-03 | 4.47e-02 | 11 |
| GO:0014910 | Liver | NAFLD | regulation of smooth muscle cell migration | 17/1882 | 89/18723 | 6.91e-03 | 4.87e-02 | 17 |
| GO:19038297 | Liver | NAFLD | positive regulation of cellular protein localization | 41/1882 | 276/18723 | 7.11e-03 | 4.95e-02 | 41 |
| GO:00308337 | Liver | NAFLD | regulation of actin filament polymerization | 28/1882 | 172/18723 | 7.15e-03 | 4.96e-02 | 28 |
| Pathway ID | Tissue | Disease Stage | Description | Gene Ratio | Bg Ratio | pvalue | p.adjust | qvalue | Count |
| hsa0481010 | Liver | NAFLD | Regulation of actin cytoskeleton | 50/1043 | 229/8465 | 3.01e-05 | 7.59e-04 | 6.11e-04 | 50 |
| hsa0481011 | Liver | NAFLD | Regulation of actin cytoskeleton | 50/1043 | 229/8465 | 3.01e-05 | 7.59e-04 | 6.11e-04 | 50 |
| hsa0481041 | Liver | HCC | Regulation of actin cytoskeleton | 134/4020 | 229/8465 | 4.48e-04 | 1.94e-03 | 1.08e-03 | 134 |
| hsa0481051 | Liver | HCC | Regulation of actin cytoskeleton | 134/4020 | 229/8465 | 4.48e-04 | 1.94e-03 | 1.08e-03 | 134 |
| hsa0481026 | Oral cavity | OSCC | Regulation of actin cytoskeleton | 129/3704 | 229/8465 | 7.14e-05 | 2.74e-04 | 1.40e-04 | 129 |
| hsa0436014 | Oral cavity | OSCC | Axon guidance | 97/3704 | 182/8465 | 5.59e-03 | 1.33e-02 | 6.76e-03 | 97 |
| hsa04810111 | Oral cavity | OSCC | Regulation of actin cytoskeleton | 129/3704 | 229/8465 | 7.14e-05 | 2.74e-04 | 1.40e-04 | 129 |
| hsa0436015 | Oral cavity | OSCC | Axon guidance | 97/3704 | 182/8465 | 5.59e-03 | 1.33e-02 | 6.76e-03 | 97 |
| hsa0481027 | Oral cavity | EOLP | Regulation of actin cytoskeleton | 50/1218 | 229/8465 | 1.34e-03 | 4.80e-03 | 2.83e-03 | 50 |
| hsa0436023 | Oral cavity | EOLP | Axon guidance | 38/1218 | 182/8465 | 1.02e-02 | 2.80e-02 | 1.65e-02 | 38 |
| hsa0481036 | Oral cavity | EOLP | Regulation of actin cytoskeleton | 50/1218 | 229/8465 | 1.34e-03 | 4.80e-03 | 2.83e-03 | 50 |
| hsa0436033 | Oral cavity | EOLP | Axon guidance | 38/1218 | 182/8465 | 1.02e-02 | 2.80e-02 | 1.65e-02 | 38 |
| hsa0481043 | Oral cavity | NEOLP | Regulation of actin cytoskeleton | 55/1112 | 229/8465 | 4.12e-06 | 3.86e-05 | 2.42e-05 | 55 |
| hsa0436041 | Oral cavity | NEOLP | Axon guidance | 37/1112 | 182/8465 | 4.02e-03 | 1.64e-02 | 1.03e-02 | 37 |
| hsa0481053 | Oral cavity | NEOLP | Regulation of actin cytoskeleton | 55/1112 | 229/8465 | 4.12e-06 | 3.86e-05 | 2.42e-05 | 55 |
| hsa0436051 | Oral cavity | NEOLP | Axon guidance | 37/1112 | 182/8465 | 4.02e-03 | 1.64e-02 | 1.03e-02 | 37 |
| hsa0481020 | Prostate | BPH | Regulation of actin cytoskeleton | 80/1718 | 229/8465 | 1.23e-07 | 1.31e-06 | 8.10e-07 | 80 |
| hsa04810110 | Prostate | BPH | Regulation of actin cytoskeleton | 80/1718 | 229/8465 | 1.23e-07 | 1.31e-06 | 8.10e-07 | 80 |
| hsa0481025 | Prostate | Tumor | Regulation of actin cytoskeleton | 84/1791 | 229/8465 | 3.40e-08 | 4.17e-07 | 2.58e-07 | 84 |
| hsa0481035 | Prostate | Tumor | Regulation of actin cytoskeleton | 84/1791 | 229/8465 | 3.40e-08 | 4.17e-07 | 2.58e-07 | 84 |
| Hugo Symbol | Variant Class | Variant Classification | dbSNP RS | HGVSc | HGVSp | HGVSp Short | SWISSPROT | BIOTYPE | SIFT | PolyPhen | Tumor Sample Barcode | Tissue | Histology | Sex | Age | Stage | Therapy Types | Drugs | Outcome |
| SSH1 | SNV | Missense_Mutation | | c.1652N>G | p.His551Arg | p.H551R | Q8WYL5 | protein_coding | tolerated_low_confidence(0.44) | benign(0) | TCGA-A8-A09Z-01 | Breast | breast invasive carcinoma | Female | >=65 | I/II | Unknown | Unknown | SD |
| SSH1 | SNV | Missense_Mutation | novel | c.2216G>T | p.Ser739Ile | p.S739I | Q8WYL5 | protein_coding | deleterious_low_confidence(0) | possibly_damaging(0.454) | TCGA-AN-A0FV-01 | Breast | breast invasive carcinoma | Female | <65 | I/II | Unknown | Unknown | SD |
| SSH1 | SNV | Missense_Mutation | rs774943975 | c.794N>A | p.Ser265Asn | p.S265N | Q8WYL5 | protein_coding | deleterious(0.01) | possibly_damaging(0.588) | TCGA-BH-A0HF-01 | Breast | breast invasive carcinoma | Female | >=65 | I/II | Hormone Therapy | arimidex | SD |
| SSH1 | SNV | Missense_Mutation | novel | c.2170N>A | p.Asp724Asn | p.D724N | Q8WYL5 | protein_coding | deleterious_low_confidence(0.02) | benign(0.056) | TCGA-BH-A0HP-01 | Breast | breast invasive carcinoma | Female | >=65 | III/IV | Chemotherapy | doxorubicin | SD |
| SSH1 | insertion | Frame_Shift_Ins | novel | c.3074_3075insGCTCCCACCGTGTCTTCAAGAAGAACCATGTTTTAGG | p.Ala1026LeufsTer68 | p.A1026Lfs*68 | Q8WYL5 | protein_coding | | | TCGA-A2-A0T2-01 | Breast | breast invasive carcinoma | Female | >=65 | III/IV | Chemotherapy | xeloda | PD |
| SSH1 | insertion | Nonsense_Mutation | novel | c.1217_1218insTTTTTAAAAC | p.Tyr407PhefsTer2 | p.Y407Ffs*2 | Q8WYL5 | protein_coding | | | TCGA-A8-A06O-01 | Breast | breast invasive carcinoma | Female | <65 | I/II | Hormone Therapy | letrozole | SD |
| SSH1 | insertion | In_Frame_Ins | novel | c.1215_1216insAACAAAAAT | p.Ile405_Ala406insAsnLysAsn | p.I405_A406insNKN | Q8WYL5 | protein_coding | | | TCGA-A8-A06O-01 | Breast | breast invasive carcinoma | Female | <65 | I/II | Hormone Therapy | letrozole | SD |
| SSH1 | insertion | Frame_Shift_Ins | novel | c.2082_2083insAGGCTTCTGTTCAGTAATGAATCTGAGAA | p.Ala695ArgfsTer50 | p.A695Rfs*50 | Q8WYL5 | protein_coding | | | TCGA-A8-A08H-01 | Breast | breast invasive carcinoma | Female | >=65 | I/II | Unknown | Unknown | SD |
| SSH1 | insertion | Frame_Shift_Ins | novel | c.2048_2049insC | p.Pro684ThrfsTer80 | p.P684Tfs*80 | Q8WYL5 | protein_coding | | | TCGA-BH-A0AY-01 | Breast | breast invasive carcinoma | Female | <65 | I/II | Chemotherapy | | SD |
| SSH1 | insertion | Nonsense_Mutation | novel | c.2046_2047insATGGCCCTGTAGGAAGAAACTGGGTAAATGTGAAGCC | p.Leu683MetfsTer4 | p.L683Mfs*4 | Q8WYL5 | protein_coding | | | TCGA-BH-A0AY-01 | Breast | breast invasive carcinoma | Female | <65 | I/II | Chemotherapy | | SD |


