
|
|||||
|
 | |
| |
| |
| |
| |
| |
|
Gene: SSBP1 |
Gene summary for SSBP1 |
| Gene information | Species | Human | Gene symbol | SSBP1 | Gene ID | 6742 |
| Gene name | single stranded DNA binding protein 1 | |
| Gene Alias | Mt-SSB | |
| Cytomap | 7q34 | |
| Gene Type | protein-coding | GO ID | GO:0006260 | UniProtAcc | A4D1U3 |
Top |
Malignant transformation analysis |
| Identification of the aberrant gene expression in precancerous and cancerous lesions by comparing the gene expression of stem-like cells in diseased tissues with normal stem cells |
| Entrez ID | Symbol | Replicates | Species | Organ | Tissue | Adj P-value | Log2FC | Malignancy |
| 6742 | SSBP1 | GSM4909282 | Human | Breast | IDC | 3.60e-06 | 3.12e-01 | -0.0288 |
| 6742 | SSBP1 | GSM4909285 | Human | Breast | IDC | 1.06e-12 | 4.38e-01 | 0.21 |
| 6742 | SSBP1 | GSM4909286 | Human | Breast | IDC | 5.61e-07 | 1.52e-01 | 0.1081 |
| 6742 | SSBP1 | GSM4909288 | Human | Breast | IDC | 6.60e-07 | 4.55e-01 | 0.0988 |
| 6742 | SSBP1 | GSM4909293 | Human | Breast | IDC | 1.59e-04 | 2.35e-01 | 0.1581 |
| 6742 | SSBP1 | GSM4909294 | Human | Breast | IDC | 9.99e-10 | 3.09e-01 | 0.2022 |
| 6742 | SSBP1 | GSM4909296 | Human | Breast | IDC | 9.44e-08 | 2.41e-02 | 0.1524 |
| 6742 | SSBP1 | GSM4909297 | Human | Breast | IDC | 4.37e-14 | -2.48e-01 | 0.1517 |
| 6742 | SSBP1 | GSM4909308 | Human | Breast | IDC | 2.28e-02 | 2.44e-01 | 0.158 |
| 6742 | SSBP1 | GSM4909311 | Human | Breast | IDC | 1.25e-34 | -3.84e-01 | 0.1534 |
| 6742 | SSBP1 | GSM4909312 | Human | Breast | IDC | 1.32e-11 | -2.54e-01 | 0.1552 |
| 6742 | SSBP1 | GSM4909313 | Human | Breast | IDC | 5.70e-05 | -2.79e-01 | 0.0391 |
| 6742 | SSBP1 | GSM4909315 | Human | Breast | IDC | 2.07e-41 | 7.85e-01 | 0.21 |
| 6742 | SSBP1 | GSM4909316 | Human | Breast | IDC | 5.35e-22 | 7.28e-01 | 0.21 |
| 6742 | SSBP1 | GSM4909317 | Human | Breast | IDC | 3.19e-06 | 3.37e-01 | 0.1355 |
| 6742 | SSBP1 | GSM4909319 | Human | Breast | IDC | 1.89e-39 | -3.93e-01 | 0.1563 |
| 6742 | SSBP1 | GSM4909320 | Human | Breast | IDC | 1.50e-04 | -2.30e-01 | 0.1575 |
| 6742 | SSBP1 | GSM4909321 | Human | Breast | IDC | 1.08e-14 | -2.21e-01 | 0.1559 |
| 6742 | SSBP1 | brca1 | Human | Breast | Precancer | 6.03e-39 | 7.22e-01 | -0.0338 |
| 6742 | SSBP1 | brca2 | Human | Breast | Precancer | 7.74e-15 | 4.55e-01 | -0.024 |
| Page: 1 2 3 4 5 6 7 8 9 10 11 |
| Tissue | Expression Dynamics | Abbreviation |
| Breast | 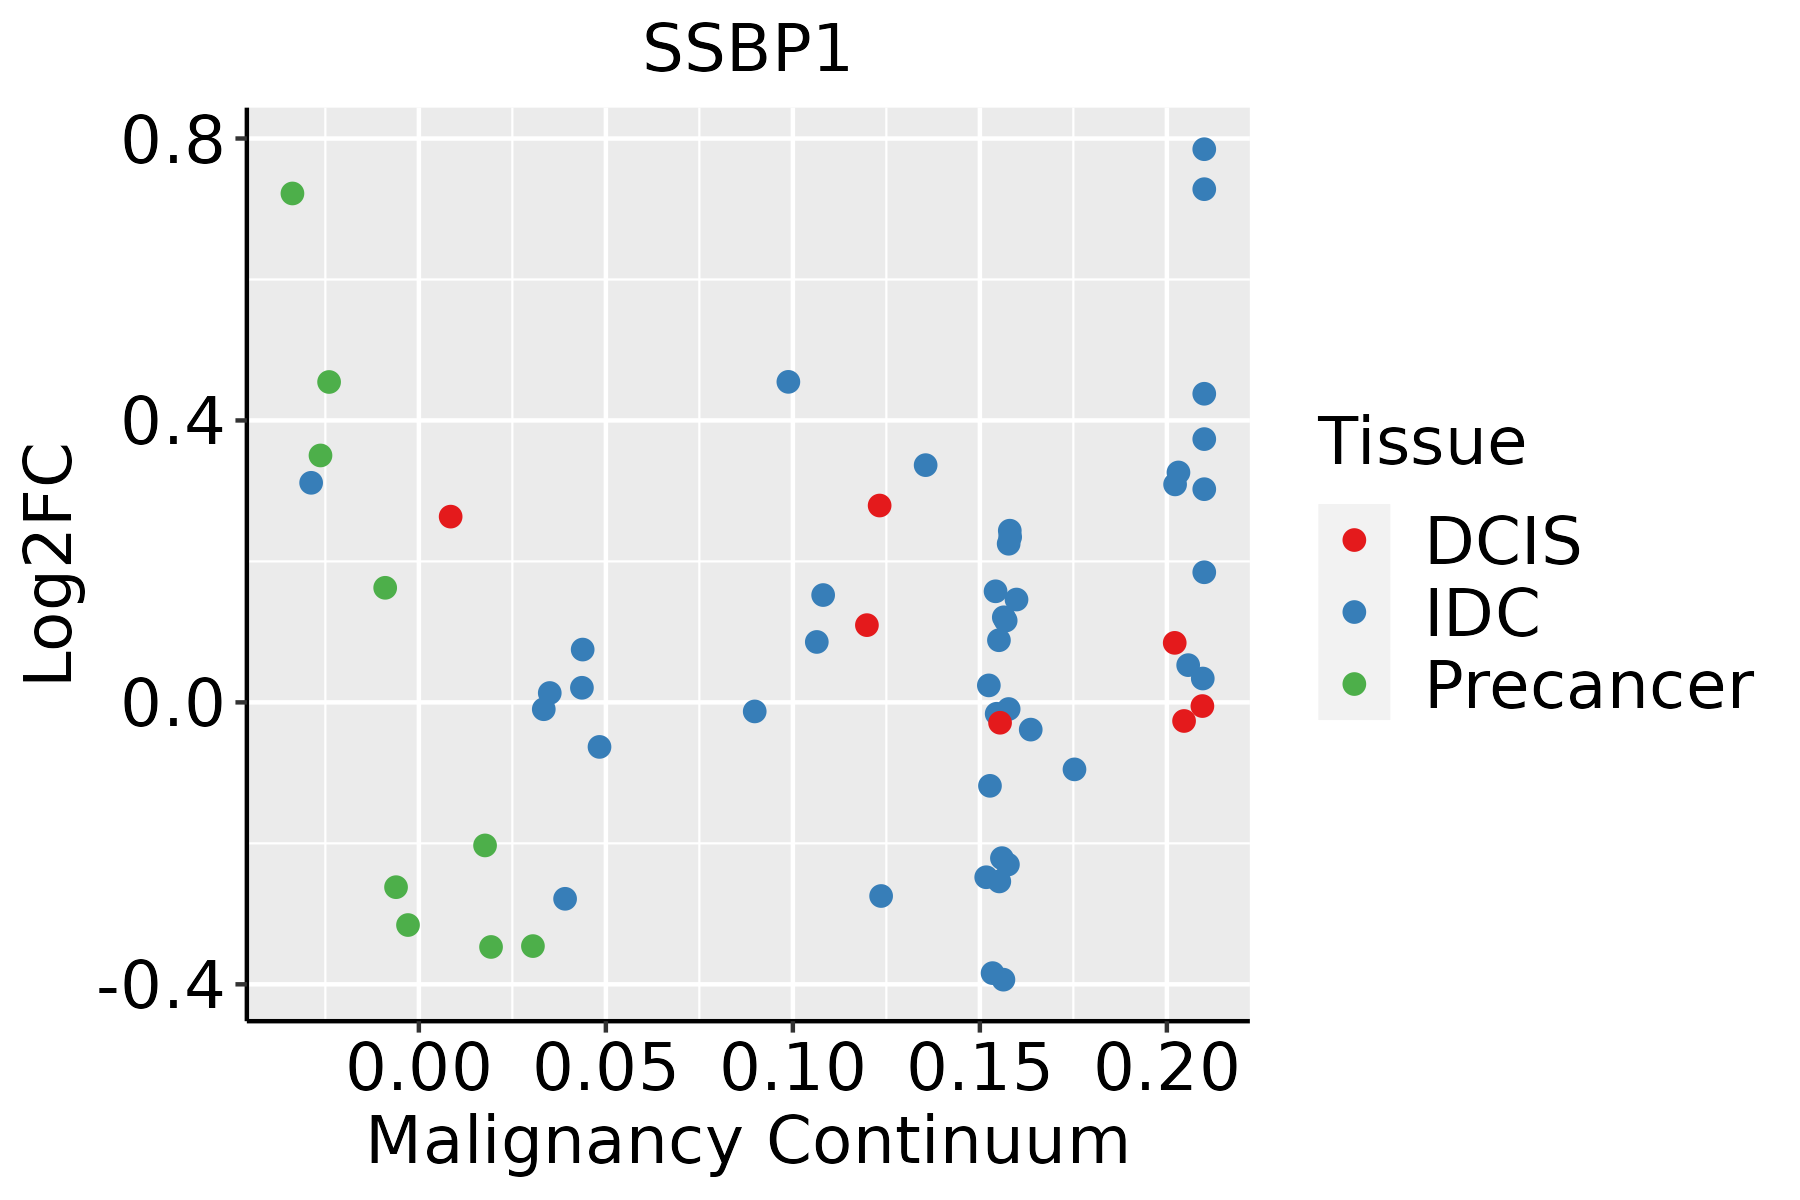 | IDC: Invasive ductal carcinoma |
| DCIS: Ductal carcinoma in situ | ||
| Precancer(BRCA1-mut): Precancerous lesion from BRCA1 mutation carriers | ||
| Cervix |  | CC: Cervix cancer |
| HSIL_HPV: HPV-infected high-grade squamous intraepithelial lesions | ||
| N_HPV: HPV-infected normal cervix | ||
| Colorectum (GSE201348) |  | FAP: Familial adenomatous polyposis |
| CRC: Colorectal cancer | ||
| Colorectum (HTA11) |  | AD: Adenomas |
| SER: Sessile serrated lesions | ||
| MSI-H: Microsatellite-high colorectal cancer | ||
| MSS: Microsatellite stable colorectal cancer | ||
| Endometrium |  | AEH: Atypical endometrial hyperplasia |
| EEC: Endometrioid Cancer | ||
| Esophagus |  | ESCC: Esophageal squamous cell carcinoma |
| HGIN: High-grade intraepithelial neoplasias | ||
| LGIN: Low-grade intraepithelial neoplasias | ||
| Liver | 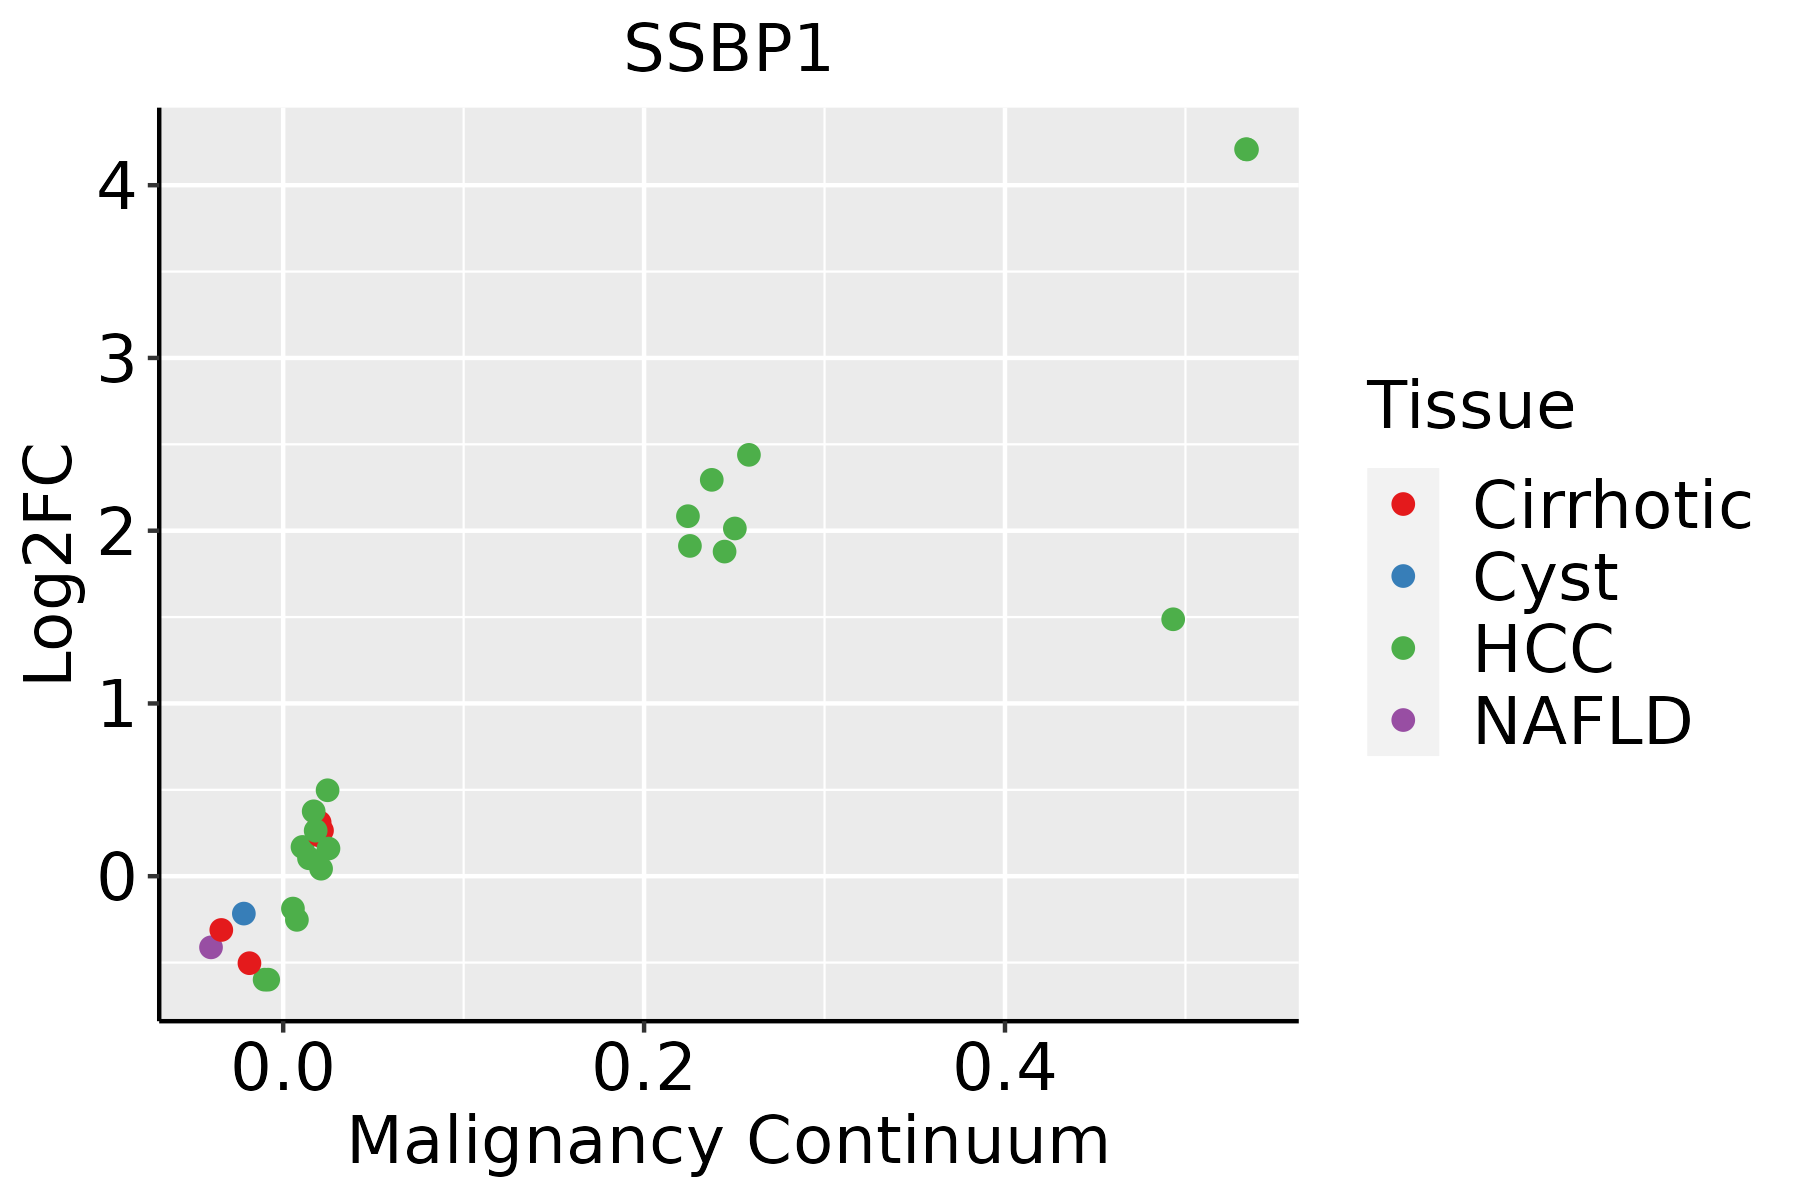 | HCC: Hepatocellular carcinoma |
| NAFLD: Non-alcoholic fatty liver disease | ||
| Oral Cavity | 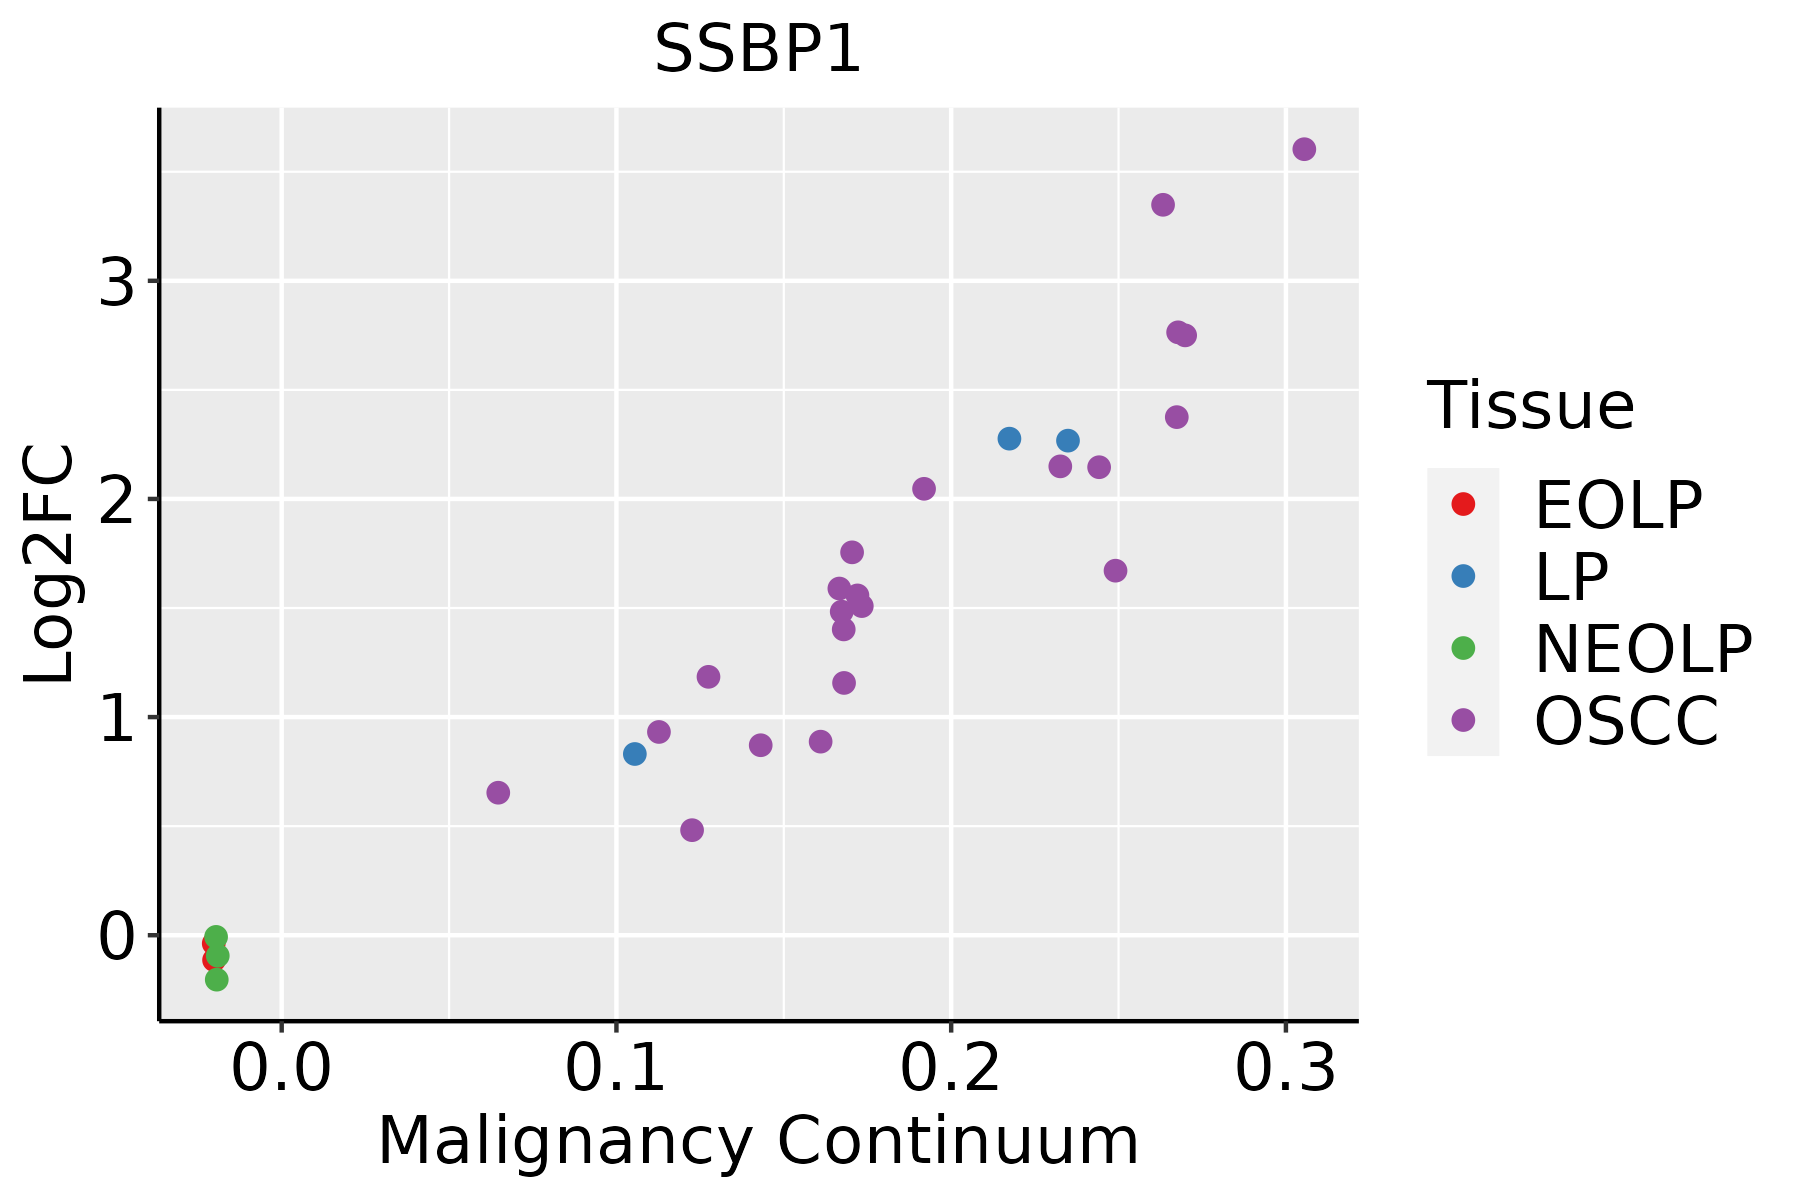 | EOLP: Erosive Oral lichen planus |
| LP: leukoplakia | ||
| NEOLP: Non-erosive oral lichen planus | ||
| OSCC: Oral squamous cell carcinoma | ||
| Prostate | 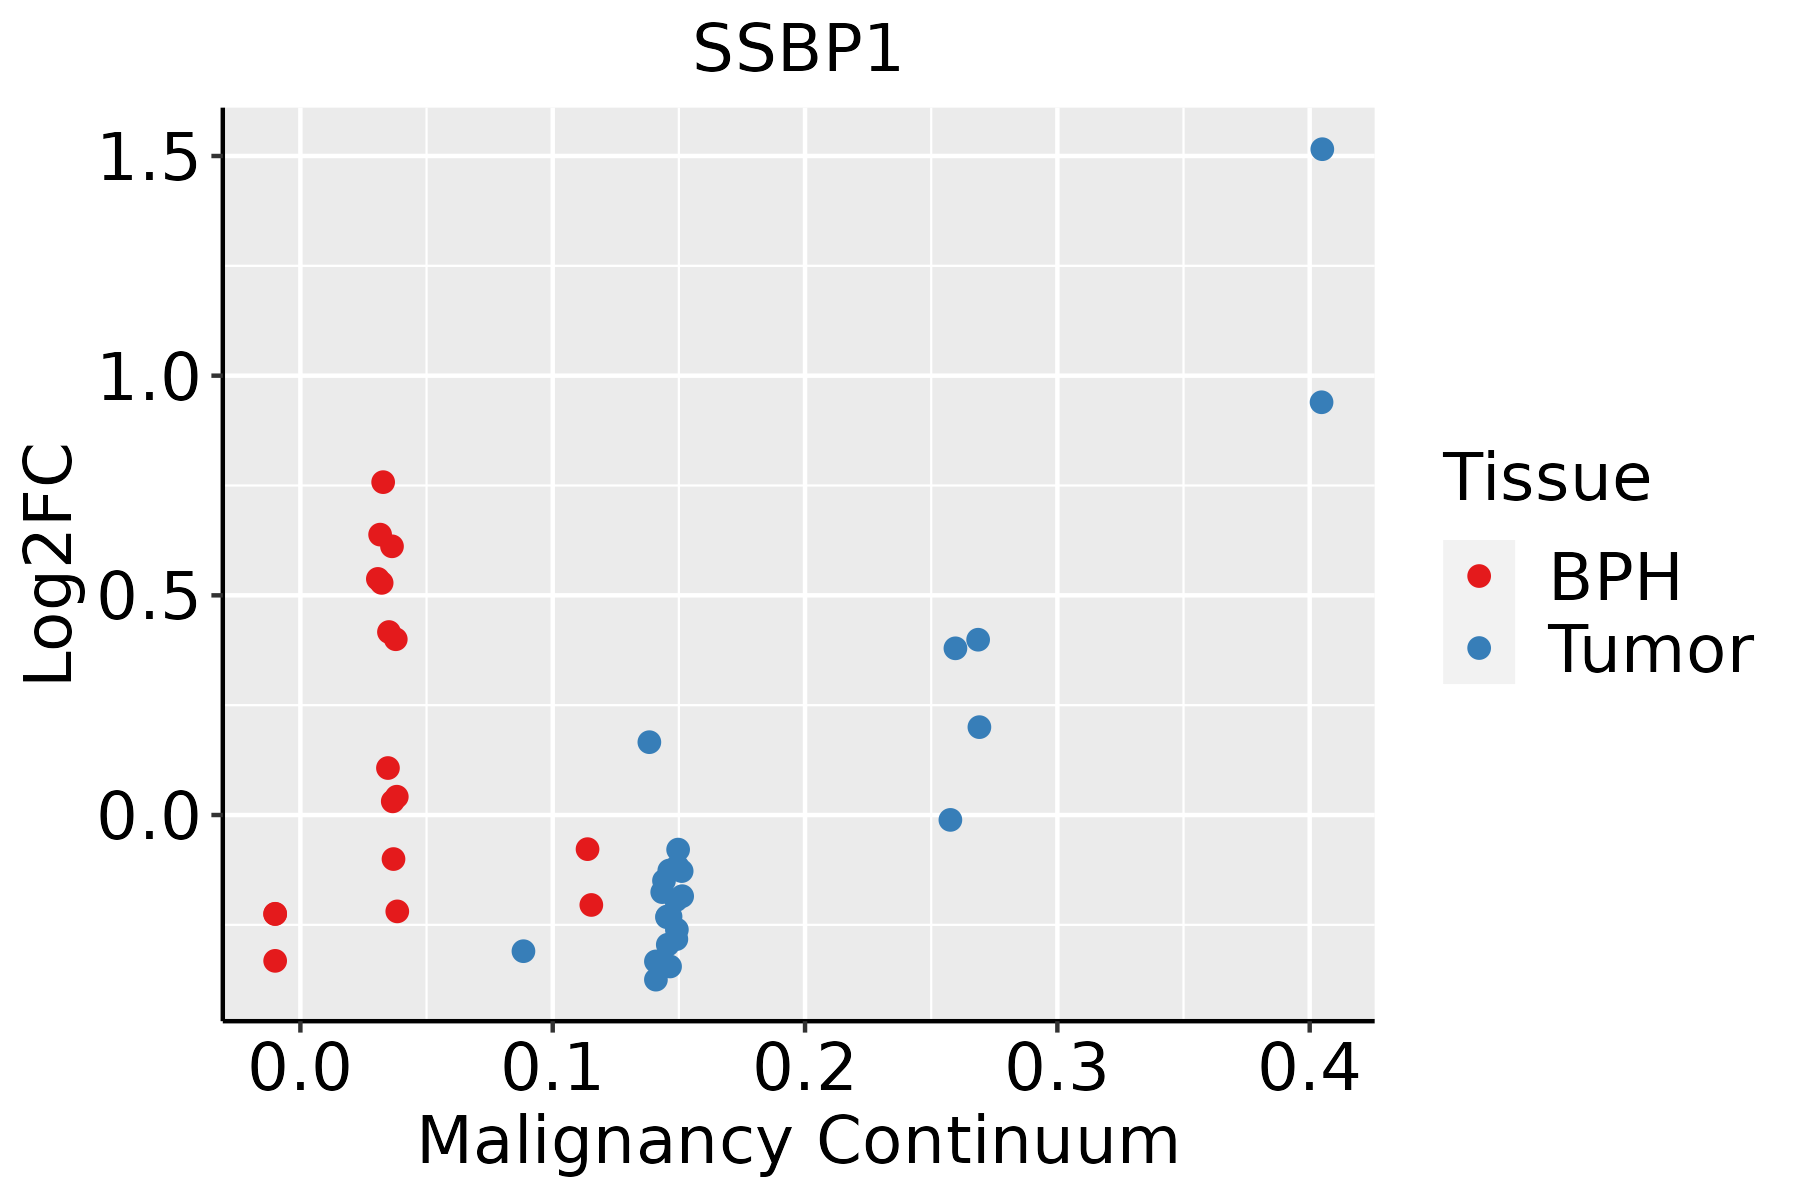 | BPH: Benign Prostatic Hyperplasia |
| Skin | 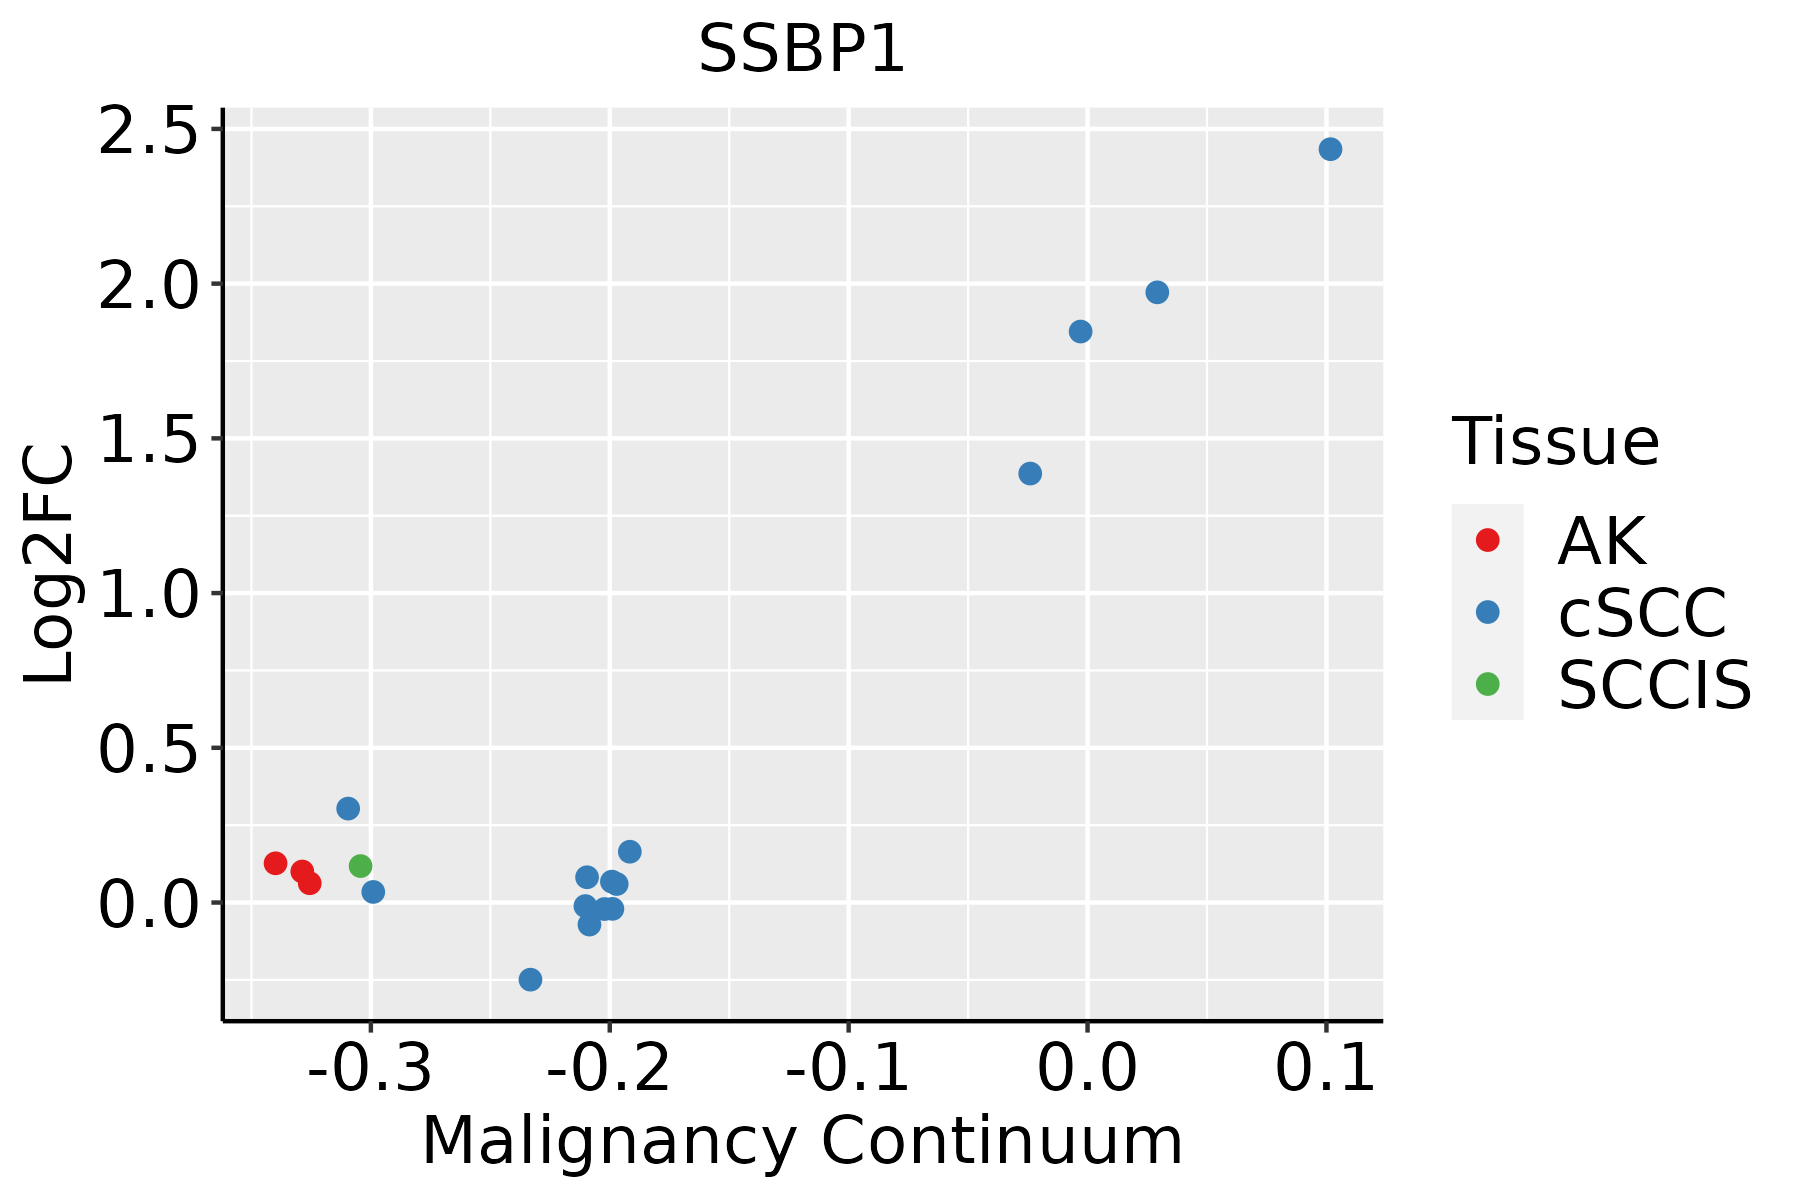 | AK: Actinic keratosis |
| cSCC: Cutaneous squamous cell carcinoma | ||
| SCCIS:squamous cell carcinoma in situ | ||
| Thyroid |  | ATC: Anaplastic thyroid cancer |
| HT: Hashimoto's thyroiditis | ||
| PTC: Papillary thyroid cancer |
| ∗log2FC in expression of this searched gene in stem-like cells from each diseased tissue sample relative to stem-like cells in normal samples in each tissue plotted against the malignancy continuum. Samples are colored based on if they are from different disease stage. |
Top |
Malignant transformation related pathway analysis |
| Find out the enriched GO biological processes and KEGG pathways involved in transition from healthy to precancer to cancer |
| Tissue | Disease Stage | Enriched GO biological Processes |
| Colorectum | AD |  |
| Colorectum | SER |  |
| Colorectum | MSS |  |
| Colorectum | MSI-H |  |
| Colorectum | FAP |  |
| ∗Top 15 enriched GO BP terms are showed in the bar plot of each disease state in each tissue. Each row represents a significant GO biological process which is colored according to the -log10(p.adjust). |
| Page: 1 2 3 4 5 6 7 8 9 |
| GO ID | Tissue | Disease Stage | Description | Gene Ratio | Bg Ratio | pvalue | p.adjust | Count |
| GO:00457403 | Breast | Precancer | positive regulation of DNA replication | 8/1080 | 40/18723 | 1.76e-03 | 1.74e-02 | 8 |
| GO:20012529 | Breast | Precancer | positive regulation of chromosome organization | 12/1080 | 82/18723 | 2.51e-03 | 2.29e-02 | 12 |
| GO:200125212 | Breast | IDC | positive regulation of chromosome organization | 15/1434 | 82/18723 | 1.28e-03 | 1.35e-02 | 15 |
| GO:00330445 | Breast | IDC | regulation of chromosome organization | 26/1434 | 187/18723 | 2.22e-03 | 2.06e-02 | 26 |
| GO:00457401 | Breast | IDC | positive regulation of DNA replication | 9/1434 | 40/18723 | 2.76e-03 | 2.42e-02 | 9 |
| GO:200125221 | Breast | DCIS | positive regulation of chromosome organization | 15/1390 | 82/18723 | 9.37e-04 | 1.06e-02 | 15 |
| GO:003304412 | Breast | DCIS | regulation of chromosome organization | 26/1390 | 187/18723 | 1.44e-03 | 1.47e-02 | 26 |
| GO:00457402 | Breast | DCIS | positive regulation of DNA replication | 9/1390 | 40/18723 | 2.23e-03 | 2.04e-02 | 9 |
| GO:00457404 | Cervix | CC | positive regulation of DNA replication | 12/2311 | 40/18723 | 2.44e-03 | 1.71e-02 | 12 |
| GO:00062602 | Cervix | CC | DNA replication | 48/2311 | 260/18723 | 2.70e-03 | 1.85e-02 | 48 |
| GO:00323923 | Cervix | CC | DNA geometric change | 21/2311 | 90/18723 | 2.71e-03 | 1.85e-02 | 21 |
| GO:20012522 | Colorectum | MSS | positive regulation of chromosome organization | 33/3467 | 82/18723 | 3.72e-06 | 1.07e-04 | 33 |
| GO:00705842 | Colorectum | MSS | mitochondrion morphogenesis | 12/3467 | 21/18723 | 8.83e-05 | 1.41e-03 | 12 |
| GO:00330441 | Colorectum | MSS | regulation of chromosome organization | 55/3467 | 187/18723 | 1.86e-04 | 2.63e-03 | 55 |
| GO:00323921 | Colorectum | MSS | DNA geometric change | 29/3467 | 90/18723 | 1.26e-03 | 1.20e-02 | 29 |
| GO:0032508 | Colorectum | MSS | DNA duplex unwinding | 25/3467 | 84/18723 | 8.27e-03 | 4.99e-02 | 25 |
| GO:20012524 | Colorectum | FAP | positive regulation of chromosome organization | 26/2622 | 82/18723 | 3.21e-05 | 7.20e-04 | 26 |
| GO:00330442 | Colorectum | FAP | regulation of chromosome organization | 46/2622 | 187/18723 | 7.41e-05 | 1.36e-03 | 46 |
| GO:00705843 | Colorectum | FAP | mitochondrion morphogenesis | 9/2622 | 21/18723 | 1.22e-03 | 1.14e-02 | 9 |
| GO:20012525 | Colorectum | CRC | positive regulation of chromosome organization | 21/2078 | 82/18723 | 1.82e-04 | 3.20e-03 | 21 |
| Page: 1 2 3 4 5 6 |
| Pathway ID | Tissue | Disease Stage | Description | Gene Ratio | Bg Ratio | pvalue | p.adjust | qvalue | Count |
| hsa030304 | Esophagus | ESCC | DNA replication | 32/4205 | 36/8465 | 7.71e-07 | 5.06e-06 | 2.59e-06 | 32 |
| hsa034304 | Esophagus | ESCC | Mismatch repair | 21/4205 | 23/8465 | 2.85e-05 | 1.35e-04 | 6.90e-05 | 21 |
| hsa0303011 | Esophagus | ESCC | DNA replication | 32/4205 | 36/8465 | 7.71e-07 | 5.06e-06 | 2.59e-06 | 32 |
| hsa0343011 | Esophagus | ESCC | Mismatch repair | 21/4205 | 23/8465 | 2.85e-05 | 1.35e-04 | 6.90e-05 | 21 |
| hsa03030 | Oral cavity | OSCC | DNA replication | 31/3704 | 36/8465 | 1.70e-07 | 1.19e-06 | 6.03e-07 | 31 |
| hsa03430 | Oral cavity | OSCC | Mismatch repair | 19/3704 | 23/8465 | 1.55e-04 | 5.34e-04 | 2.72e-04 | 19 |
| hsa030301 | Oral cavity | OSCC | DNA replication | 31/3704 | 36/8465 | 1.70e-07 | 1.19e-06 | 6.03e-07 | 31 |
| hsa034301 | Oral cavity | OSCC | Mismatch repair | 19/3704 | 23/8465 | 1.55e-04 | 5.34e-04 | 2.72e-04 | 19 |
| hsa030302 | Oral cavity | LP | DNA replication | 23/2418 | 36/8465 | 1.08e-05 | 7.79e-05 | 5.02e-05 | 23 |
| hsa034302 | Oral cavity | LP | Mismatch repair | 12/2418 | 23/8465 | 1.43e-02 | 4.59e-02 | 2.96e-02 | 12 |
| hsa030303 | Oral cavity | LP | DNA replication | 23/2418 | 36/8465 | 1.08e-05 | 7.79e-05 | 5.02e-05 | 23 |
| hsa034303 | Oral cavity | LP | Mismatch repair | 12/2418 | 23/8465 | 1.43e-02 | 4.59e-02 | 2.96e-02 | 12 |
| Page: 1 |
Top |
Cell-cell communication analysis |
| Identification of potential cell-cell interactions between two cell types and their ligand-receptor pairs for different disease states |
| Ligand | Receptor | LRpair | Pathway | Tissue | Disease Stage |
| Page: 1 |
Top |
Single-cell gene regulatory network inference analysis |
| Find out the significant the regulons (TFs) and the target genes of each regulon across cell types for different disease states |
| TF | Cell Type | Tissue | Disease Stage | Target Gene | RSS | Regulon Activity |
| ∗The dot plots of a searched regulon are shown for all cell subpopulations in each disease state of each tissue based on the regulon specific score inferred using pySCENIC and by calculating the average expression. |
| Page: 1 |
Top |
Somatic mutation of malignant transformation related genes |
| Annotation of somatic variants for genes involved in malignant transformation |
| Hugo Symbol | Variant Class | Variant Classification | dbSNP RS | HGVSc | HGVSp | HGVSp Short | SWISSPROT | BIOTYPE | SIFT | PolyPhen | Tumor Sample Barcode | Tissue | Histology | Sex | Age | Stage | Therapy Types | Drugs | Outcome |
| SSBP1 | SNV | Missense_Mutation | novel | c.311N>G | p.Lys104Arg | p.K104R | Q04837 | protein_coding | deleterious(0.03) | possibly_damaging(0.872) | TCGA-3C-AAAU-01 | Breast | breast invasive carcinoma | Female | <65 | I/II | Chemotherapy | zoladex | SD |
| SSBP1 | SNV | Missense_Mutation | c.320G>A | p.Arg107Gln | p.R107Q | Q04837 | protein_coding | tolerated(0.06) | benign(0.282) | TCGA-AN-A046-01 | Breast | breast invasive carcinoma | Female | >=65 | I/II | Unknown | Unknown | SD | |
| SSBP1 | SNV | Missense_Mutation | rs774947843 | c.94C>T | p.Arg32Cys | p.R32C | Q04837 | protein_coding | deleterious(0.03) | probably_damaging(0.969) | TCGA-2W-A8YY-01 | Cervix | cervical & endocervical cancer | Female | <65 | I/II | Chemotherapy | cisplatin | CR |
| SSBP1 | SNV | Missense_Mutation | c.250T>C | p.Trp84Arg | p.W84R | Q04837 | protein_coding | tolerated(0.11) | probably_damaging(1) | TCGA-AA-3710-01 | Colorectum | colon adenocarcinoma | Female | >=65 | I/II | Unknown | Unknown | SD | |
| SSBP1 | SNV | Missense_Mutation | c.128N>A | p.Pro43His | p.P43H | Q04837 | protein_coding | deleterious(0) | probably_damaging(0.997) | TCGA-AY-6197-01 | Colorectum | colon adenocarcinoma | Male | <65 | I/II | Unknown | Unknown | SD | |
| SSBP1 | SNV | Missense_Mutation | c.314N>T | p.Gly105Val | p.G105V | Q04837 | protein_coding | deleterious(0) | probably_damaging(0.963) | TCGA-AZ-4313-01 | Colorectum | colon adenocarcinoma | Female | <65 | I/II | Unknown | Unknown | SD | |
| SSBP1 | SNV | Missense_Mutation | rs760601343 | c.271C>T | p.Arg91Trp | p.R91W | Q04837 | protein_coding | tolerated(0.07) | possibly_damaging(0.907) | TCGA-A5-A0G2-01 | Endometrium | uterine corpus endometrioid carcinoma | Female | <65 | III/IV | Unknown | Unknown | SD |
| SSBP1 | SNV | Missense_Mutation | c.320N>A | p.Arg107Gln | p.R107Q | Q04837 | protein_coding | tolerated(0.06) | benign(0.282) | TCGA-A5-A0GP-01 | Endometrium | uterine corpus endometrioid carcinoma | Female | <65 | I/II | Unknown | Unknown | SD | |
| SSBP1 | SNV | Missense_Mutation | novel | c.86C>T | p.Ser29Phe | p.S29F | Q04837 | protein_coding | deleterious(0) | probably_damaging(0.989) | TCGA-A5-A1OF-01 | Endometrium | uterine corpus endometrioid carcinoma | Female | <65 | I/II | Unknown | Unknown | SD |
| SSBP1 | SNV | Missense_Mutation | rs767820643 | c.31C>T | p.Arg11Cys | p.R11C | Q04837 | protein_coding | deleterious(0.04) | benign(0.003) | TCGA-AP-A056-01 | Endometrium | uterine corpus endometrioid carcinoma | Female | <65 | I/II | Unknown | Unknown | SD |
| Page: 1 2 3 |
Top |
Related drugs of malignant transformation related genes |
| Identification of chemicals and drugs interact with genes involved in malignant transfromation |
| (DGIdb 4.0) |
| Entrez ID | Symbol | Category | Interaction Types | Drug Claim Name | Drug Name | PMIDs |
| Page: 1 |

Copyright 2023-Present -The University of Texas Health Science Center at Houston |