
|
|||||
|
 | |
| |
| |
| |
| |
| |
|
Gene: SSB |
Gene summary for SSB |
| Gene information | Species | Human | Gene symbol | SSB | Gene ID | 6741 |
| Gene name | small RNA binding exonuclease protection factor La | |
| Gene Alias | LARP3 | |
| Cytomap | 2q31.1 | |
| Gene Type | protein-coding | GO ID | GO:0000956 | UniProtAcc | P05455 |
Top |
Malignant transformation analysis |
| Identification of the aberrant gene expression in precancerous and cancerous lesions by comparing the gene expression of stem-like cells in diseased tissues with normal stem cells |
| Entrez ID | Symbol | Replicates | Species | Organ | Tissue | Adj P-value | Log2FC | Malignancy |
| 6741 | SSB | CA_HPV_1 | Human | Cervix | CC | 1.95e-06 | -7.50e-02 | 0.0264 |
| 6741 | SSB | CCI_1 | Human | Cervix | CC | 2.89e-07 | -5.70e-01 | 0.528 |
| 6741 | SSB | CCI_2 | Human | Cervix | CC | 1.35e-03 | -4.83e-01 | 0.5249 |
| 6741 | SSB | CCI_3 | Human | Cervix | CC | 2.35e-07 | -5.14e-01 | 0.516 |
| 6741 | SSB | CCII_1 | Human | Cervix | CC | 3.96e-16 | -5.94e-01 | 0.3249 |
| 6741 | SSB | sample3 | Human | Cervix | CC | 2.70e-03 | -2.60e-01 | 0.1387 |
| 6741 | SSB | L1 | Human | Cervix | CC | 1.82e-09 | -3.65e-01 | 0.0802 |
| 6741 | SSB | T1 | Human | Cervix | CC | 4.04e-05 | -3.02e-01 | 0.0918 |
| 6741 | SSB | T3 | Human | Cervix | CC | 1.46e-02 | -2.63e-01 | 0.1389 |
| 6741 | SSB | AEH-subject1 | Human | Endometrium | AEH | 2.29e-18 | -5.09e-01 | -0.3059 |
| 6741 | SSB | AEH-subject2 | Human | Endometrium | AEH | 1.32e-21 | -5.38e-01 | -0.2525 |
| 6741 | SSB | AEH-subject3 | Human | Endometrium | AEH | 6.38e-16 | -3.80e-01 | -0.2576 |
| 6741 | SSB | AEH-subject4 | Human | Endometrium | AEH | 8.29e-06 | -3.56e-01 | -0.2657 |
| 6741 | SSB | AEH-subject5 | Human | Endometrium | AEH | 3.25e-12 | -4.34e-01 | -0.2953 |
| 6741 | SSB | EEC-subject1 | Human | Endometrium | EEC | 4.96e-16 | -4.13e-01 | -0.2682 |
| 6741 | SSB | EEC-subject2 | Human | Endometrium | EEC | 3.66e-24 | -5.05e-01 | -0.2607 |
| 6741 | SSB | EEC-subject3 | Human | Endometrium | EEC | 4.89e-53 | -5.03e-01 | -0.2525 |
| 6741 | SSB | EEC-subject4 | Human | Endometrium | EEC | 7.89e-10 | -2.88e-01 | -0.2571 |
| 6741 | SSB | EEC-subject5 | Human | Endometrium | EEC | 2.53e-08 | -2.98e-01 | -0.249 |
| 6741 | SSB | GSM6177620_NYU_UCEC1_lib1_lib1 | Human | Endometrium | EEC | 1.93e-33 | -2.89e-01 | -0.1869 |
| Page: 1 2 3 4 5 6 7 8 9 |
| Tissue | Expression Dynamics | Abbreviation |
| Cervix | 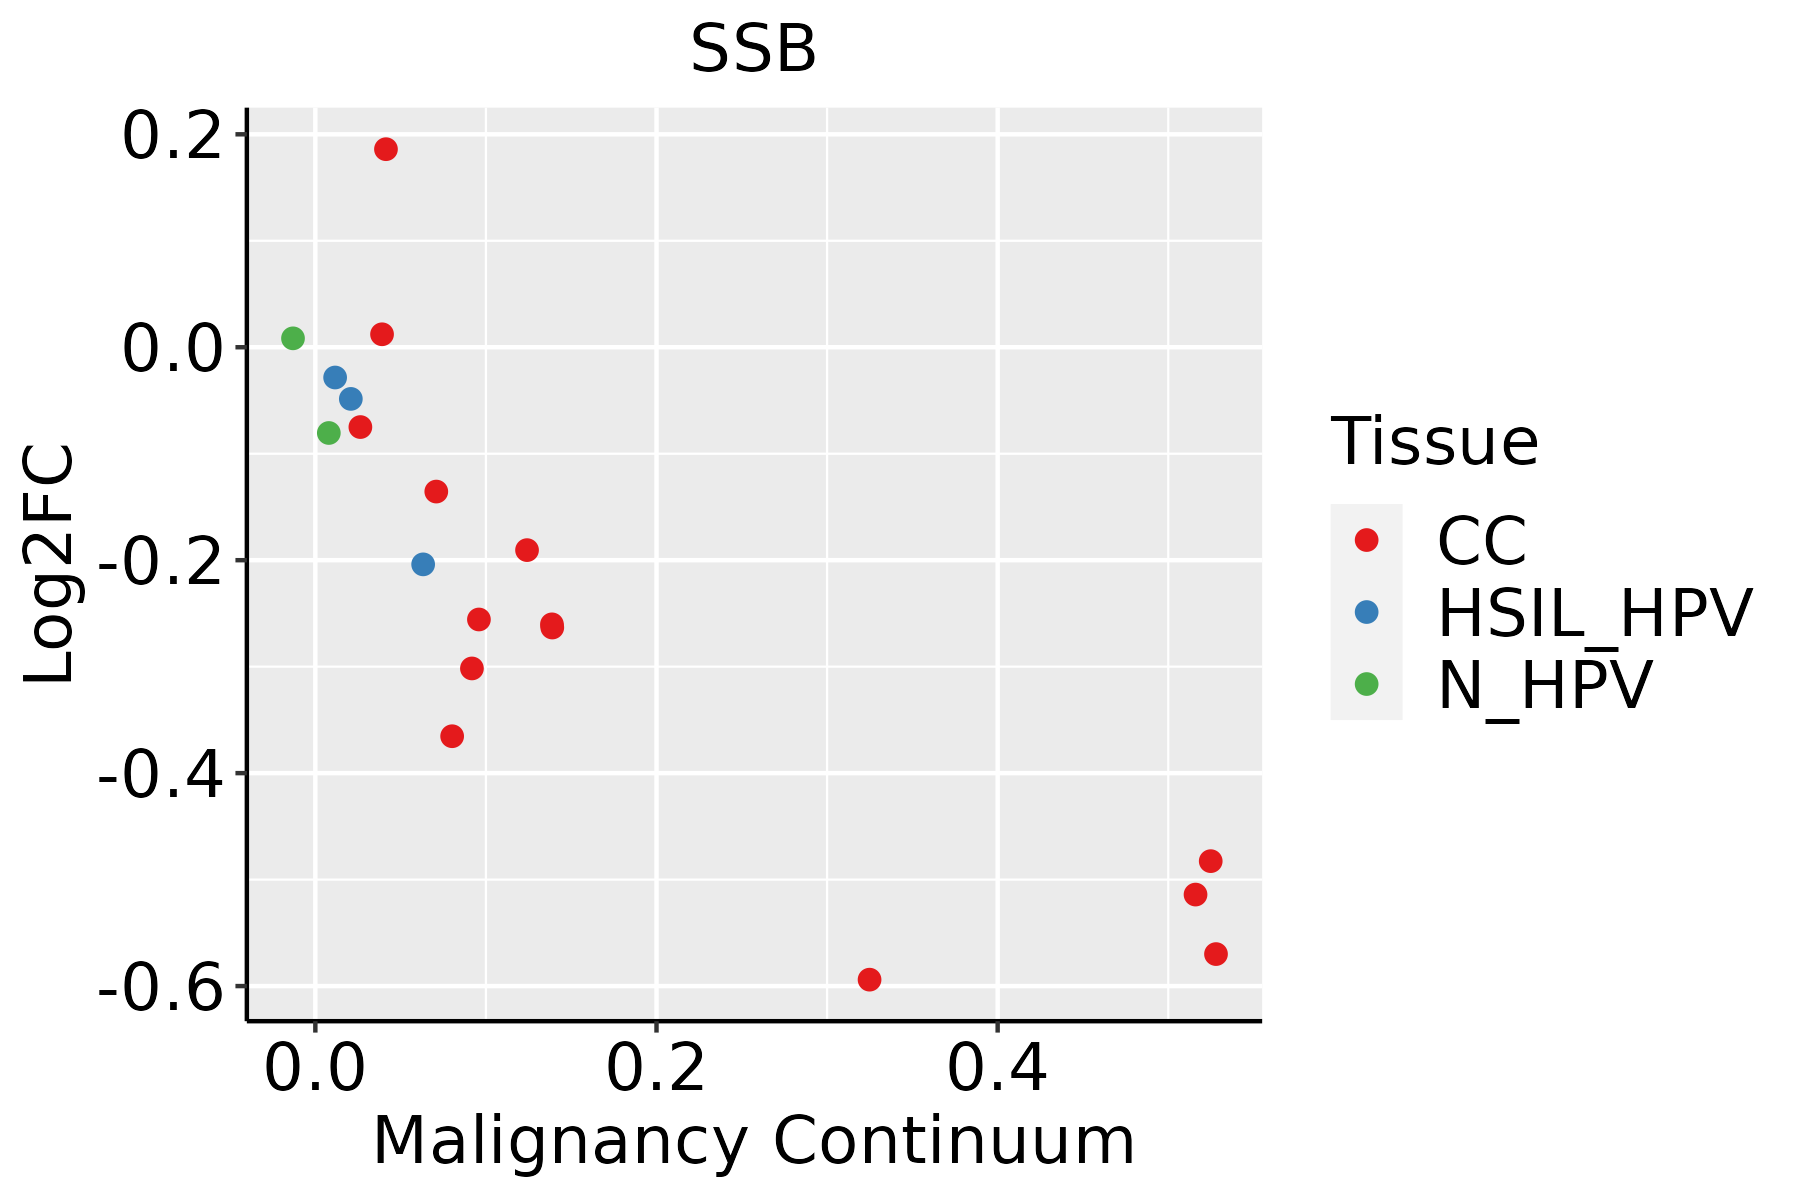 | CC: Cervix cancer |
| HSIL_HPV: HPV-infected high-grade squamous intraepithelial lesions | ||
| N_HPV: HPV-infected normal cervix | ||
| Endometrium |  | AEH: Atypical endometrial hyperplasia |
| EEC: Endometrioid Cancer | ||
| Esophagus | 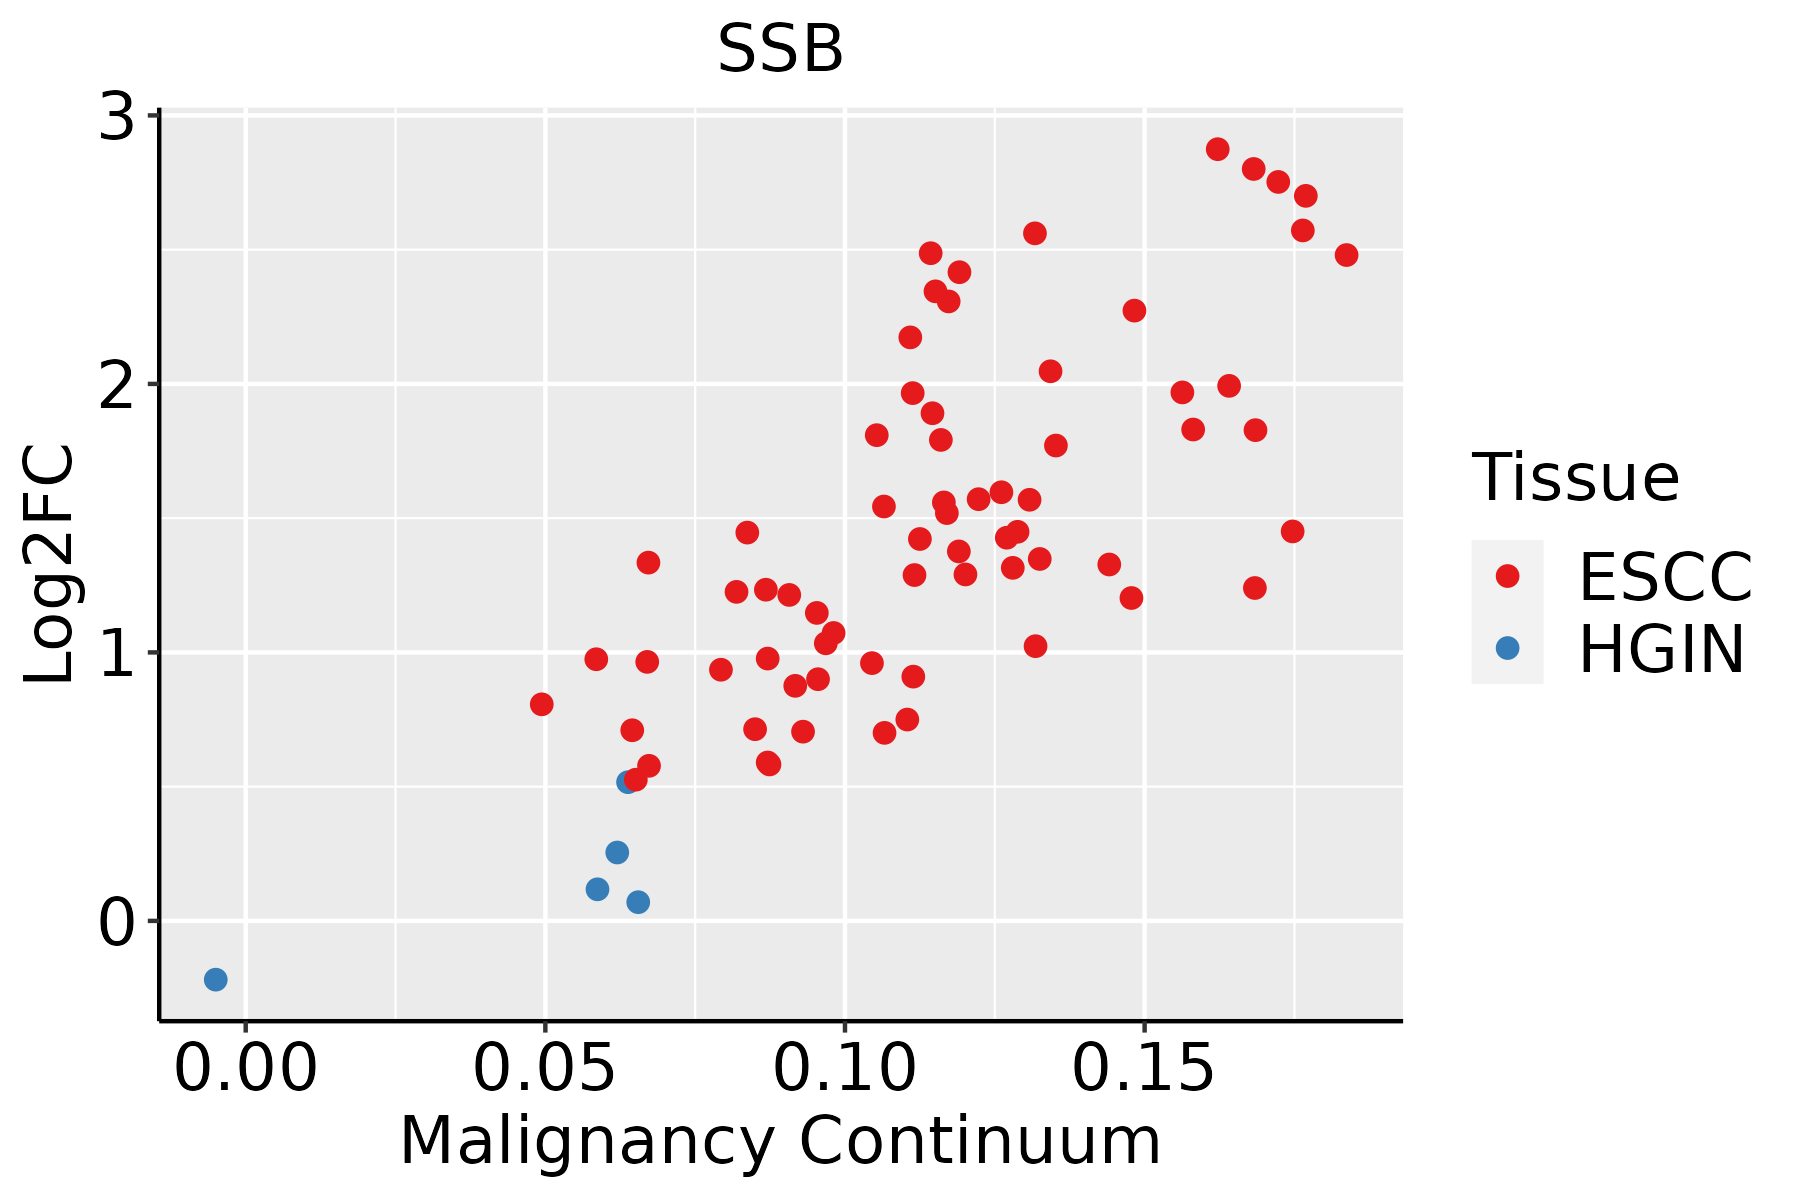 | ESCC: Esophageal squamous cell carcinoma |
| HGIN: High-grade intraepithelial neoplasias | ||
| LGIN: Low-grade intraepithelial neoplasias | ||
| Liver | 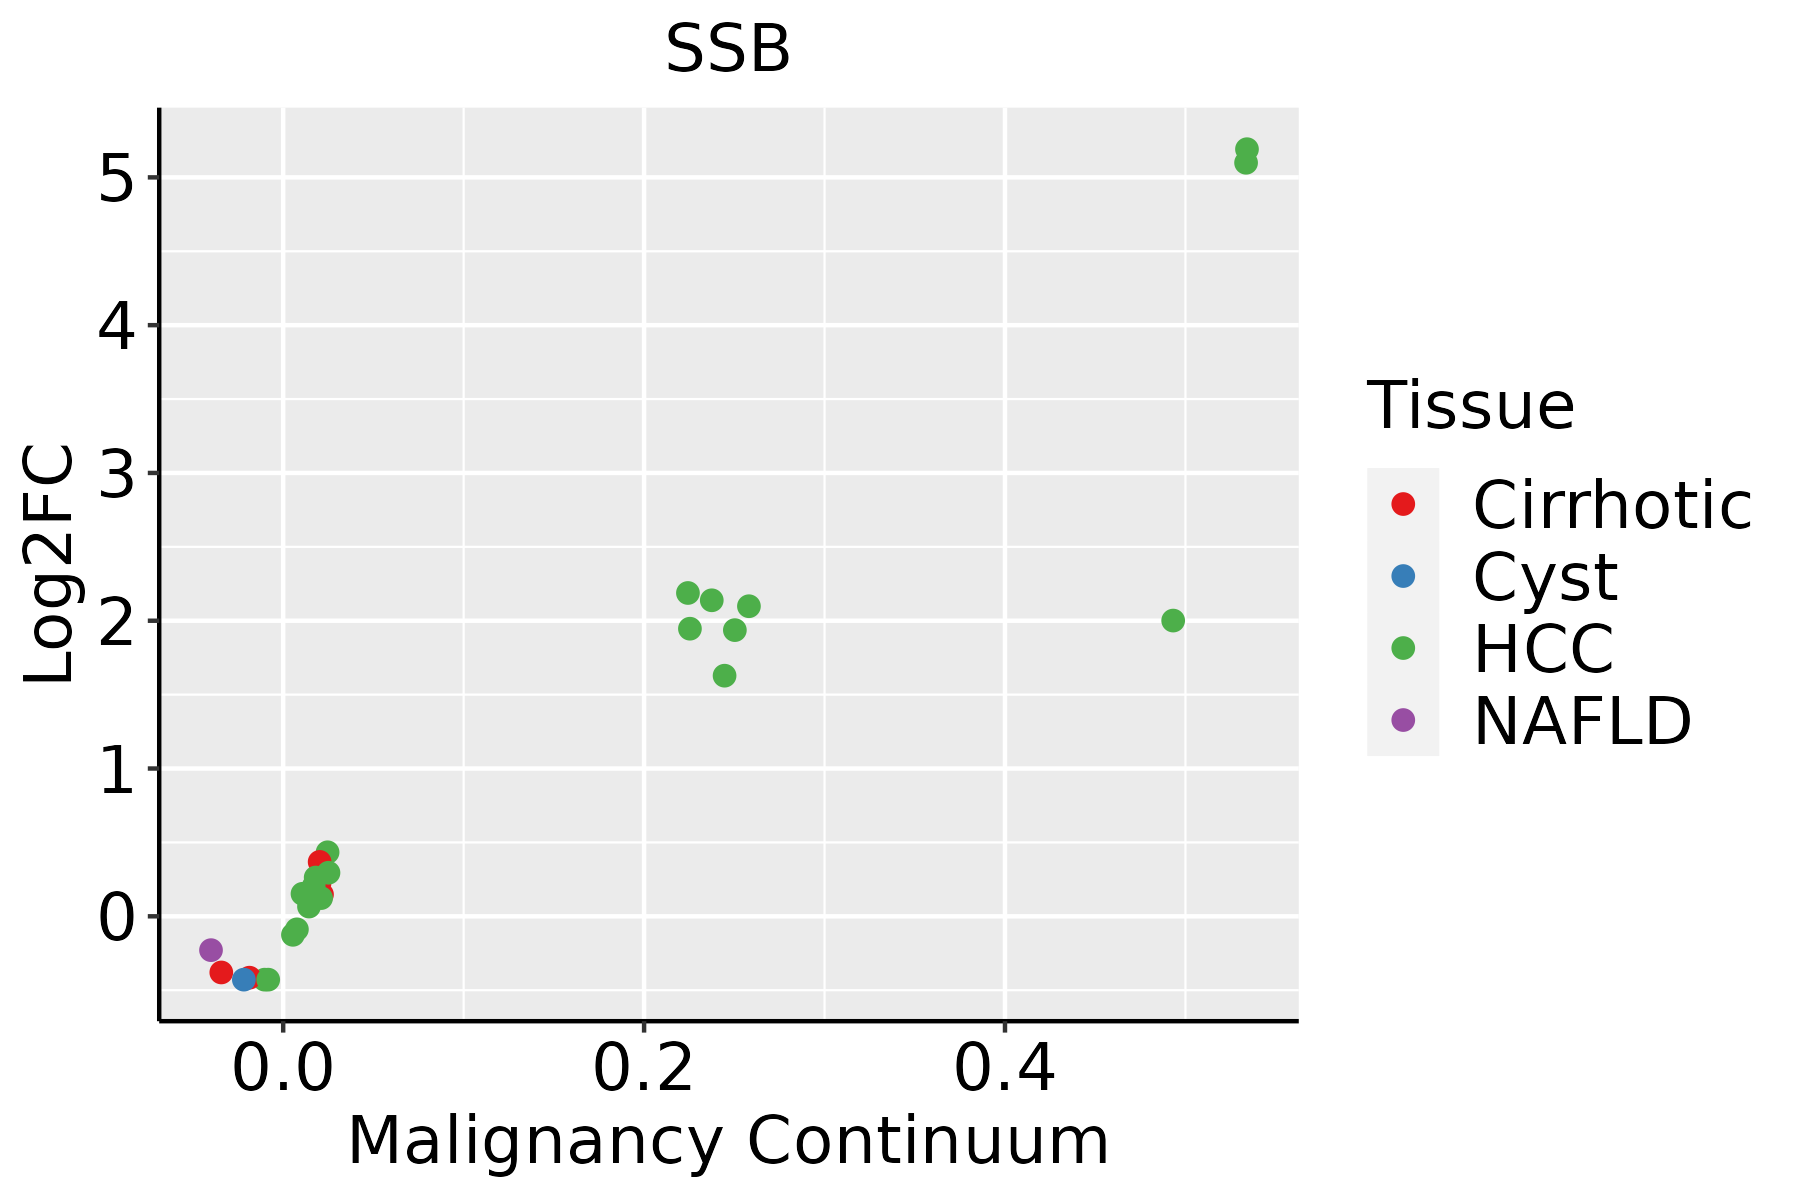 | HCC: Hepatocellular carcinoma |
| NAFLD: Non-alcoholic fatty liver disease | ||
| Oral Cavity | 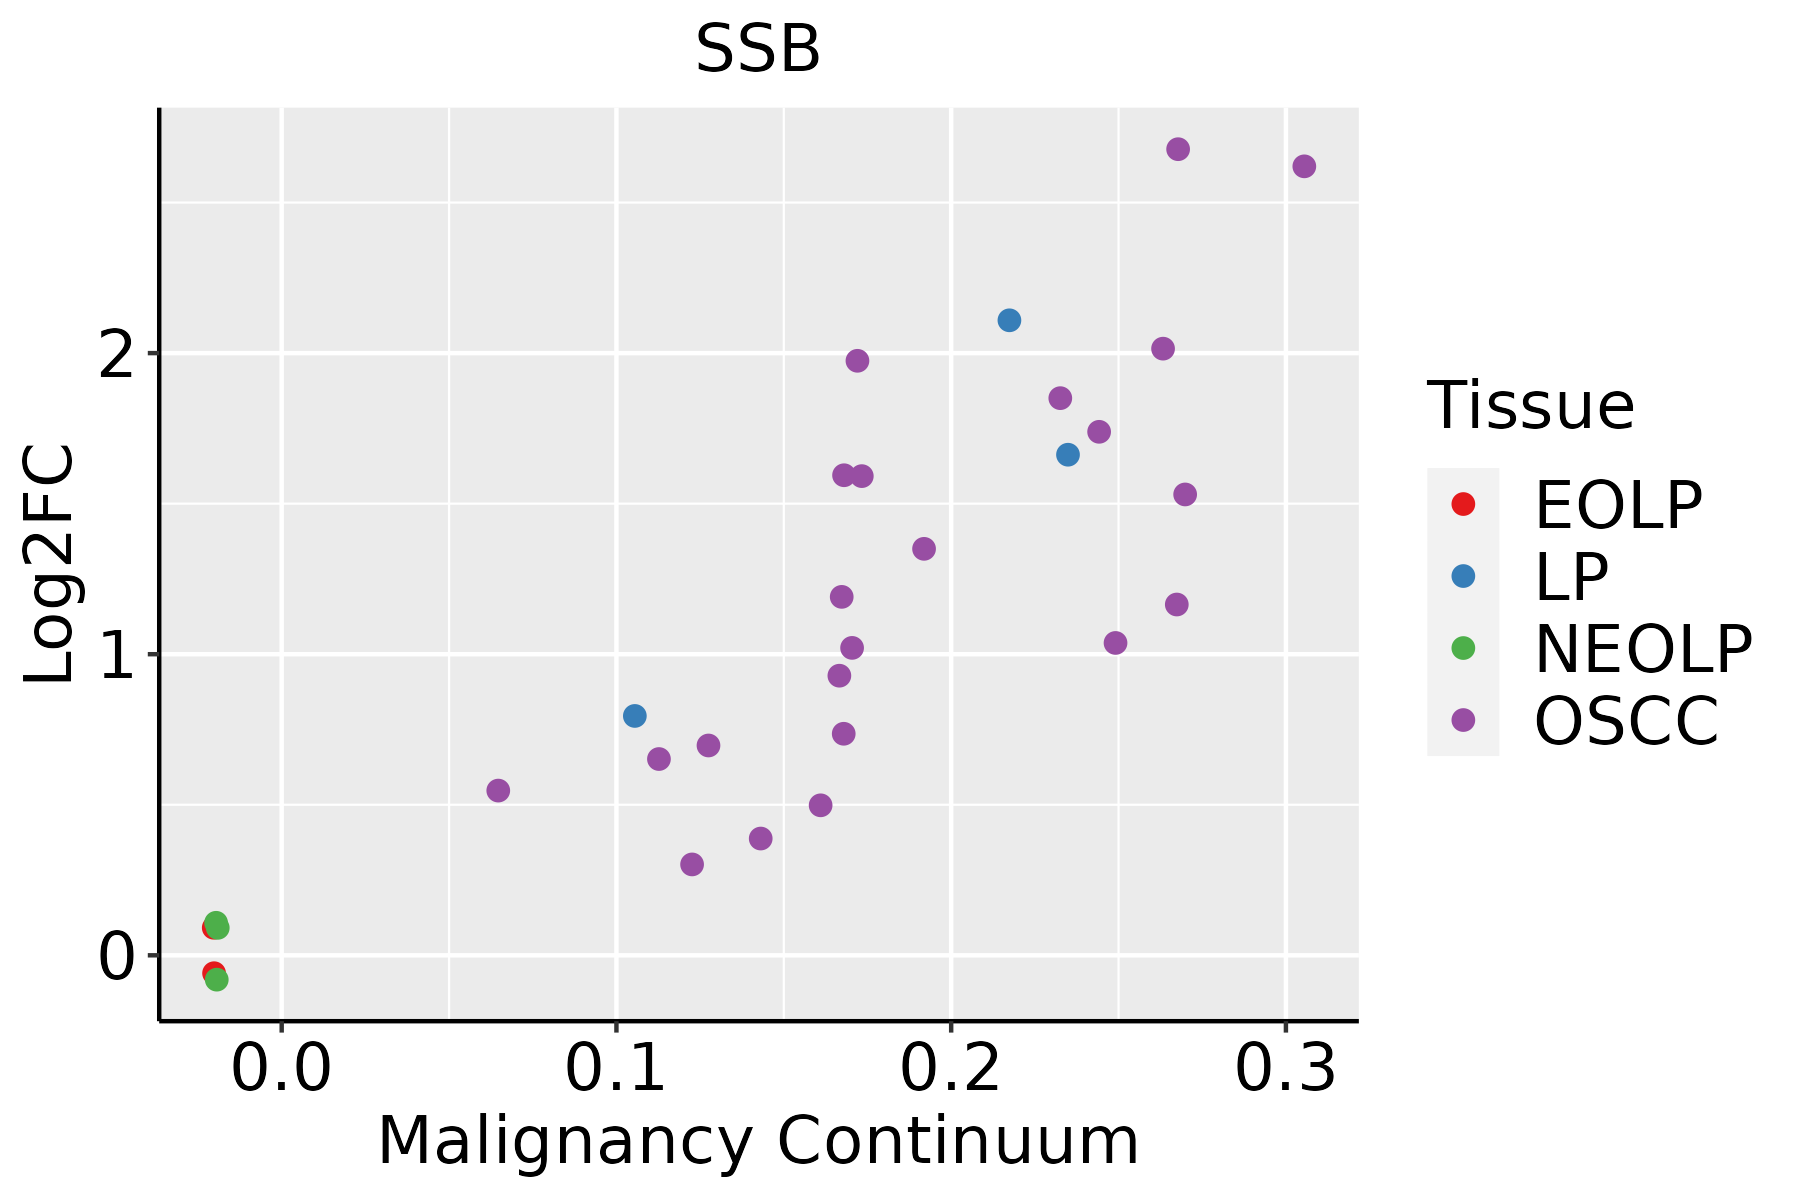 | EOLP: Erosive Oral lichen planus |
| LP: leukoplakia | ||
| NEOLP: Non-erosive oral lichen planus | ||
| OSCC: Oral squamous cell carcinoma | ||
| Prostate | 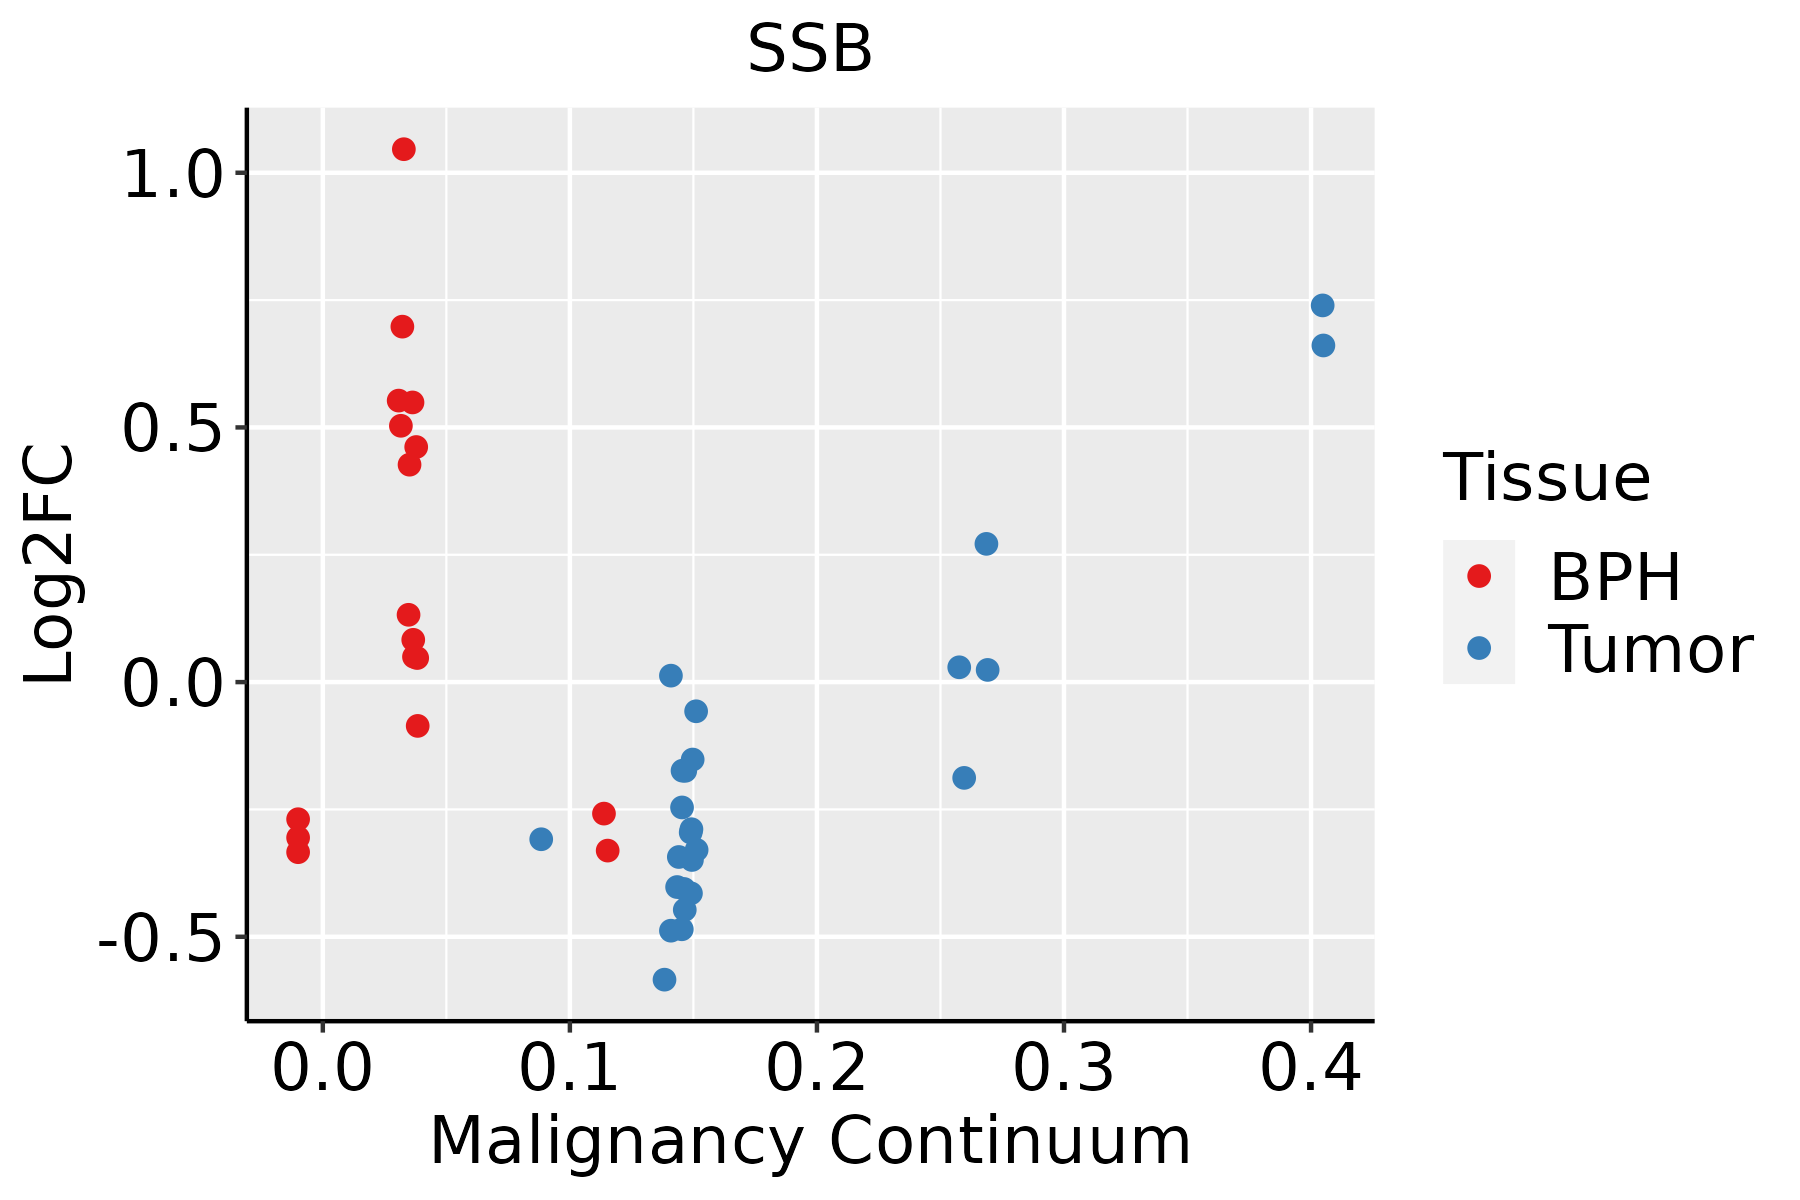 | BPH: Benign Prostatic Hyperplasia |
| Skin |  | AK: Actinic keratosis |
| cSCC: Cutaneous squamous cell carcinoma | ||
| SCCIS:squamous cell carcinoma in situ | ||
| Thyroid | 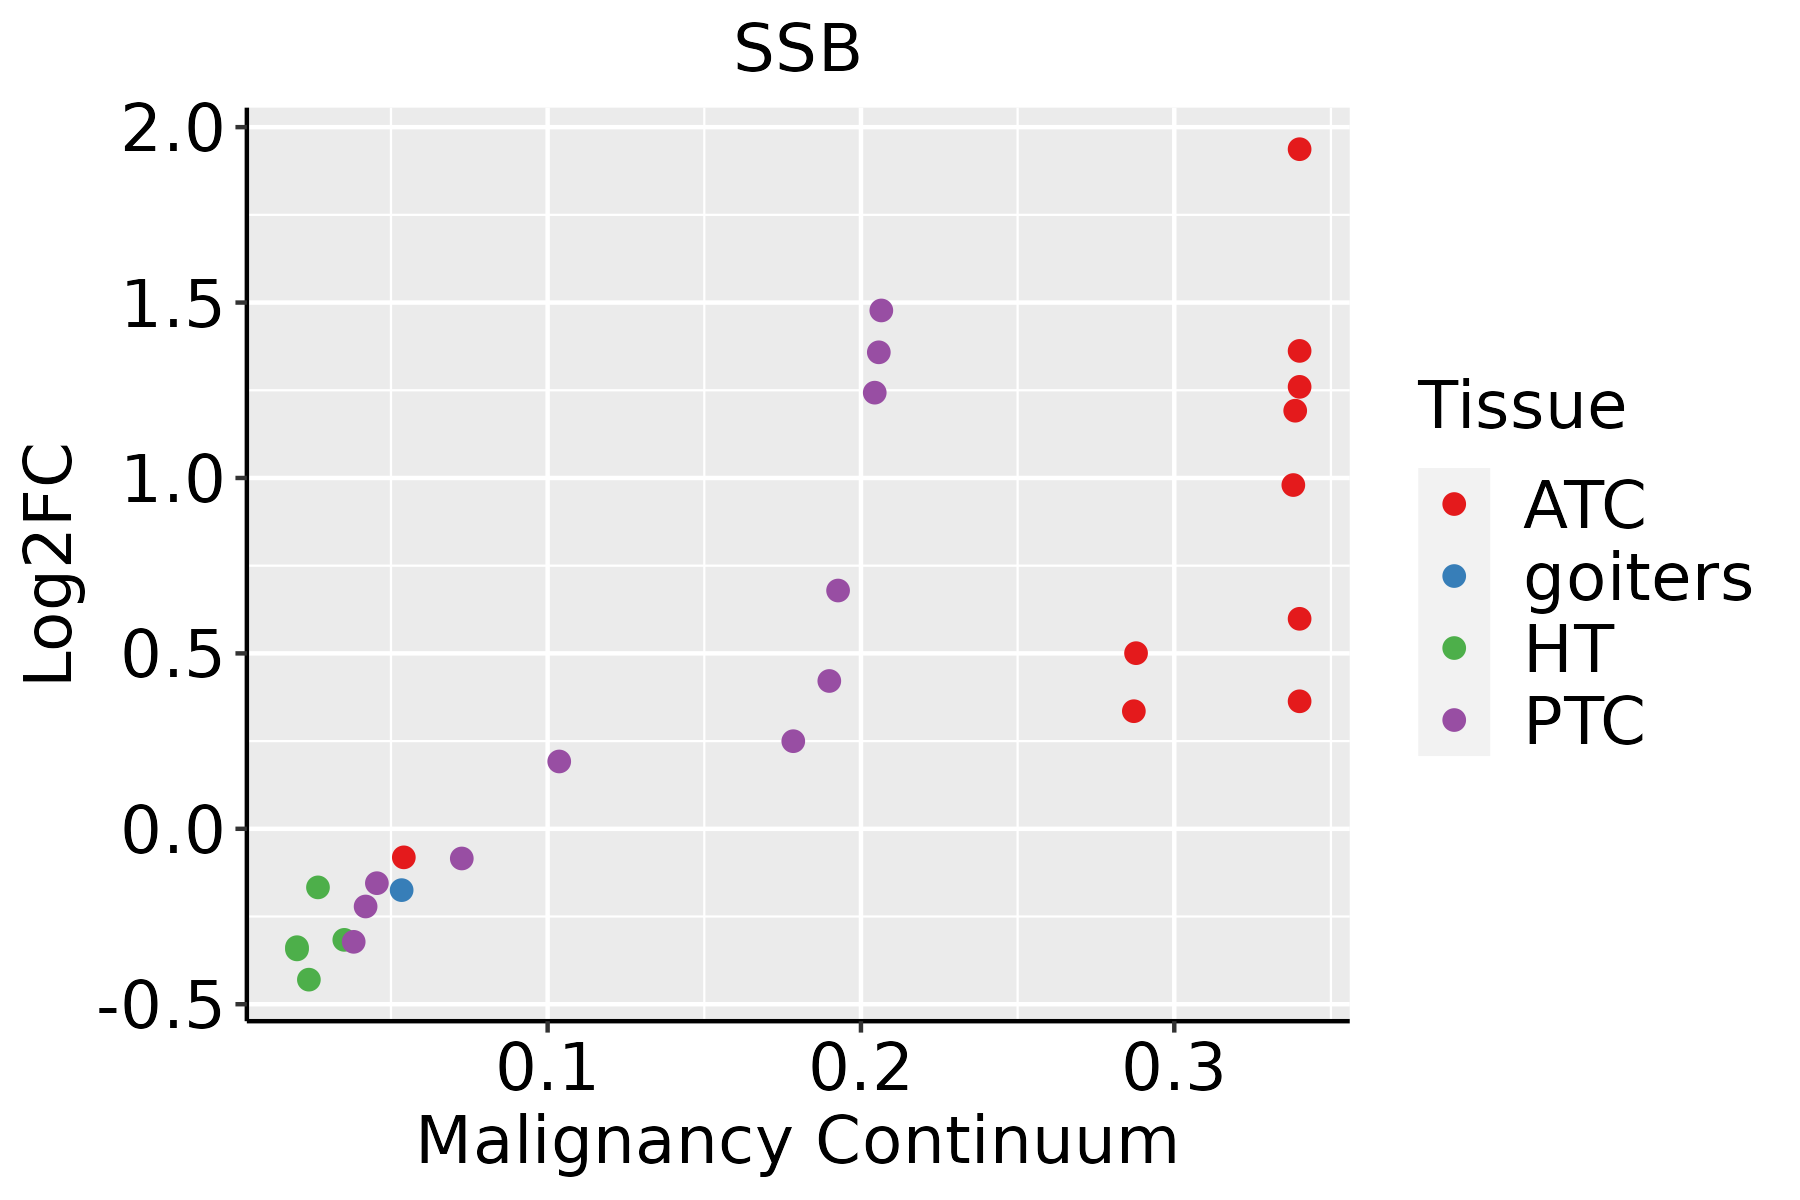 | ATC: Anaplastic thyroid cancer |
| HT: Hashimoto's thyroiditis | ||
| PTC: Papillary thyroid cancer |
| ∗log2FC in expression of this searched gene in stem-like cells from each diseased tissue sample relative to stem-like cells in normal samples in each tissue plotted against the malignancy continuum. Samples are colored based on if they are from different disease stage. |
Top |
Malignant transformation related pathway analysis |
| Find out the enriched GO biological processes and KEGG pathways involved in transition from healthy to precancer to cancer |
| Tissue | Disease Stage | Enriched GO biological Processes |
| Colorectum | AD |  |
| Colorectum | SER |  |
| Colorectum | MSS |  |
| Colorectum | MSI-H |  |
| Colorectum | FAP |  |
| ∗Top 15 enriched GO BP terms are showed in the bar plot of each disease state in each tissue. Each row represents a significant GO biological process which is colored according to the -log10(p.adjust). |
| Page: 1 2 3 4 5 6 7 8 9 |
| GO ID | Tissue | Disease Stage | Description | Gene Ratio | Bg Ratio | pvalue | p.adjust | Count |
| GO:00457403 | Breast | Precancer | positive regulation of DNA replication | 8/1080 | 40/18723 | 1.76e-03 | 1.74e-02 | 8 |
| GO:20012529 | Breast | Precancer | positive regulation of chromosome organization | 12/1080 | 82/18723 | 2.51e-03 | 2.29e-02 | 12 |
| GO:200125212 | Breast | IDC | positive regulation of chromosome organization | 15/1434 | 82/18723 | 1.28e-03 | 1.35e-02 | 15 |
| GO:00330445 | Breast | IDC | regulation of chromosome organization | 26/1434 | 187/18723 | 2.22e-03 | 2.06e-02 | 26 |
| GO:00457401 | Breast | IDC | positive regulation of DNA replication | 9/1434 | 40/18723 | 2.76e-03 | 2.42e-02 | 9 |
| GO:200125221 | Breast | DCIS | positive regulation of chromosome organization | 15/1390 | 82/18723 | 9.37e-04 | 1.06e-02 | 15 |
| GO:003304412 | Breast | DCIS | regulation of chromosome organization | 26/1390 | 187/18723 | 1.44e-03 | 1.47e-02 | 26 |
| GO:00457402 | Breast | DCIS | positive regulation of DNA replication | 9/1390 | 40/18723 | 2.23e-03 | 2.04e-02 | 9 |
| GO:001603210 | Cervix | CC | viral process | 109/2311 | 415/18723 | 5.40e-15 | 6.46e-12 | 109 |
| GO:00069139 | Cervix | CC | nucleocytoplasmic transport | 71/2311 | 301/18723 | 4.04e-08 | 2.54e-06 | 71 |
| GO:00511699 | Cervix | CC | nuclear transport | 71/2311 | 301/18723 | 4.04e-08 | 2.54e-06 | 71 |
| GO:00064029 | Cervix | CC | mRNA catabolic process | 56/2311 | 232/18723 | 4.81e-07 | 1.83e-05 | 56 |
| GO:00064019 | Cervix | CC | RNA catabolic process | 62/2311 | 278/18723 | 2.18e-06 | 6.56e-05 | 62 |
| GO:00511689 | Cervix | CC | nuclear export | 38/2311 | 154/18723 | 1.86e-05 | 3.46e-04 | 38 |
| GO:00009567 | Cervix | CC | nuclear-transcribed mRNA catabolic process | 30/2311 | 112/18723 | 2.60e-05 | 4.37e-04 | 30 |
| GO:00512368 | Cervix | CC | establishment of RNA localization | 39/2311 | 166/18723 | 4.76e-05 | 7.25e-04 | 39 |
| GO:00506578 | Cervix | CC | nucleic acid transport | 38/2311 | 163/18723 | 7.06e-05 | 9.85e-04 | 38 |
| GO:00506588 | Cervix | CC | RNA transport | 38/2311 | 163/18723 | 7.06e-05 | 9.85e-04 | 38 |
| GO:000640310 | Cervix | CC | RNA localization | 43/2311 | 201/18723 | 2.00e-04 | 2.29e-03 | 43 |
| GO:00467008 | Cervix | CC | heterocycle catabolic process | 80/2311 | 445/18723 | 3.23e-04 | 3.42e-03 | 80 |
| Page: 1 2 3 4 5 6 7 8 9 10 11 12 13 14 15 16 17 18 19 20 21 22 23 24 25 26 |
| Pathway ID | Tissue | Disease Stage | Description | Gene Ratio | Bg Ratio | pvalue | p.adjust | qvalue | Count |
| Page: 1 |
Top |
Cell-cell communication analysis |
| Identification of potential cell-cell interactions between two cell types and their ligand-receptor pairs for different disease states |
| Ligand | Receptor | LRpair | Pathway | Tissue | Disease Stage |
| Page: 1 |
Top |
Single-cell gene regulatory network inference analysis |
| Find out the significant the regulons (TFs) and the target genes of each regulon across cell types for different disease states |
| TF | Cell Type | Tissue | Disease Stage | Target Gene | RSS | Regulon Activity |
| ∗The dot plots of a searched regulon are shown for all cell subpopulations in each disease state of each tissue based on the regulon specific score inferred using pySCENIC and by calculating the average expression. |
| Page: 1 |
Top |
Somatic mutation of malignant transformation related genes |
| Annotation of somatic variants for genes involved in malignant transformation |
| Hugo Symbol | Variant Class | Variant Classification | dbSNP RS | HGVSc | HGVSp | HGVSp Short | SWISSPROT | BIOTYPE | SIFT | PolyPhen | Tumor Sample Barcode | Tissue | Histology | Sex | Age | Stage | Therapy Types | Drugs | Outcome |
| SSB | SNV | Missense_Mutation | c.925N>A | p.Glu309Lys | p.E309K | P05455 | protein_coding | tolerated(0.07) | benign(0.106) | TCGA-A8-A0A7-01 | Breast | breast invasive carcinoma | Female | <65 | I/II | Unknown | Unknown | SD | |
| SSB | SNV | Missense_Mutation | c.638N>A | p.Ala213Glu | p.A213E | P05455 | protein_coding | tolerated(1) | benign(0) | TCGA-AC-A23H-01 | Breast | breast invasive carcinoma | Female | >=65 | I/II | Unknown | Unknown | PD | |
| SSB | deletion | Frame_Shift_Del | novel | c.54delN | p.His19IlefsTer18 | p.H19Ifs*18 | P05455 | protein_coding | TCGA-EW-A2FV-01 | Breast | breast invasive carcinoma | Female | <65 | III/IV | Chemotherapy | docetaxel | SD | ||
| SSB | SNV | Missense_Mutation | rs201142063 | c.676C>G | p.Leu226Val | p.L226V | P05455 | protein_coding | tolerated(0.09) | benign(0.017) | TCGA-C5-A902-01 | Cervix | cervical & endocervical cancer | Female | <65 | I/II | Chemotherapy | cisplatin | SD |
| SSB | SNV | Missense_Mutation | c.1048N>C | p.Ser350Pro | p.S350P | P05455 | protein_coding | tolerated(0.29) | benign(0.003) | TCGA-A6-6781-01 | Colorectum | colon adenocarcinoma | Male | <65 | III/IV | Chemotherapy | oxaliplatin | SD | |
| SSB | SNV | Missense_Mutation | novel | c.787N>T | p.Asp263Tyr | p.D263Y | P05455 | protein_coding | deleterious(0) | probably_damaging(0.916) | TCGA-CA-6717-01 | Colorectum | colon adenocarcinoma | Male | <65 | I/II | Chemotherapy | oxaliplatin | CR |
| SSB | SNV | Missense_Mutation | c.290N>C | p.Leu97Pro | p.L97P | P05455 | protein_coding | deleterious(0) | possibly_damaging(0.896) | TCGA-CM-4743-01 | Colorectum | colon adenocarcinoma | Male | >=65 | I/II | Chemotherapy | capecitabine | SD | |
| SSB | SNV | Missense_Mutation | c.1039N>A | p.Gln347Lys | p.Q347K | P05455 | protein_coding | tolerated(0.37) | benign(0.007) | TCGA-AG-3882-01 | Colorectum | rectum adenocarcinoma | Female | >=65 | I/II | Unknown | Unknown | SD | |
| SSB | SNV | Missense_Mutation | novel | c.452N>C | p.Lys151Thr | p.K151T | P05455 | protein_coding | deleterious(0) | probably_damaging(0.999) | TCGA-F5-6814-01 | Colorectum | rectum adenocarcinoma | Male | <65 | I/II | Unknown | Unknown | SD |
| SSB | SNV | Missense_Mutation | c.587N>T | p.Arg196Ile | p.R196I | P05455 | protein_coding | deleterious(0) | possibly_damaging(0.572) | TCGA-AJ-A3EL-01 | Endometrium | uterine corpus endometrioid carcinoma | Female | <65 | I/II | Unknown | Unknown | SD |
| Page: 1 2 3 |
Top |
Related drugs of malignant transformation related genes |
| Identification of chemicals and drugs interact with genes involved in malignant transfromation |
| (DGIdb 4.0) |
| Entrez ID | Symbol | Category | Interaction Types | Drug Claim Name | Drug Name | PMIDs |
| Page: 1 |

Copyright 2023-Present -The University of Texas Health Science Center at Houston |