
|
|||||
|
 | |
| |
| |
| |
| |
| |
|
Gene: SS18L2 |
Gene summary for SS18L2 |
| Gene information | Species | Human | Gene symbol | SS18L2 | Gene ID | 51188 |
| Gene name | SS18 like 2 | |
| Gene Alias | KIAA-iso | |
| Cytomap | 3p22.1 | |
| Gene Type | protein-coding | GO ID | GO:0000902 | UniProtAcc | A0A024R2Q8 |
Top |
Malignant transformation analysis |
| Identification of the aberrant gene expression in precancerous and cancerous lesions by comparing the gene expression of stem-like cells in diseased tissues with normal stem cells |
| Entrez ID | Symbol | Replicates | Species | Organ | Tissue | Adj P-value | Log2FC | Malignancy |
| 51188 | SS18L2 | LZE2D | Human | Esophagus | HGIN | 2.98e-02 | 1.52e-01 | 0.0642 |
| 51188 | SS18L2 | LZE4T | Human | Esophagus | ESCC | 2.08e-04 | 5.11e-01 | 0.0811 |
| 51188 | SS18L2 | LZE5T | Human | Esophagus | ESCC | 1.09e-04 | 2.88e-01 | 0.0514 |
| 51188 | SS18L2 | LZE7T | Human | Esophagus | ESCC | 1.14e-08 | 3.93e-01 | 0.0667 |
| 51188 | SS18L2 | LZE8T | Human | Esophagus | ESCC | 3.85e-04 | 1.89e-01 | 0.067 |
| 51188 | SS18L2 | LZE20T | Human | Esophagus | ESCC | 1.27e-10 | 5.52e-02 | 0.0662 |
| 51188 | SS18L2 | LZE24T | Human | Esophagus | ESCC | 3.12e-22 | 7.46e-01 | 0.0596 |
| 51188 | SS18L2 | LZE21T | Human | Esophagus | ESCC | 1.73e-05 | 4.83e-01 | 0.0655 |
| 51188 | SS18L2 | LZE6T | Human | Esophagus | ESCC | 2.60e-04 | 3.77e-01 | 0.0845 |
| 51188 | SS18L2 | P1T-E | Human | Esophagus | ESCC | 8.91e-12 | 3.87e-01 | 0.0875 |
| 51188 | SS18L2 | P2T-E | Human | Esophagus | ESCC | 6.02e-23 | 3.02e-01 | 0.1177 |
| 51188 | SS18L2 | P4T-E | Human | Esophagus | ESCC | 4.68e-47 | 1.37e+00 | 0.1323 |
| 51188 | SS18L2 | P5T-E | Human | Esophagus | ESCC | 8.64e-19 | 4.39e-01 | 0.1327 |
| 51188 | SS18L2 | P8T-E | Human | Esophagus | ESCC | 4.27e-19 | 3.73e-01 | 0.0889 |
| 51188 | SS18L2 | P9T-E | Human | Esophagus | ESCC | 8.98e-22 | 6.20e-01 | 0.1131 |
| 51188 | SS18L2 | P10T-E | Human | Esophagus | ESCC | 4.74e-33 | 4.81e-01 | 0.116 |
| 51188 | SS18L2 | P11T-E | Human | Esophagus | ESCC | 1.48e-12 | 4.15e-01 | 0.1426 |
| 51188 | SS18L2 | P12T-E | Human | Esophagus | ESCC | 1.07e-58 | 1.03e+00 | 0.1122 |
| 51188 | SS18L2 | P15T-E | Human | Esophagus | ESCC | 1.07e-18 | 3.22e-01 | 0.1149 |
| 51188 | SS18L2 | P16T-E | Human | Esophagus | ESCC | 6.37e-25 | 3.30e-01 | 0.1153 |
| Page: 1 2 3 4 5 6 |
| Tissue | Expression Dynamics | Abbreviation |
| Esophagus |  | ESCC: Esophageal squamous cell carcinoma |
| HGIN: High-grade intraepithelial neoplasias | ||
| LGIN: Low-grade intraepithelial neoplasias | ||
| Liver | 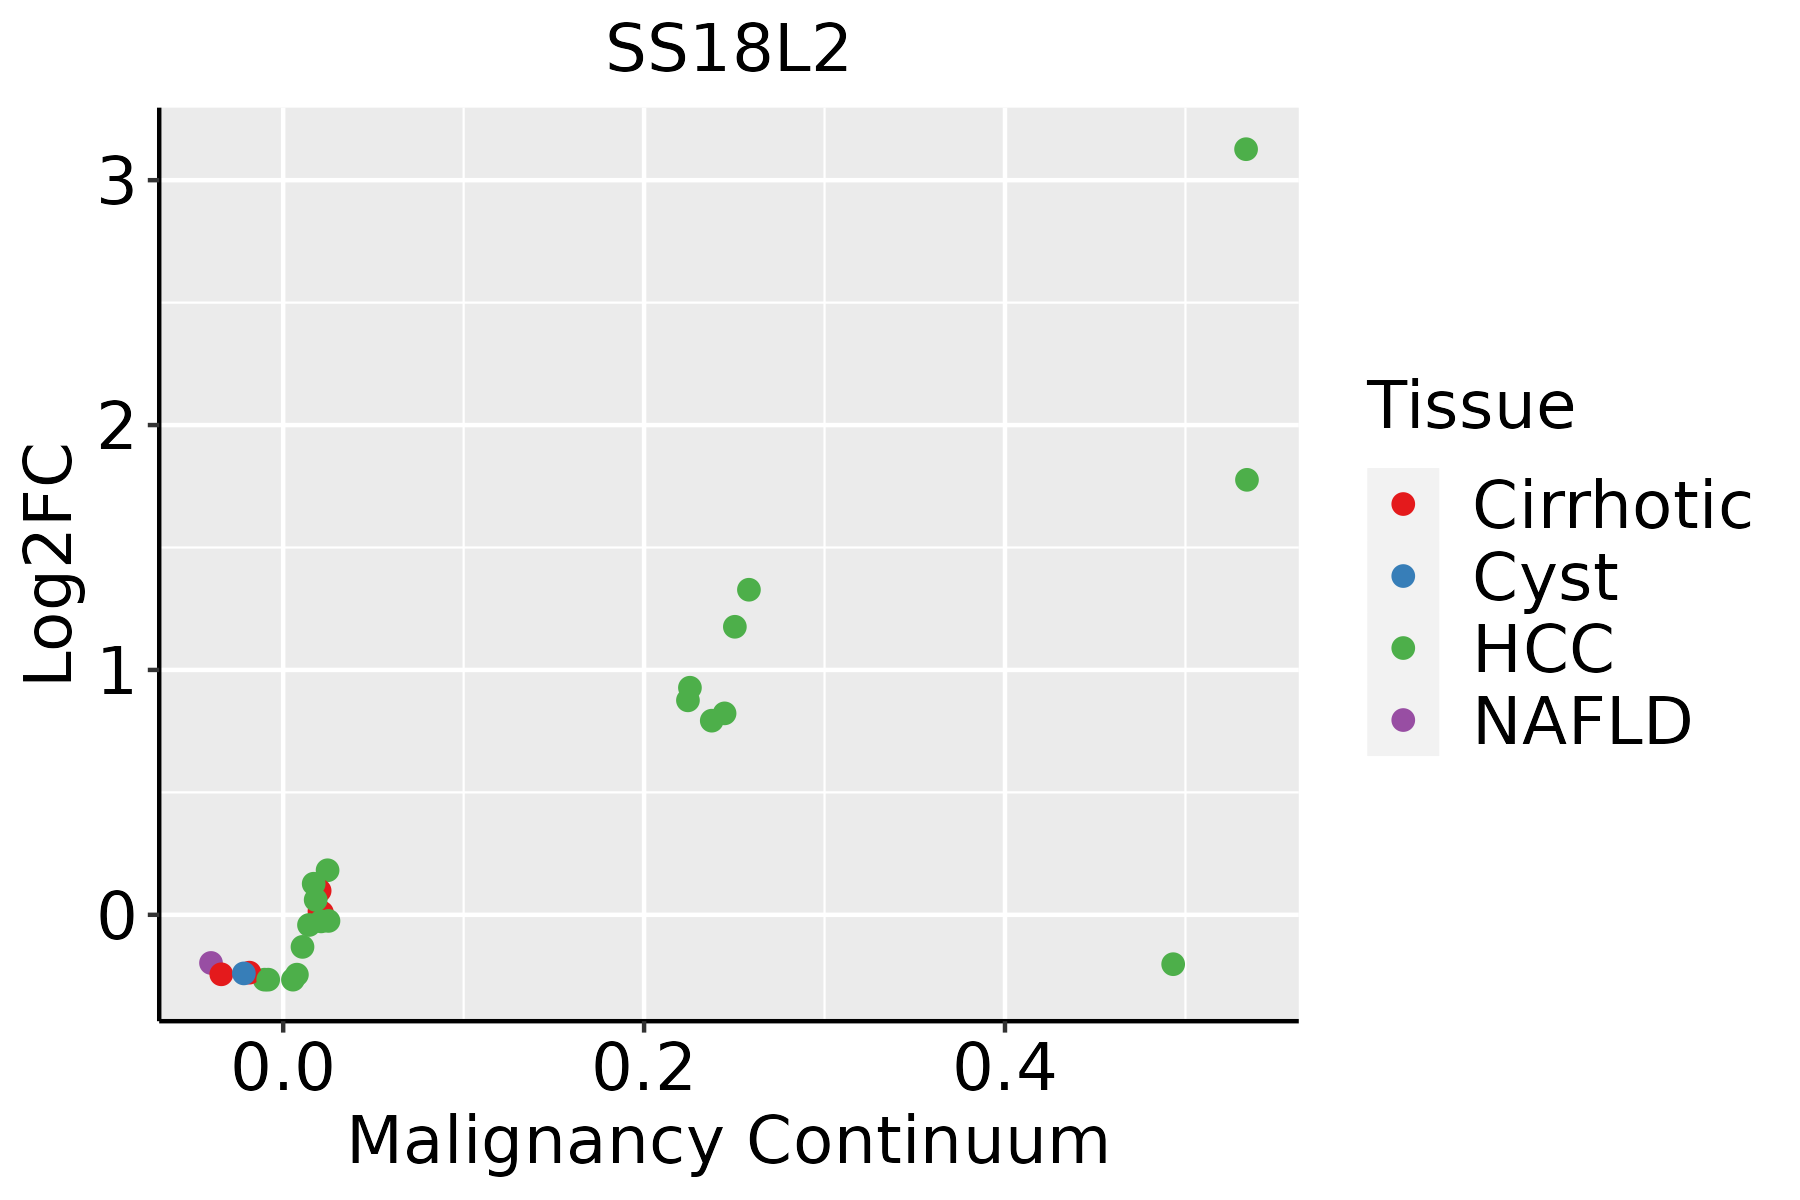 | HCC: Hepatocellular carcinoma |
| NAFLD: Non-alcoholic fatty liver disease | ||
| Oral Cavity | 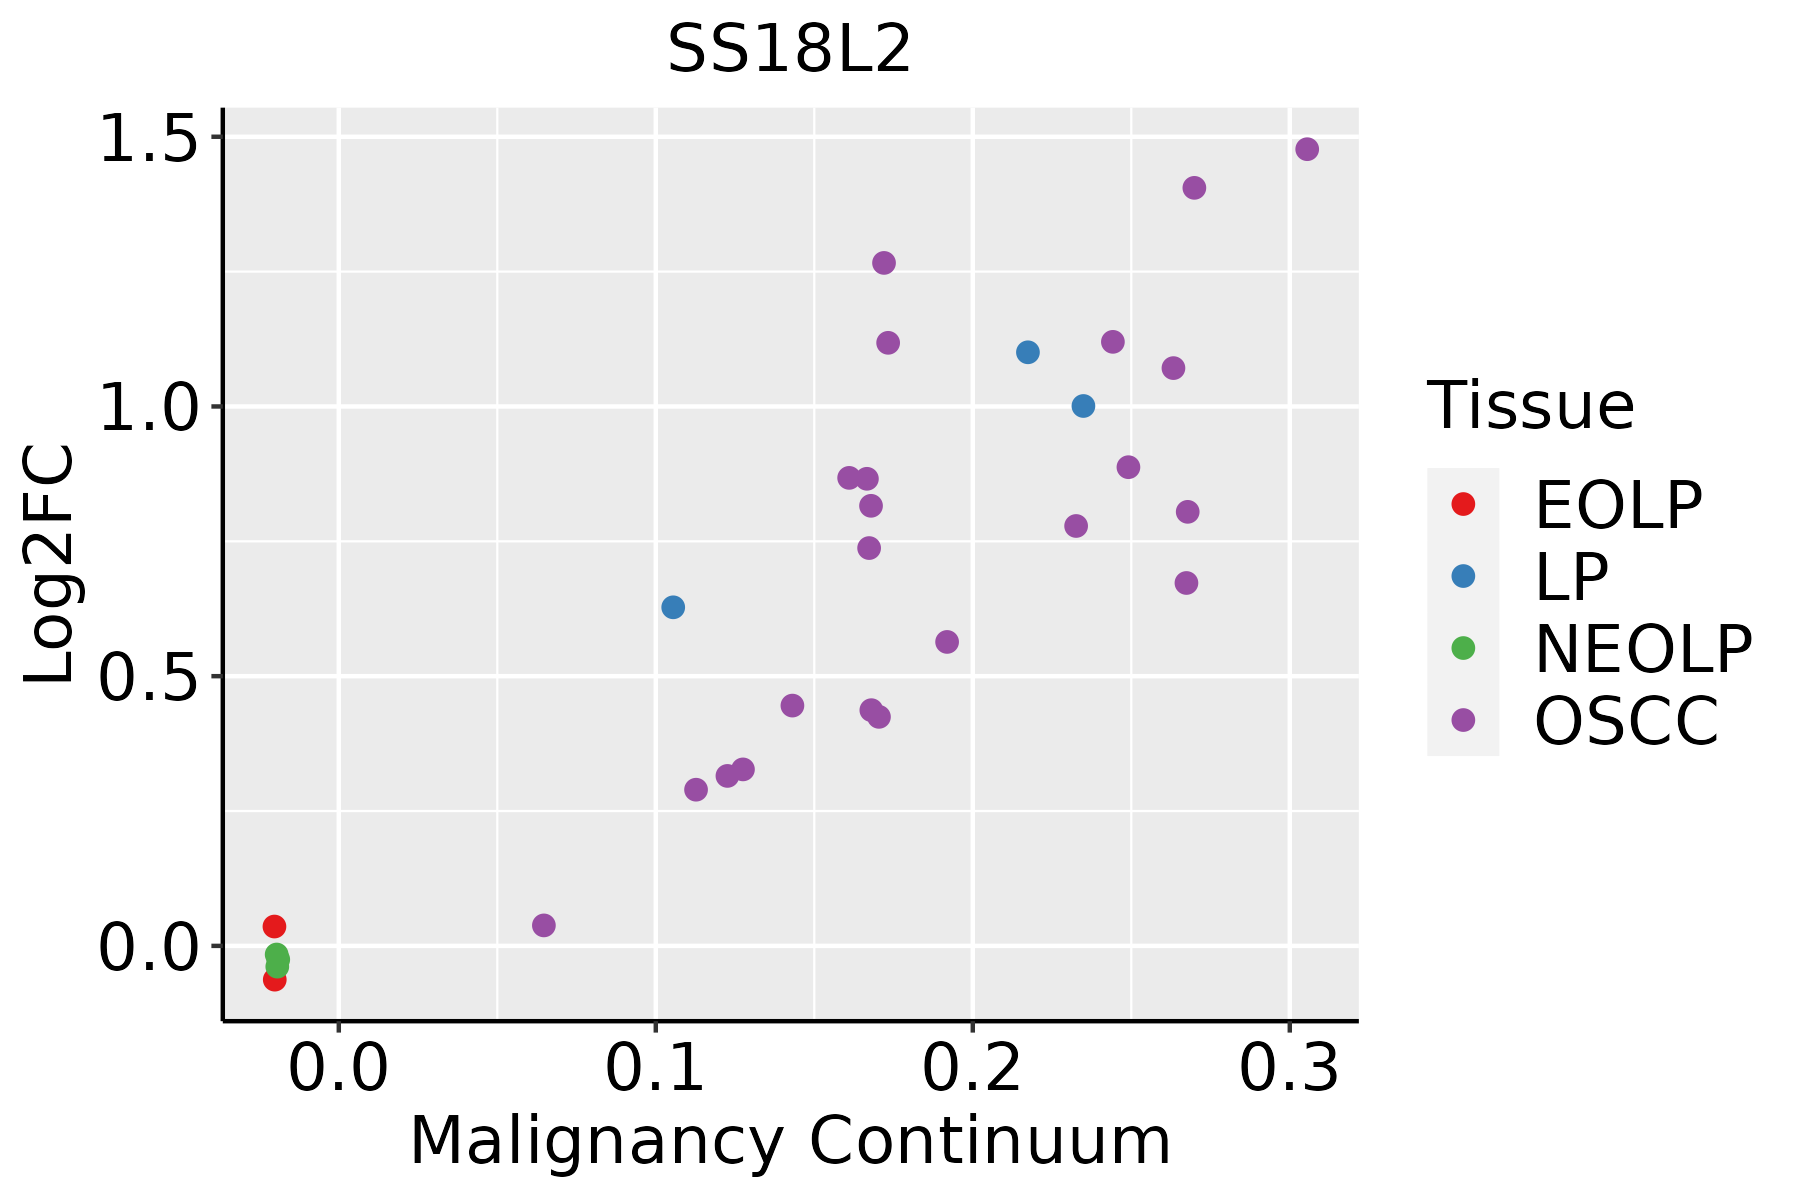 | EOLP: Erosive Oral lichen planus |
| LP: leukoplakia | ||
| NEOLP: Non-erosive oral lichen planus | ||
| OSCC: Oral squamous cell carcinoma | ||
| Prostate | 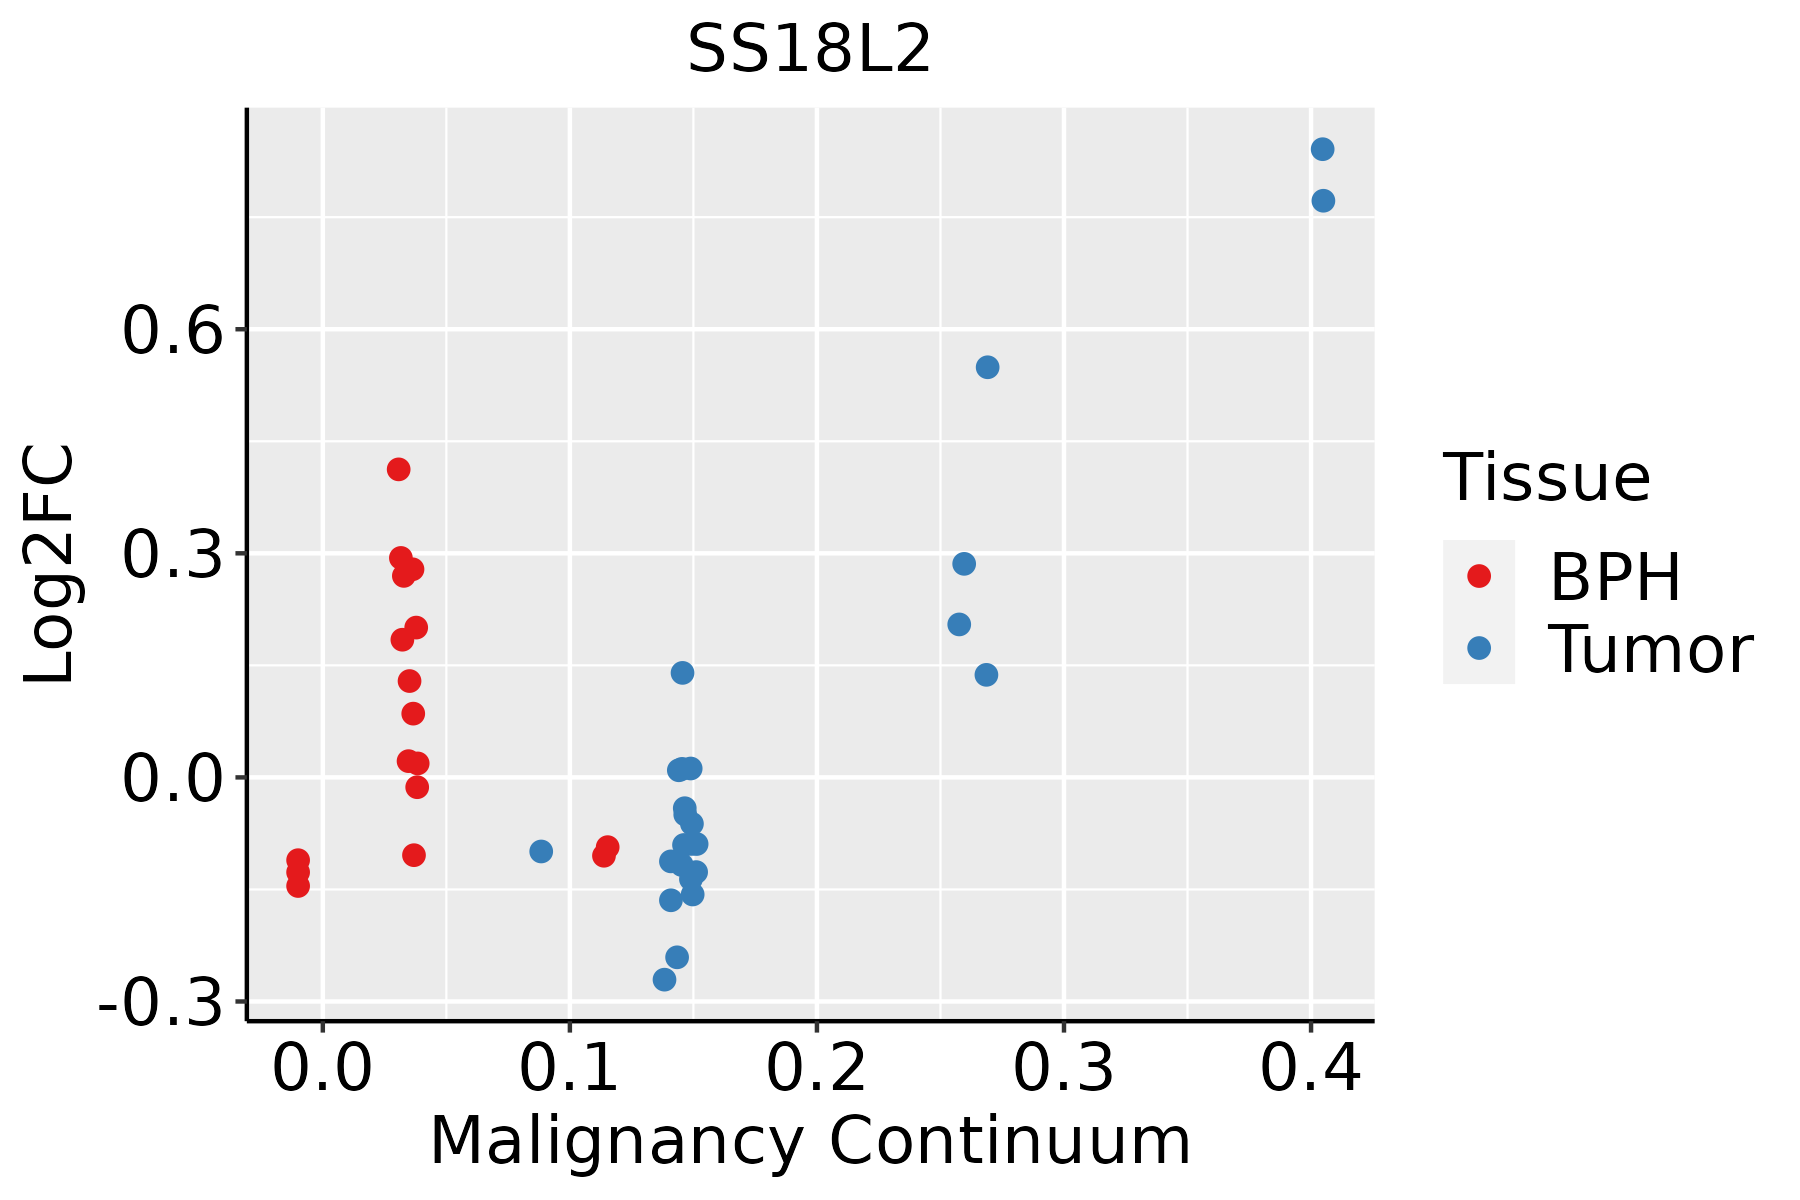 | BPH: Benign Prostatic Hyperplasia |
| Skin |  | AK: Actinic keratosis |
| cSCC: Cutaneous squamous cell carcinoma | ||
| SCCIS:squamous cell carcinoma in situ |
| ∗log2FC in expression of this searched gene in stem-like cells from each diseased tissue sample relative to stem-like cells in normal samples in each tissue plotted against the malignancy continuum. Samples are colored based on if they are from different disease stage. |
Top |
Malignant transformation related pathway analysis |
| Find out the enriched GO biological processes and KEGG pathways involved in transition from healthy to precancer to cancer |
| Tissue | Disease Stage | Enriched GO biological Processes |
| Colorectum | AD |  |
| Colorectum | SER |  |
| Colorectum | MSS |  |
| Colorectum | MSI-H |  |
| Colorectum | FAP |  |
| ∗Top 15 enriched GO BP terms are showed in the bar plot of each disease state in each tissue. Each row represents a significant GO biological process which is colored according to the -log10(p.adjust). |
| Page: 1 2 3 4 5 6 7 8 9 |
| GO ID | Tissue | Disease Stage | Description | Gene Ratio | Bg Ratio | pvalue | p.adjust | Count |
| GO:002260420 | Esophagus | ESCC | regulation of cell morphogenesis | 180/8552 | 309/18723 | 5.19e-06 | 5.45e-05 | 180 |
| GO:003134616 | Esophagus | ESCC | positive regulation of cell projection organization | 201/8552 | 353/18723 | 1.19e-05 | 1.11e-04 | 201 |
| GO:001072010 | Esophagus | ESCC | positive regulation of cell development | 172/8552 | 298/18723 | 1.74e-05 | 1.55e-04 | 172 |
| GO:005076710 | Esophagus | ESCC | regulation of neurogenesis | 203/8552 | 364/18723 | 6.10e-05 | 4.68e-04 | 203 |
| GO:00507697 | Esophagus | ESCC | positive regulation of neurogenesis | 131/8552 | 225/18723 | 9.71e-05 | 6.90e-04 | 131 |
| GO:001097516 | Esophagus | ESCC | regulation of neuron projection development | 240/8552 | 445/18723 | 2.48e-04 | 1.53e-03 | 240 |
| GO:001076920 | Esophagus | ESCC | regulation of cell morphogenesis involved in differentiation | 61/8552 | 96/18723 | 3.12e-04 | 1.85e-03 | 61 |
| GO:00519606 | Esophagus | ESCC | regulation of nervous system development | 237/8552 | 443/18723 | 5.02e-04 | 2.78e-03 | 237 |
| GO:001077018 | Esophagus | ESCC | positive regulation of cell morphogenesis involved in differentiation | 51/8552 | 79/18723 | 5.48e-04 | 3.00e-03 | 51 |
| GO:00519625 | Esophagus | ESCC | positive regulation of nervous system development | 149/8552 | 272/18723 | 1.50e-03 | 7.06e-03 | 149 |
| GO:001635816 | Esophagus | ESCC | dendrite development | 130/8552 | 243/18723 | 8.33e-03 | 2.95e-02 | 130 |
| GO:002260412 | Liver | Cirrhotic | regulation of cell morphogenesis | 127/4634 | 309/18723 | 1.45e-10 | 7.44e-09 | 127 |
| GO:001076912 | Liver | Cirrhotic | regulation of cell morphogenesis involved in differentiation | 43/4634 | 96/18723 | 1.42e-05 | 1.97e-04 | 43 |
| GO:001077012 | Liver | Cirrhotic | positive regulation of cell morphogenesis involved in differentiation | 35/4634 | 79/18723 | 1.13e-04 | 1.14e-03 | 35 |
| GO:00107205 | Liver | Cirrhotic | positive regulation of cell development | 99/4634 | 298/18723 | 5.71e-04 | 4.46e-03 | 99 |
| GO:002260422 | Liver | HCC | regulation of cell morphogenesis | 188/7958 | 309/18723 | 4.84e-11 | 1.82e-09 | 188 |
| GO:001076922 | Liver | HCC | regulation of cell morphogenesis involved in differentiation | 65/7958 | 96/18723 | 5.17e-07 | 8.37e-06 | 65 |
| GO:003134611 | Liver | HCC | positive regulation of cell projection organization | 193/7958 | 353/18723 | 2.28e-06 | 3.08e-05 | 193 |
| GO:001077022 | Liver | HCC | positive regulation of cell morphogenesis involved in differentiation | 53/7958 | 79/18723 | 8.69e-06 | 1.02e-04 | 53 |
| GO:001072011 | Liver | HCC | positive regulation of cell development | 155/7958 | 298/18723 | 5.39e-04 | 3.48e-03 | 155 |
| Page: 1 2 3 4 |
| Pathway ID | Tissue | Disease Stage | Description | Gene Ratio | Bg Ratio | pvalue | p.adjust | qvalue | Count |
| Page: 1 |
Top |
Cell-cell communication analysis |
| Identification of potential cell-cell interactions between two cell types and their ligand-receptor pairs for different disease states |
| Ligand | Receptor | LRpair | Pathway | Tissue | Disease Stage |
| Page: 1 |
Top |
Single-cell gene regulatory network inference analysis |
| Find out the significant the regulons (TFs) and the target genes of each regulon across cell types for different disease states |
| TF | Cell Type | Tissue | Disease Stage | Target Gene | RSS | Regulon Activity |
| ∗The dot plots of a searched regulon are shown for all cell subpopulations in each disease state of each tissue based on the regulon specific score inferred using pySCENIC and by calculating the average expression. |
| Page: 1 |
Top |
Somatic mutation of malignant transformation related genes |
| Annotation of somatic variants for genes involved in malignant transformation |
| Hugo Symbol | Variant Class | Variant Classification | dbSNP RS | HGVSc | HGVSp | HGVSp Short | SWISSPROT | BIOTYPE | SIFT | PolyPhen | Tumor Sample Barcode | Tissue | Histology | Sex | Age | Stage | Therapy Types | Drugs | Outcome |
| SS18L2 | SNV | Missense_Mutation | novel | c.217T>C | p.Ser73Pro | p.S73P | Q9UHA2 | protein_coding | deleterious(0.04) | benign(0.003) | TCGA-AX-A2HD-01 | Endometrium | uterine corpus endometrioid carcinoma | Female | >=65 | III/IV | Unknown | Unknown | SD |
| SS18L2 | SNV | Missense_Mutation | novel | c.63N>G | p.Ile21Met | p.I21M | Q9UHA2 | protein_coding | deleterious(0) | possibly_damaging(0.459) | TCGA-64-1678-01 | Lung | lung adenocarcinoma | Female | >=65 | I/II | Chemotherapy | carboplatin | SD |
| Page: 1 |
Top |
Related drugs of malignant transformation related genes |
| Identification of chemicals and drugs interact with genes involved in malignant transfromation |
| (DGIdb 4.0) |
| Entrez ID | Symbol | Category | Interaction Types | Drug Claim Name | Drug Name | PMIDs |
| Page: 1 |

Copyright 2023-Present -The University of Texas Health Science Center at Houston |