
|
|||||
|
 | |
| |
| |
| |
| |
| |
|
Gene: SS18 |
Gene summary for SS18 |
| Gene information | Species | Human | Gene symbol | SS18 | Gene ID | 6760 |
| Gene name | SS18 subunit of BAF chromatin remodeling complex | |
| Gene Alias | SMARCL1 | |
| Cytomap | 18q11.2 | |
| Gene Type | protein-coding | GO ID | GO:0000226 | UniProtAcc | A0A024RC40 |
Top |
Malignant transformation analysis |
| Identification of the aberrant gene expression in precancerous and cancerous lesions by comparing the gene expression of stem-like cells in diseased tissues with normal stem cells |
| Entrez ID | Symbol | Replicates | Species | Organ | Tissue | Adj P-value | Log2FC | Malignancy |
| 6760 | SS18 | LZE4T | Human | Esophagus | ESCC | 3.73e-07 | 2.01e-01 | 0.0811 |
| 6760 | SS18 | LZE7T | Human | Esophagus | ESCC | 6.00e-03 | 3.88e-01 | 0.0667 |
| 6760 | SS18 | LZE8T | Human | Esophagus | ESCC | 8.00e-06 | 2.35e-01 | 0.067 |
| 6760 | SS18 | LZE20T | Human | Esophagus | ESCC | 6.76e-05 | 1.41e-01 | 0.0662 |
| 6760 | SS18 | LZE21D1 | Human | Esophagus | HGIN | 3.75e-02 | 1.69e-01 | 0.0632 |
| 6760 | SS18 | LZE24T | Human | Esophagus | ESCC | 2.79e-13 | 5.52e-01 | 0.0596 |
| 6760 | SS18 | P2T-E | Human | Esophagus | ESCC | 6.18e-37 | 7.16e-01 | 0.1177 |
| 6760 | SS18 | P4T-E | Human | Esophagus | ESCC | 3.29e-19 | 6.76e-01 | 0.1323 |
| 6760 | SS18 | P5T-E | Human | Esophagus | ESCC | 6.94e-08 | 1.78e-01 | 0.1327 |
| 6760 | SS18 | P8T-E | Human | Esophagus | ESCC | 6.50e-30 | 3.87e-01 | 0.0889 |
| 6760 | SS18 | P9T-E | Human | Esophagus | ESCC | 4.13e-19 | 5.55e-01 | 0.1131 |
| 6760 | SS18 | P10T-E | Human | Esophagus | ESCC | 3.73e-24 | 1.66e-01 | 0.116 |
| 6760 | SS18 | P11T-E | Human | Esophagus | ESCC | 2.46e-11 | 3.29e-01 | 0.1426 |
| 6760 | SS18 | P12T-E | Human | Esophagus | ESCC | 9.50e-22 | 5.30e-01 | 0.1122 |
| 6760 | SS18 | P15T-E | Human | Esophagus | ESCC | 4.05e-25 | 5.68e-01 | 0.1149 |
| 6760 | SS18 | P16T-E | Human | Esophagus | ESCC | 2.33e-24 | 4.37e-01 | 0.1153 |
| 6760 | SS18 | P17T-E | Human | Esophagus | ESCC | 1.67e-05 | 4.84e-01 | 0.1278 |
| 6760 | SS18 | P20T-E | Human | Esophagus | ESCC | 1.40e-22 | 4.79e-01 | 0.1124 |
| 6760 | SS18 | P21T-E | Human | Esophagus | ESCC | 2.06e-22 | 5.29e-01 | 0.1617 |
| 6760 | SS18 | P22T-E | Human | Esophagus | ESCC | 2.43e-19 | 4.79e-01 | 0.1236 |
| Page: 1 2 3 4 5 6 |
| Tissue | Expression Dynamics | Abbreviation |
| Esophagus | 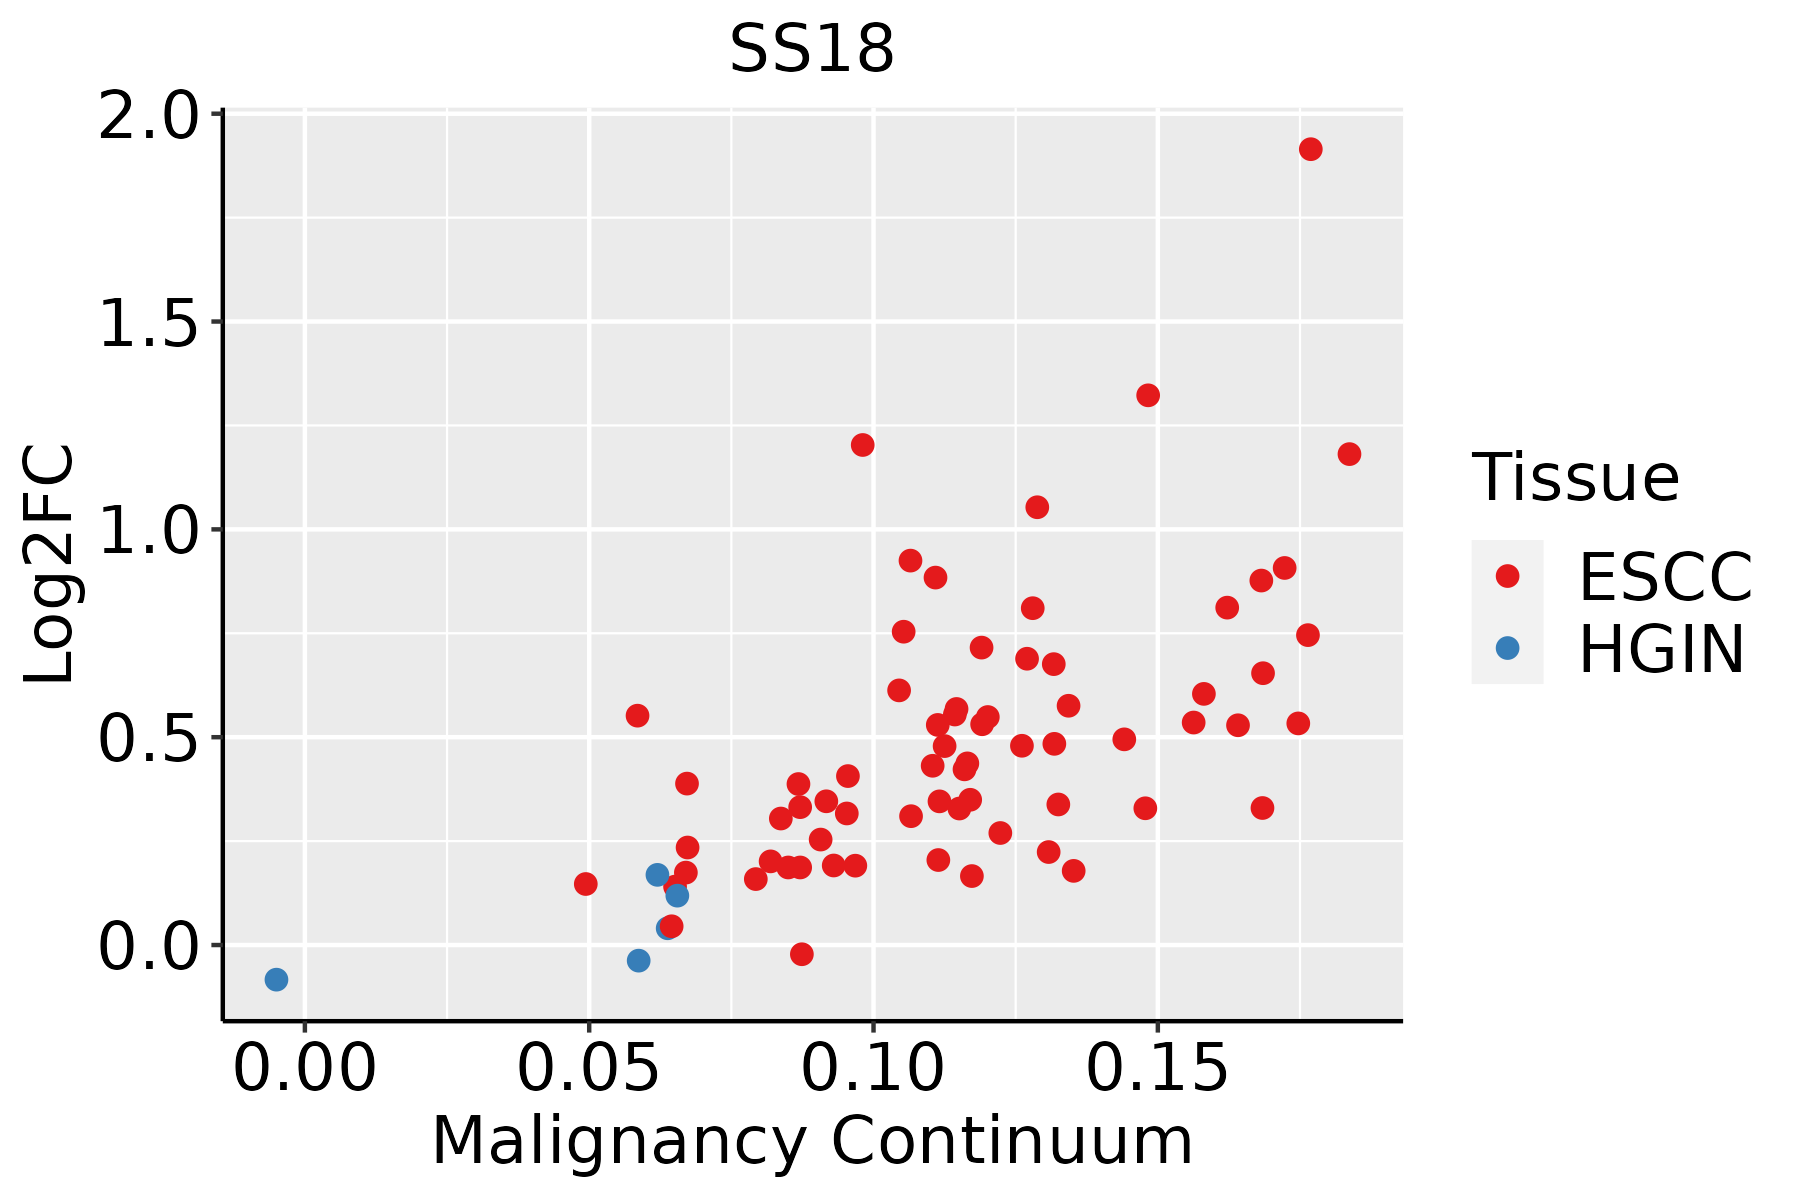 | ESCC: Esophageal squamous cell carcinoma |
| HGIN: High-grade intraepithelial neoplasias | ||
| LGIN: Low-grade intraepithelial neoplasias | ||
| Liver | 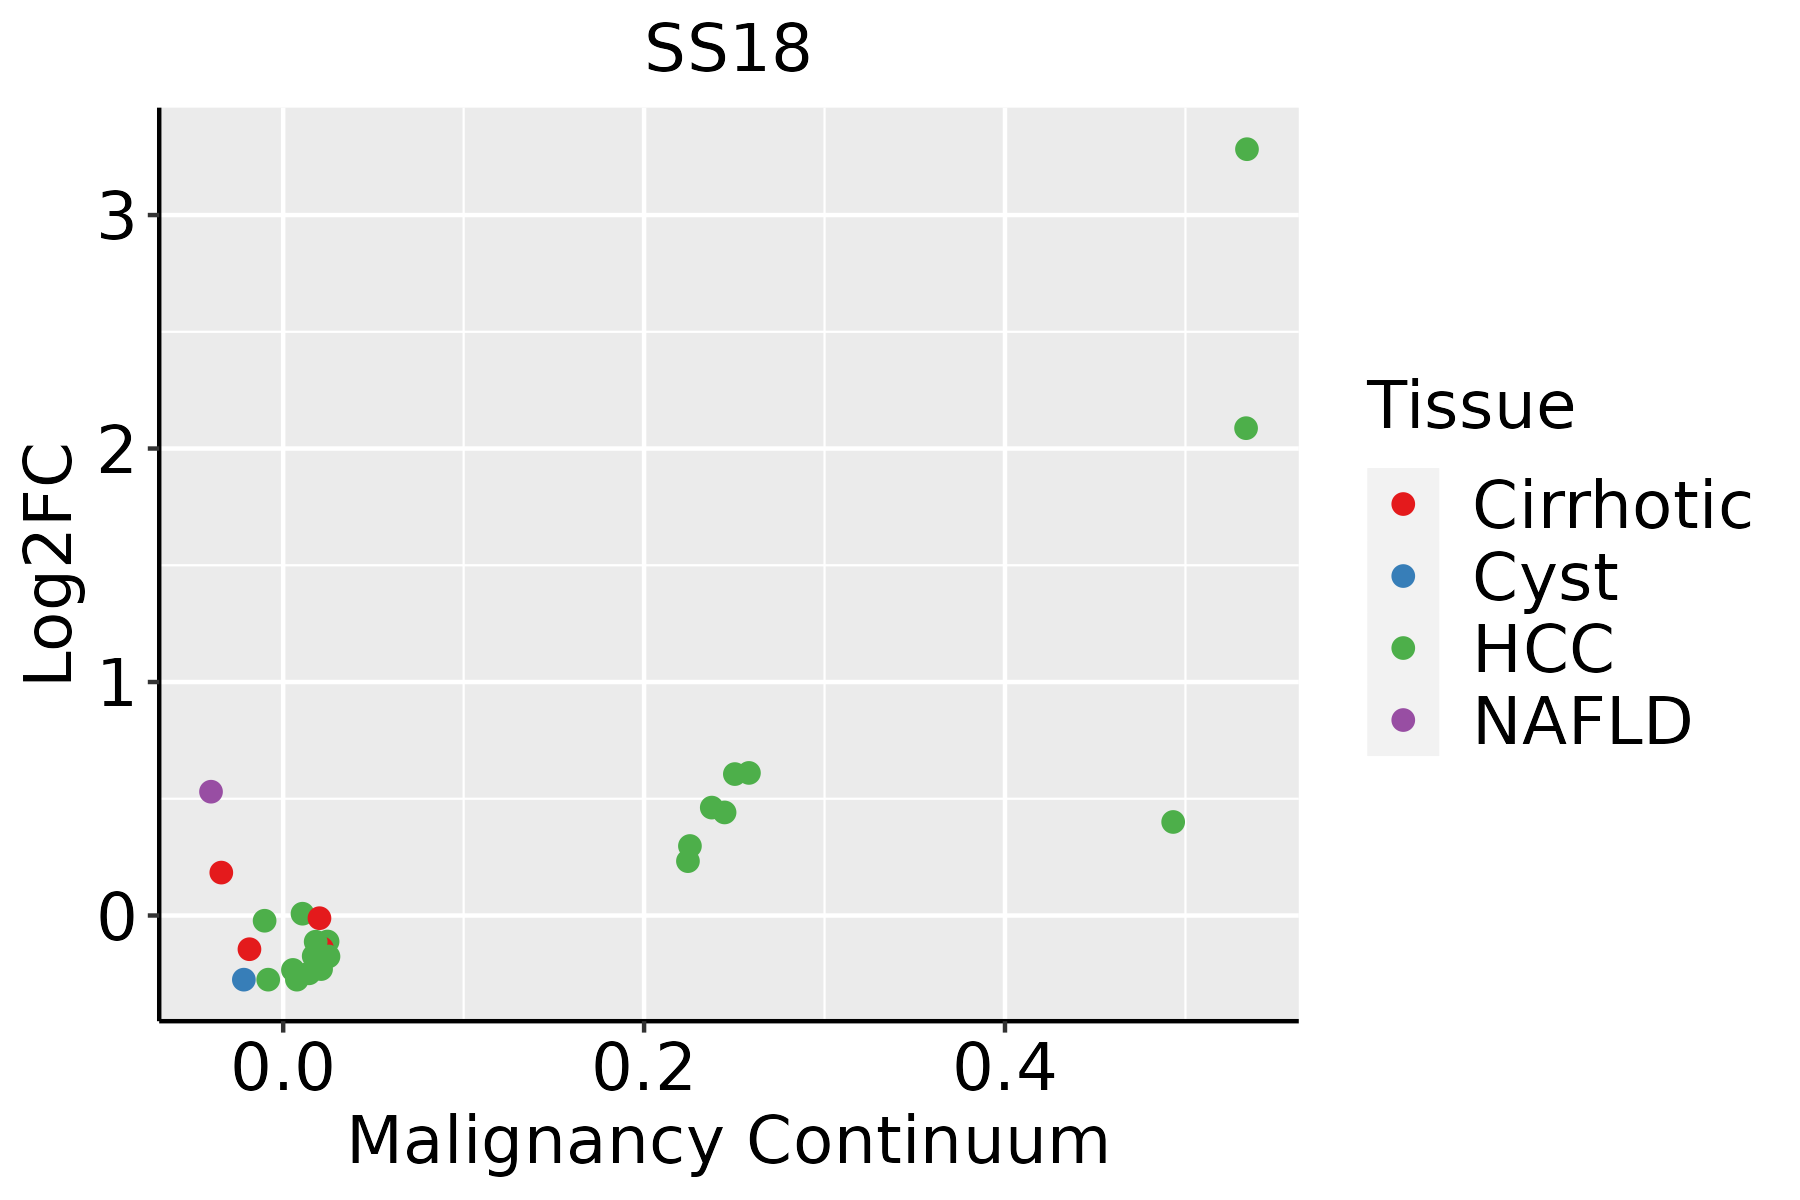 | HCC: Hepatocellular carcinoma |
| NAFLD: Non-alcoholic fatty liver disease | ||
| Oral Cavity | 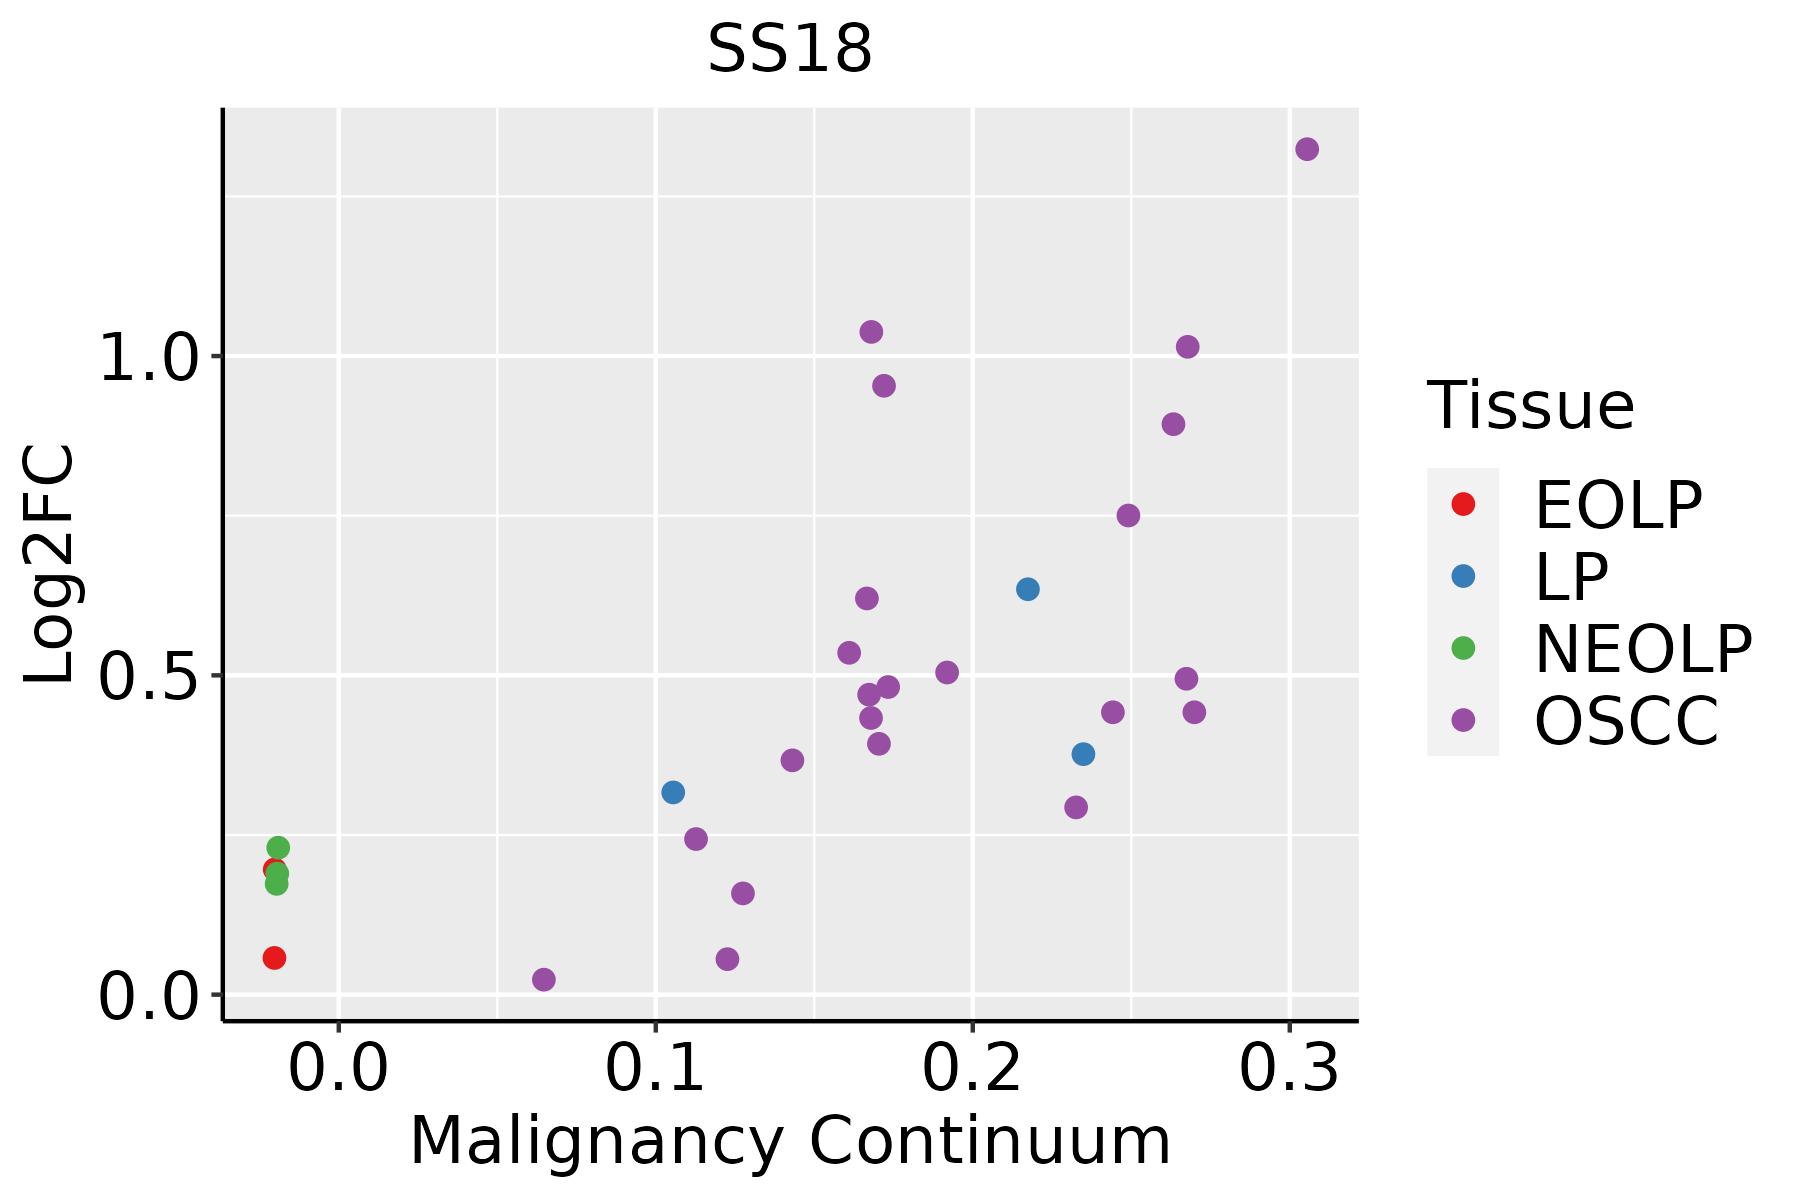 | EOLP: Erosive Oral lichen planus |
| LP: leukoplakia | ||
| NEOLP: Non-erosive oral lichen planus | ||
| OSCC: Oral squamous cell carcinoma | ||
| Thyroid | 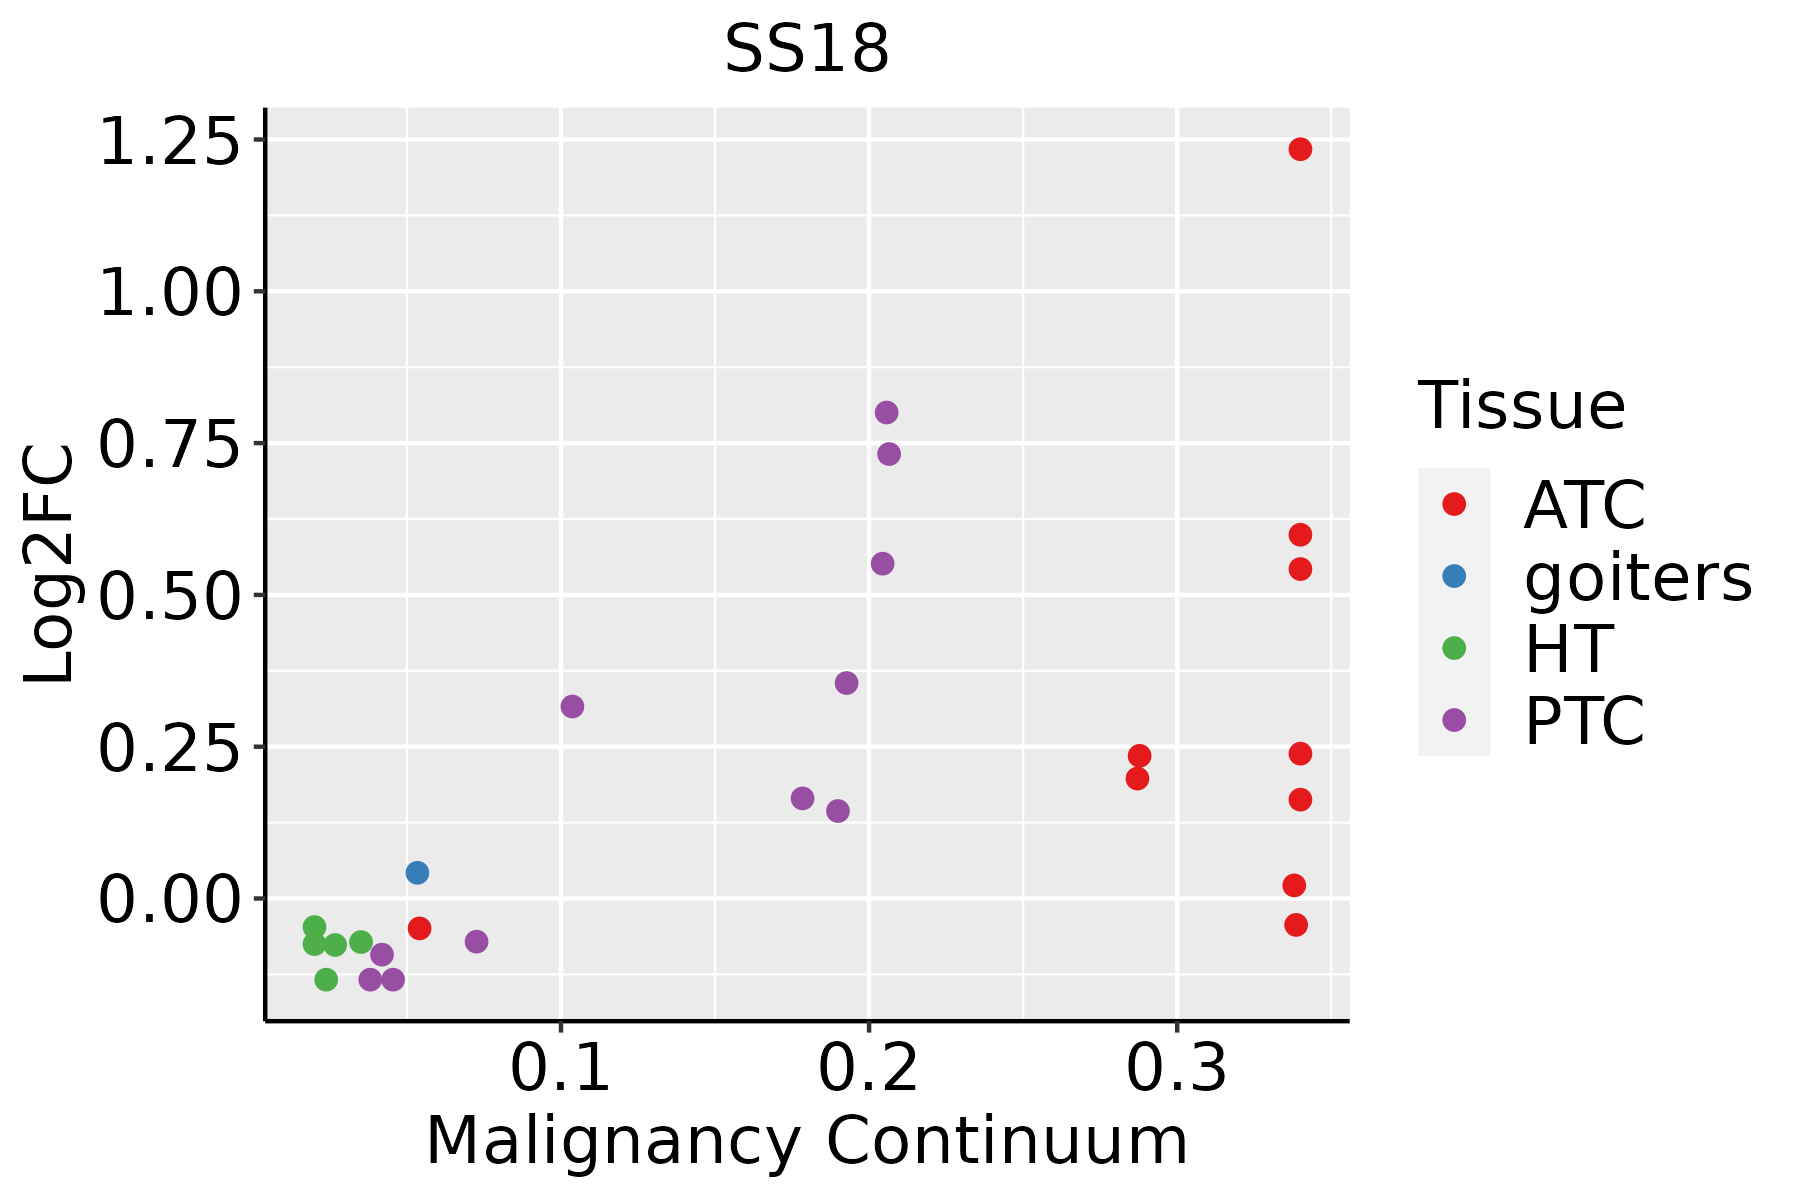 | ATC: Anaplastic thyroid cancer |
| HT: Hashimoto's thyroiditis | ||
| PTC: Papillary thyroid cancer |
| ∗log2FC in expression of this searched gene in stem-like cells from each diseased tissue sample relative to stem-like cells in normal samples in each tissue plotted against the malignancy continuum. Samples are colored based on if they are from different disease stage. |
Top |
Malignant transformation related pathway analysis |
| Find out the enriched GO biological processes and KEGG pathways involved in transition from healthy to precancer to cancer |
| Tissue | Disease Stage | Enriched GO biological Processes |
| Colorectum | AD |  |
| Colorectum | SER |  |
| Colorectum | MSS |  |
| Colorectum | MSI-H |  |
| Colorectum | FAP |  |
| ∗Top 15 enriched GO BP terms are showed in the bar plot of each disease state in each tissue. Each row represents a significant GO biological process which is colored according to the -log10(p.adjust). |
| Page: 1 2 3 4 5 6 7 8 9 |
| GO ID | Tissue | Disease Stage | Description | Gene Ratio | Bg Ratio | pvalue | p.adjust | Count |
| GO:00198277 | Esophagus | HGIN | stem cell population maintenance | 39/2587 | 131/18723 | 1.63e-06 | 6.14e-05 | 39 |
| GO:00987278 | Esophagus | HGIN | maintenance of cell number | 39/2587 | 134/18723 | 3.02e-06 | 1.03e-04 | 39 |
| GO:000632517 | Esophagus | ESCC | chromatin organization | 240/8552 | 409/18723 | 6.52e-08 | 1.14e-06 | 240 |
| GO:009872714 | Esophagus | ESCC | maintenance of cell number | 90/8552 | 134/18723 | 3.94e-07 | 5.43e-06 | 90 |
| GO:001982714 | Esophagus | ESCC | stem cell population maintenance | 88/8552 | 131/18723 | 5.23e-07 | 6.97e-06 | 88 |
| GO:002260420 | Esophagus | ESCC | regulation of cell morphogenesis | 180/8552 | 309/18723 | 5.19e-06 | 5.45e-05 | 180 |
| GO:003134616 | Esophagus | ESCC | positive regulation of cell projection organization | 201/8552 | 353/18723 | 1.19e-05 | 1.11e-04 | 201 |
| GO:001072010 | Esophagus | ESCC | positive regulation of cell development | 172/8552 | 298/18723 | 1.74e-05 | 1.55e-04 | 172 |
| GO:000941020 | Esophagus | ESCC | response to xenobiotic stimulus | 253/8552 | 462/18723 | 4.55e-05 | 3.58e-04 | 253 |
| GO:005076710 | Esophagus | ESCC | regulation of neurogenesis | 203/8552 | 364/18723 | 6.10e-05 | 4.68e-04 | 203 |
| GO:00507697 | Esophagus | ESCC | positive regulation of neurogenesis | 131/8552 | 225/18723 | 9.71e-05 | 6.90e-04 | 131 |
| GO:001097516 | Esophagus | ESCC | regulation of neuron projection development | 240/8552 | 445/18723 | 2.48e-04 | 1.53e-03 | 240 |
| GO:001076920 | Esophagus | ESCC | regulation of cell morphogenesis involved in differentiation | 61/8552 | 96/18723 | 3.12e-04 | 1.85e-03 | 61 |
| GO:00519606 | Esophagus | ESCC | regulation of nervous system development | 237/8552 | 443/18723 | 5.02e-04 | 2.78e-03 | 237 |
| GO:001077018 | Esophagus | ESCC | positive regulation of cell morphogenesis involved in differentiation | 51/8552 | 79/18723 | 5.48e-04 | 3.00e-03 | 51 |
| GO:00519625 | Esophagus | ESCC | positive regulation of nervous system development | 149/8552 | 272/18723 | 1.50e-03 | 7.06e-03 | 149 |
| GO:00480133 | Esophagus | ESCC | ephrin receptor signaling pathway | 33/8552 | 51/18723 | 4.77e-03 | 1.85e-02 | 33 |
| GO:001635816 | Esophagus | ESCC | dendrite development | 130/8552 | 243/18723 | 8.33e-03 | 2.95e-02 | 130 |
| GO:00094107 | Liver | NAFLD | response to xenobiotic stimulus | 88/1882 | 462/18723 | 2.53e-09 | 4.11e-07 | 88 |
| GO:00226047 | Liver | NAFLD | regulation of cell morphogenesis | 62/1882 | 309/18723 | 8.35e-08 | 7.09e-06 | 62 |
| Page: 1 2 3 4 5 6 |
| Pathway ID | Tissue | Disease Stage | Description | Gene Ratio | Bg Ratio | pvalue | p.adjust | qvalue | Count |
| hsa052028 | Esophagus | ESCC | Transcriptional misregulation in cancer | 116/4205 | 193/8465 | 2.08e-03 | 5.95e-03 | 3.05e-03 | 116 |
| hsa0520213 | Esophagus | ESCC | Transcriptional misregulation in cancer | 116/4205 | 193/8465 | 2.08e-03 | 5.95e-03 | 3.05e-03 | 116 |
| Page: 1 |
Top |
Cell-cell communication analysis |
| Identification of potential cell-cell interactions between two cell types and their ligand-receptor pairs for different disease states |
| Ligand | Receptor | LRpair | Pathway | Tissue | Disease Stage |
| Page: 1 |
Top |
Single-cell gene regulatory network inference analysis |
| Find out the significant the regulons (TFs) and the target genes of each regulon across cell types for different disease states |
| TF | Cell Type | Tissue | Disease Stage | Target Gene | RSS | Regulon Activity |
| ∗The dot plots of a searched regulon are shown for all cell subpopulations in each disease state of each tissue based on the regulon specific score inferred using pySCENIC and by calculating the average expression. |
| Page: 1 |
Top |
Somatic mutation of malignant transformation related genes |
| Annotation of somatic variants for genes involved in malignant transformation |
| Hugo Symbol | Variant Class | Variant Classification | dbSNP RS | HGVSc | HGVSp | HGVSp Short | SWISSPROT | BIOTYPE | SIFT | PolyPhen | Tumor Sample Barcode | Tissue | Histology | Sex | Age | Stage | Therapy Types | Drugs | Outcome |
| SS18 | SNV | Missense_Mutation | c.199N>A | p.Ser67Thr | p.S67T | Q15532 | protein_coding | deleterious(0.01) | probably_damaging(0.99) | TCGA-AC-A23C-01 | Breast | breast invasive carcinoma | Female | <65 | I/II | Chemotherapy | chemo | CR | |
| SS18 | SNV | Missense_Mutation | c.635C>G | p.Ser212Cys | p.S212C | Q15532 | protein_coding | deleterious_low_confidence(0) | probably_damaging(0.922) | TCGA-AC-A23H-01 | Breast | breast invasive carcinoma | Female | >=65 | I/II | Unknown | Unknown | PD | |
| SS18 | SNV | Missense_Mutation | c.236N>A | p.Pro79His | p.P79H | Q15532 | protein_coding | deleterious(0.02) | probably_damaging(0.969) | TCGA-AN-A0AK-01 | Breast | breast invasive carcinoma | Female | >=65 | I/II | Unknown | Unknown | SD | |
| SS18 | SNV | Missense_Mutation | c.637C>G | p.Gln213Glu | p.Q213E | Q15532 | protein_coding | deleterious_low_confidence(0.05) | possibly_damaging(0.449) | TCGA-C8-A26W-01 | Breast | breast invasive carcinoma | Female | <65 | I/II | Chemotherapy | doxorubicin | CR | |
| SS18 | SNV | Missense_Mutation | rs377058145 | c.295C>T | p.Pro99Ser | p.P99S | Q15532 | protein_coding | tolerated_low_confidence(0.86) | benign(0.063) | TCGA-C8-A8HQ-01 | Breast | breast invasive carcinoma | Female | <65 | I/II | Unknown | Unknown | SD |
| SS18 | insertion | Frame_Shift_Ins | novel | c.1253_1254insAAAATCT | p.Ter419LysfsTer37 | p.*419Kfs*37 | Q15532 | protein_coding | TCGA-A7-A26I-01 | Breast | breast invasive carcinoma | Female | >=65 | I/II | Chemotherapy | cytoxan | SD | ||
| SS18 | SNV | Missense_Mutation | novel | c.373N>A | p.Gly125Ser | p.G125S | Q15532 | protein_coding | tolerated_low_confidence(0.06) | benign(0.389) | TCGA-2W-A8YY-01 | Cervix | cervical & endocervical cancer | Female | <65 | I/II | Chemotherapy | cisplatin | CR |
| SS18 | SNV | Missense_Mutation | rs753910503 | c.476N>T | p.Ser159Phe | p.S159F | Q15532 | protein_coding | deleterious(0) | probably_damaging(0.972) | TCGA-AA-3930-01 | Colorectum | colon adenocarcinoma | Male | >=65 | III/IV | Chemotherapy | capecitabine | PD |
| SS18 | SNV | Missense_Mutation | c.450N>T | p.Met150Ile | p.M150I | Q15532 | protein_coding | tolerated_low_confidence(0.18) | benign(0.391) | TCGA-AA-3994-01 | Colorectum | colon adenocarcinoma | Male | >=65 | III/IV | Chemotherapy | capecitabine | CR | |
| SS18 | insertion | In_Frame_Ins | novel | c.974_975insTGATAA | p.Gly325_Asn326insAspLys | p.G325_N326insDK | Q15532 | protein_coding | TCGA-AM-5820-01 | Colorectum | colon adenocarcinoma | Female | <65 | I/II | Unknown | Unknown | SD |
| Page: 1 2 3 4 5 |
Top |
Related drugs of malignant transformation related genes |
| Identification of chemicals and drugs interact with genes involved in malignant transfromation |
| (DGIdb 4.0) |
| Entrez ID | Symbol | Category | Interaction Types | Drug Claim Name | Drug Name | PMIDs |
| Page: 1 |

Copyright 2023-Present -The University of Texas Health Science Center at Houston |