
|
|||||
|
 | |
| |
| |
| |
| |
| |
|
Gene: SRXN1 |
Gene summary for SRXN1 |
| Gene information | Species | Human | Gene symbol | SRXN1 | Gene ID | 140809 |
| Gene name | sulfiredoxin 1 | |
| Gene Alias | C20orf139 | |
| Cytomap | 20p13 | |
| Gene Type | protein-coding | GO ID | GO:0006950 | UniProtAcc | Q9BYN0 |
Top |
Malignant transformation analysis |
| Identification of the aberrant gene expression in precancerous and cancerous lesions by comparing the gene expression of stem-like cells in diseased tissues with normal stem cells |
| Entrez ID | Symbol | Replicates | Species | Organ | Tissue | Adj P-value | Log2FC | Malignancy |
| 140809 | SRXN1 | LZE2T | Human | Esophagus | ESCC | 3.55e-16 | 9.30e-01 | 0.082 |
| 140809 | SRXN1 | LZE4T | Human | Esophagus | ESCC | 6.29e-20 | 5.07e-01 | 0.0811 |
| 140809 | SRXN1 | LZE7T | Human | Esophagus | ESCC | 3.98e-06 | 2.84e-01 | 0.0667 |
| 140809 | SRXN1 | LZE22T | Human | Esophagus | ESCC | 1.57e-02 | 1.93e-01 | 0.068 |
| 140809 | SRXN1 | LZE24T | Human | Esophagus | ESCC | 4.15e-02 | 1.14e-01 | 0.0596 |
| 140809 | SRXN1 | LZE21T | Human | Esophagus | ESCC | 9.73e-05 | 3.00e-01 | 0.0655 |
| 140809 | SRXN1 | P4T-E | Human | Esophagus | ESCC | 6.14e-11 | 2.61e-01 | 0.1323 |
| 140809 | SRXN1 | P9T-E | Human | Esophagus | ESCC | 4.11e-15 | 4.57e-01 | 0.1131 |
| 140809 | SRXN1 | P11T-E | Human | Esophagus | ESCC | 2.46e-02 | 1.31e-01 | 0.1426 |
| 140809 | SRXN1 | P12T-E | Human | Esophagus | ESCC | 1.78e-03 | 1.19e-01 | 0.1122 |
| 140809 | SRXN1 | P15T-E | Human | Esophagus | ESCC | 1.22e-08 | 2.14e-01 | 0.1149 |
| 140809 | SRXN1 | P20T-E | Human | Esophagus | ESCC | 5.73e-03 | 1.27e-01 | 0.1124 |
| 140809 | SRXN1 | P21T-E | Human | Esophagus | ESCC | 1.97e-10 | 2.61e-01 | 0.1617 |
| 140809 | SRXN1 | P22T-E | Human | Esophagus | ESCC | 1.88e-04 | 1.11e-01 | 0.1236 |
| 140809 | SRXN1 | P23T-E | Human | Esophagus | ESCC | 1.99e-08 | 2.21e-01 | 0.108 |
| 140809 | SRXN1 | P24T-E | Human | Esophagus | ESCC | 9.44e-07 | 1.82e-01 | 0.1287 |
| 140809 | SRXN1 | P28T-E | Human | Esophagus | ESCC | 1.35e-23 | 4.84e-01 | 0.1149 |
| 140809 | SRXN1 | P30T-E | Human | Esophagus | ESCC | 1.85e-33 | 1.27e+00 | 0.137 |
| 140809 | SRXN1 | P32T-E | Human | Esophagus | ESCC | 1.97e-10 | 2.97e-01 | 0.1666 |
| 140809 | SRXN1 | P39T-E | Human | Esophagus | ESCC | 9.02e-11 | 2.48e-01 | 0.0894 |
| Page: 1 2 |
| Tissue | Expression Dynamics | Abbreviation |
| Esophagus | 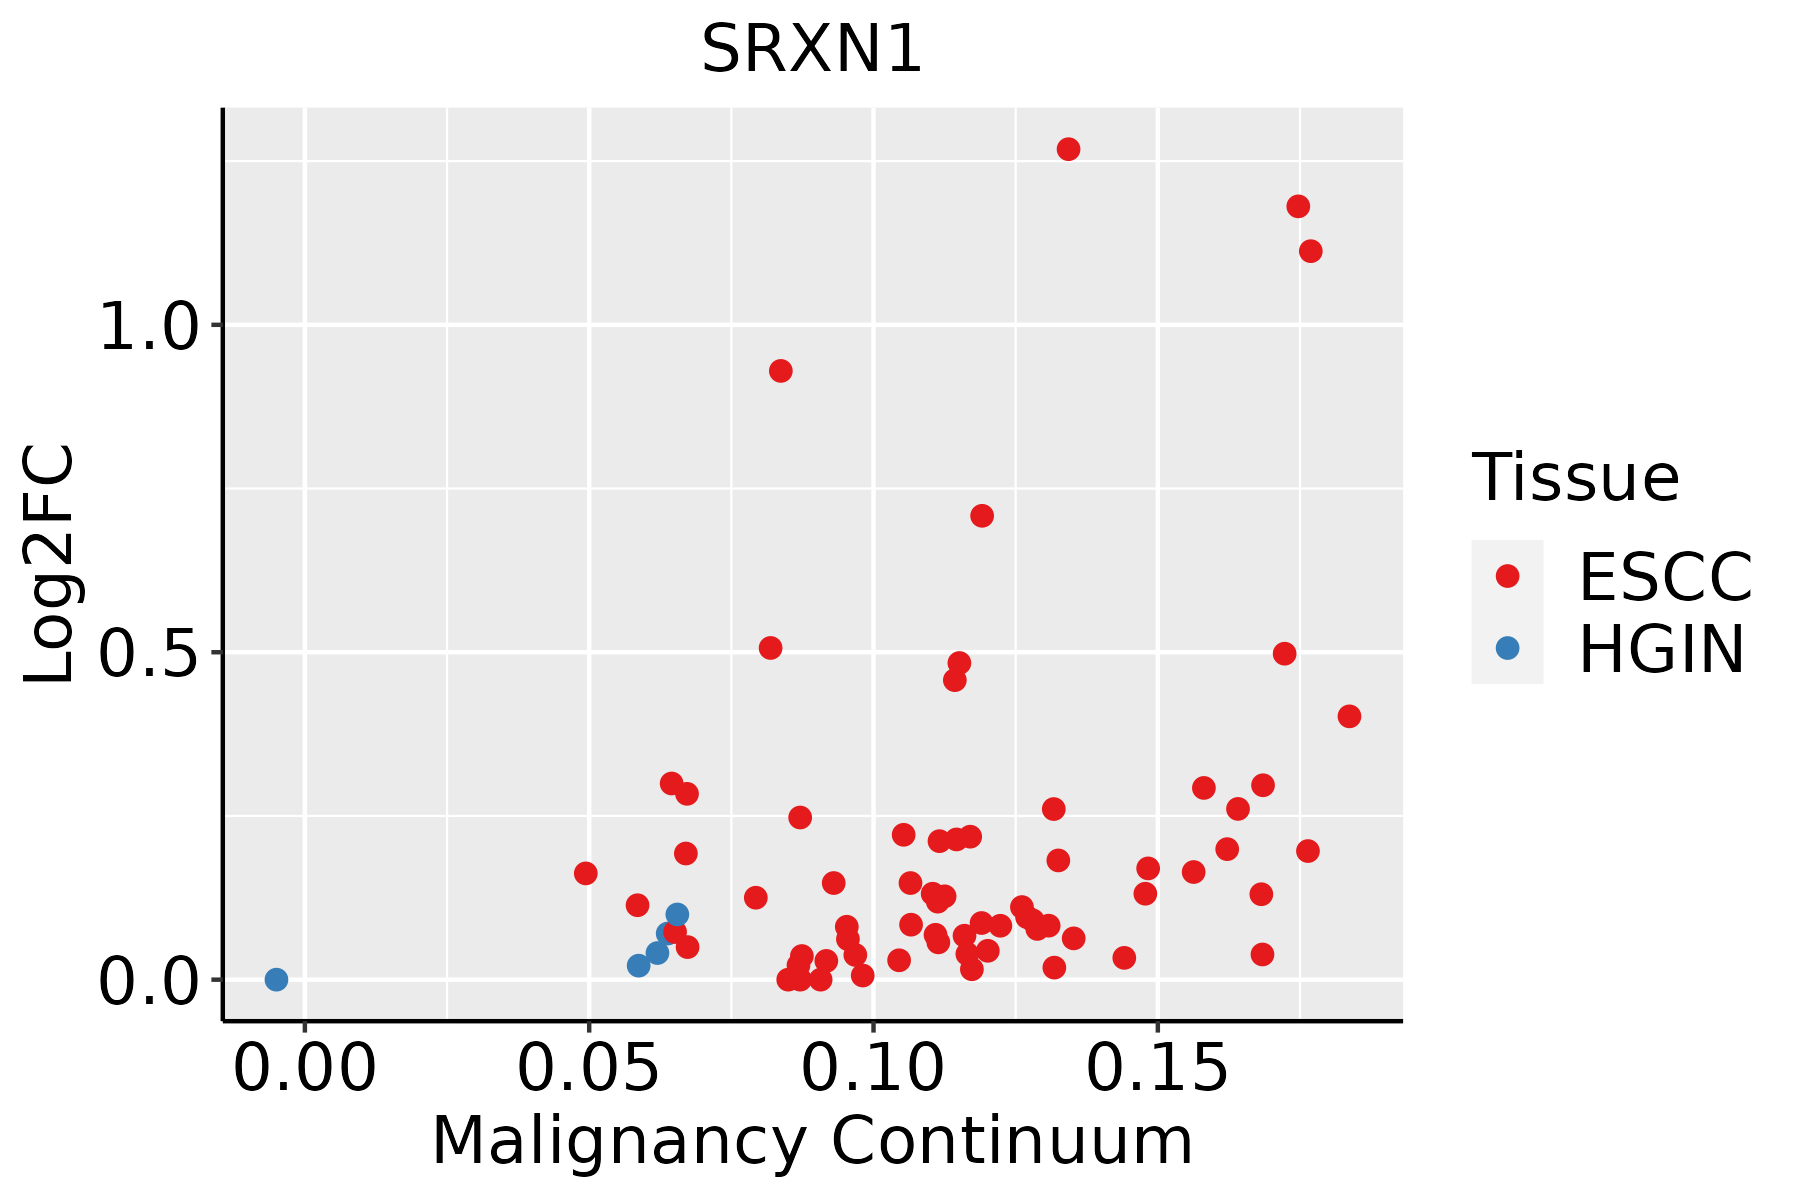 | ESCC: Esophageal squamous cell carcinoma |
| HGIN: High-grade intraepithelial neoplasias | ||
| LGIN: Low-grade intraepithelial neoplasias | ||
| Liver | 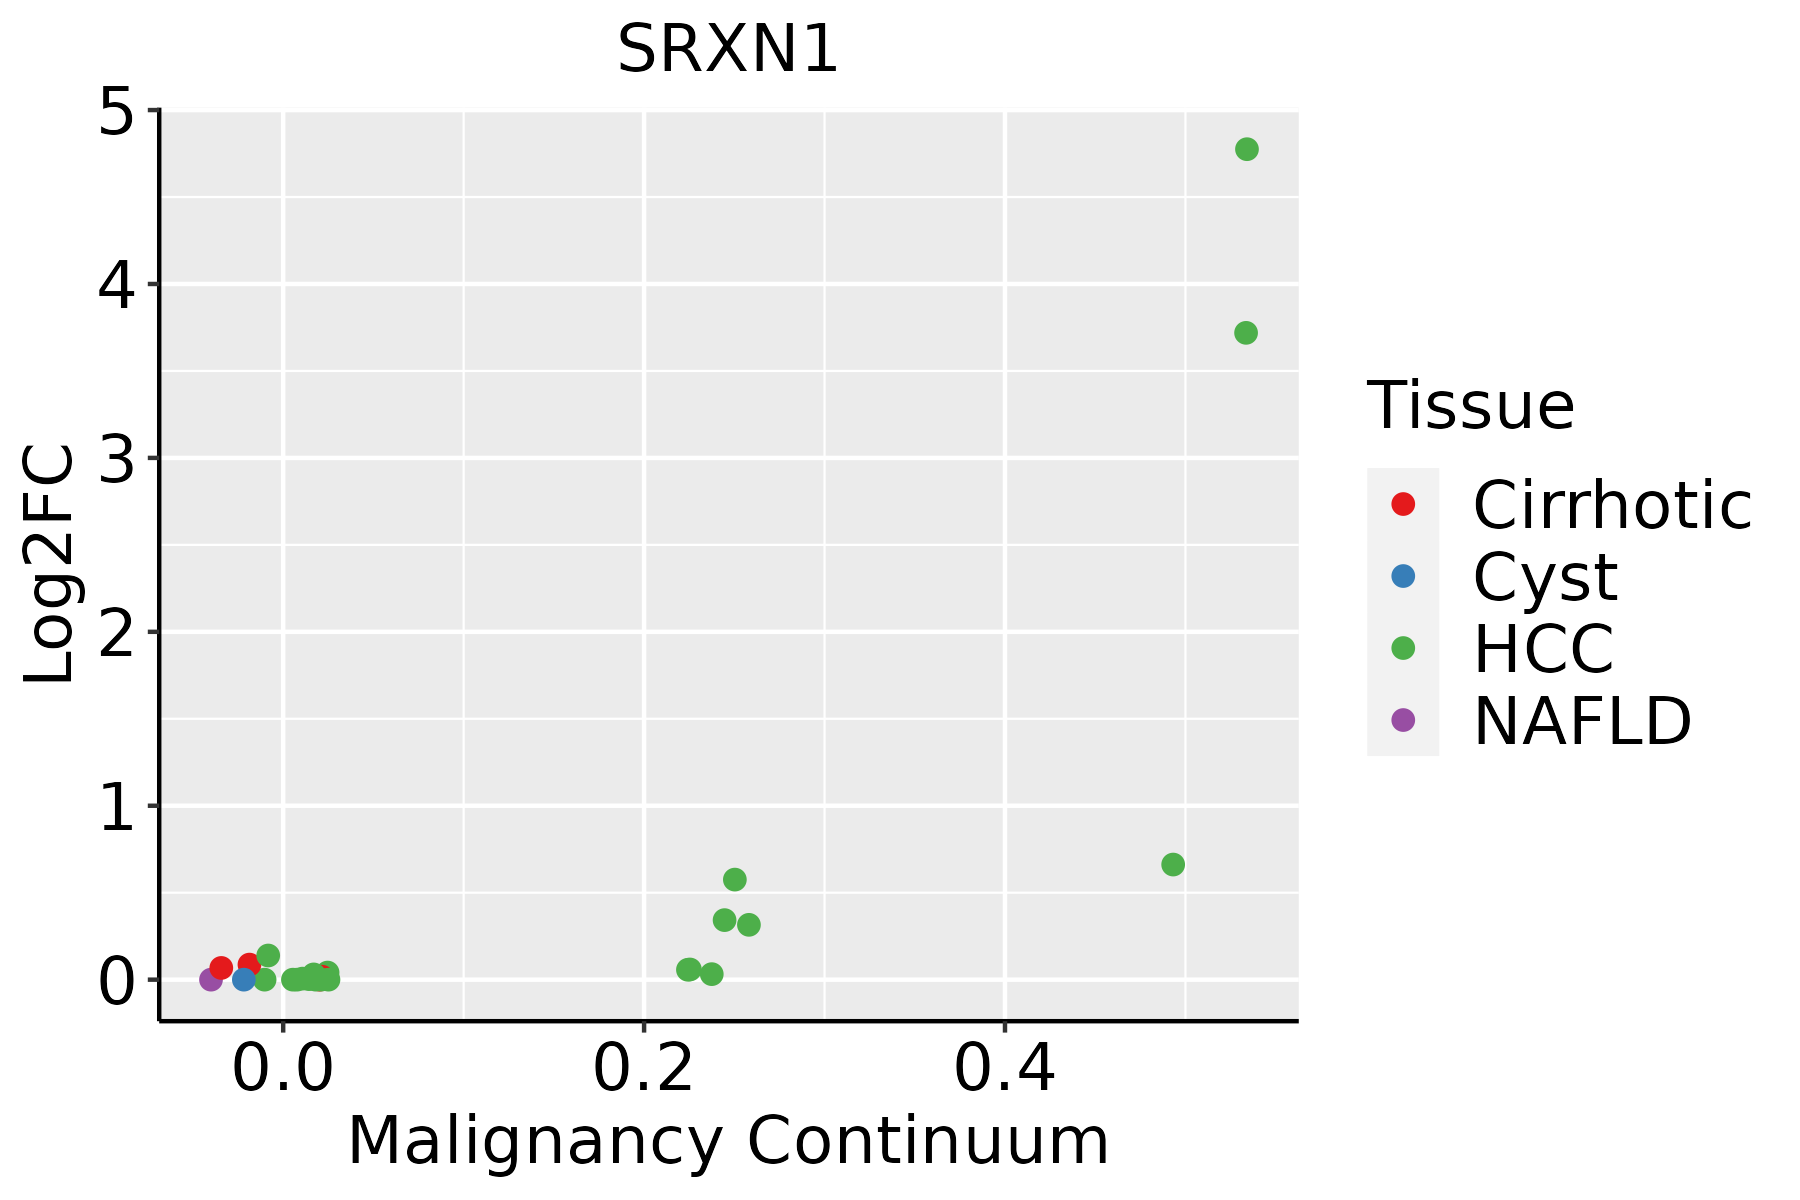 | HCC: Hepatocellular carcinoma |
| NAFLD: Non-alcoholic fatty liver disease |
| ∗log2FC in expression of this searched gene in stem-like cells from each diseased tissue sample relative to stem-like cells in normal samples in each tissue plotted against the malignancy continuum. Samples are colored based on if they are from different disease stage. |
Top |
Malignant transformation related pathway analysis |
| Find out the enriched GO biological processes and KEGG pathways involved in transition from healthy to precancer to cancer |
| Tissue | Disease Stage | Enriched GO biological Processes |
| Colorectum | AD |  |
| Colorectum | SER |  |
| Colorectum | MSS |  |
| Colorectum | MSI-H |  |
| Colorectum | FAP |  |
| ∗Top 15 enriched GO BP terms are showed in the bar plot of each disease state in each tissue. Each row represents a significant GO biological process which is colored according to the -log10(p.adjust). |
| Page: 1 2 3 4 5 6 7 8 9 |
| GO ID | Tissue | Disease Stage | Description | Gene Ratio | Bg Ratio | pvalue | p.adjust | Count |
| GO:0006979111 | Esophagus | ESCC | response to oxidative stress | 303/8552 | 446/18723 | 7.15e-22 | 1.30e-19 | 303 |
| GO:0062197111 | Esophagus | ESCC | cellular response to chemical stress | 234/8552 | 337/18723 | 5.37e-19 | 5.97e-17 | 234 |
| GO:0034599111 | Esophagus | ESCC | cellular response to oxidative stress | 197/8552 | 288/18723 | 3.76e-15 | 2.15e-13 | 197 |
| GO:000963620 | Esophagus | ESCC | response to toxic substance | 150/8552 | 262/18723 | 1.00e-04 | 7.12e-04 | 150 |
| GO:1990748110 | Esophagus | ESCC | cellular detoxification | 70/8552 | 116/18723 | 1.02e-03 | 5.17e-03 | 70 |
| GO:0097237110 | Esophagus | ESCC | cellular response to toxic substance | 72/8552 | 124/18723 | 3.65e-03 | 1.49e-02 | 72 |
| GO:0098869110 | Esophagus | ESCC | cellular oxidant detoxification | 60/8552 | 101/18723 | 3.76e-03 | 1.53e-02 | 60 |
| GO:000697922 | Liver | HCC | response to oxidative stress | 281/7958 | 446/18723 | 9.75e-19 | 1.24e-16 | 281 |
| GO:006219722 | Liver | HCC | cellular response to chemical stress | 216/7958 | 337/18723 | 6.86e-16 | 5.44e-14 | 216 |
| GO:003459922 | Liver | HCC | cellular response to oxidative stress | 183/7958 | 288/18723 | 3.65e-13 | 1.93e-11 | 183 |
| GO:000963622 | Liver | HCC | response to toxic substance | 153/7958 | 262/18723 | 1.37e-07 | 2.58e-06 | 153 |
| GO:199074812 | Liver | HCC | cellular detoxification | 70/7958 | 116/18723 | 7.87e-05 | 7.02e-04 | 70 |
| GO:009723712 | Liver | HCC | cellular response to toxic substance | 74/7958 | 124/18723 | 8.36e-05 | 7.36e-04 | 74 |
| GO:009875412 | Liver | HCC | detoxification | 87/7958 | 152/18723 | 1.70e-04 | 1.35e-03 | 87 |
| GO:009886912 | Liver | HCC | cellular oxidant detoxification | 59/7958 | 101/18723 | 9.00e-04 | 5.31e-03 | 59 |
| Page: 1 |
| Pathway ID | Tissue | Disease Stage | Description | Gene Ratio | Bg Ratio | pvalue | p.adjust | qvalue | Count |
| Page: 1 |
Top |
Cell-cell communication analysis |
| Identification of potential cell-cell interactions between two cell types and their ligand-receptor pairs for different disease states |
| Ligand | Receptor | LRpair | Pathway | Tissue | Disease Stage |
| Page: 1 |
Top |
Single-cell gene regulatory network inference analysis |
| Find out the significant the regulons (TFs) and the target genes of each regulon across cell types for different disease states |
| TF | Cell Type | Tissue | Disease Stage | Target Gene | RSS | Regulon Activity |
| ∗The dot plots of a searched regulon are shown for all cell subpopulations in each disease state of each tissue based on the regulon specific score inferred using pySCENIC and by calculating the average expression. |
| Page: 1 |
Top |
Somatic mutation of malignant transformation related genes |
| Annotation of somatic variants for genes involved in malignant transformation |
| Hugo Symbol | Variant Class | Variant Classification | dbSNP RS | HGVSc | HGVSp | HGVSp Short | SWISSPROT | BIOTYPE | SIFT | PolyPhen | Tumor Sample Barcode | Tissue | Histology | Sex | Age | Stage | Therapy Types | Drugs | Outcome |
| SRXN1 | SNV | Missense_Mutation | rs375211313 | c.238N>A | p.Asp80Asn | p.D80N | Q9BYN0 | protein_coding | deleterious(0) | probably_damaging(0.999) | TCGA-AN-A046-01 | Breast | breast invasive carcinoma | Female | >=65 | I/II | Unknown | Unknown | SD |
| SRXN1 | SNV | Missense_Mutation | rs758013735 | c.308N>T | p.Ala103Val | p.A103V | Q9BYN0 | protein_coding | tolerated(0.22) | possibly_damaging(0.482) | TCGA-AN-A0AK-01 | Breast | breast invasive carcinoma | Female | >=65 | I/II | Unknown | Unknown | SD |
| SRXN1 | SNV | Missense_Mutation | c.338N>A | p.Ile113Asn | p.I113N | Q9BYN0 | protein_coding | deleterious(0) | probably_damaging(1) | TCGA-AO-A0JJ-01 | Breast | breast invasive carcinoma | Female | <65 | I/II | Chemotherapy | cyclophospamide | SD | |
| SRXN1 | SNV | Missense_Mutation | c.331N>A | p.Glu111Lys | p.E111K | Q9BYN0 | protein_coding | tolerated(0.29) | benign(0.058) | TCGA-E2-A2P6-01 | Breast | breast invasive carcinoma | Female | >=65 | I/II | Hormone Therapy | anastrozole | SD | |
| SRXN1 | SNV | Missense_Mutation | novel | c.349N>T | p.Leu117Phe | p.L117F | Q9BYN0 | protein_coding | deleterious(0) | probably_damaging(0.981) | TCGA-2W-A8YY-01 | Cervix | cervical & endocervical cancer | Female | <65 | I/II | Chemotherapy | cisplatin | CR |
| SRXN1 | SNV | Missense_Mutation | rs781543846 | c.301N>T | p.Arg101Cys | p.R101C | Q9BYN0 | protein_coding | deleterious(0) | probably_damaging(1) | TCGA-AD-5900-01 | Colorectum | colon adenocarcinoma | Male | >=65 | I/II | Unknown | Unknown | SD |
| SRXN1 | SNV | Missense_Mutation | c.256N>T | p.Gly86Trp | p.G86W | Q9BYN0 | protein_coding | deleterious(0) | probably_damaging(1) | TCGA-AZ-6601-01 | Colorectum | colon adenocarcinoma | Male | >=65 | I/II | Unknown | Unknown | PD | |
| SRXN1 | SNV | Missense_Mutation | rs777286381 | c.307G>A | p.Ala103Thr | p.A103T | Q9BYN0 | protein_coding | tolerated(0.26) | benign(0.313) | TCGA-A5-A0VP-01 | Endometrium | uterine corpus endometrioid carcinoma | Female | >=65 | I/II | Unknown | Unknown | SD |
| SRXN1 | SNV | Missense_Mutation | rs144940742 | c.343N>A | p.Ala115Thr | p.A115T | Q9BYN0 | protein_coding | deleterious(0) | probably_damaging(0.985) | TCGA-B5-A11Y-01 | Endometrium | uterine corpus endometrioid carcinoma | Female | <65 | I/II | Unknown | Unknown | SD |
| SRXN1 | SNV | Missense_Mutation | rs777286381 | c.307N>A | p.Ala103Thr | p.A103T | Q9BYN0 | protein_coding | tolerated(0.26) | benign(0.313) | TCGA-2Y-A9GU-01 | Liver | liver hepatocellular carcinoma | Female | <65 | I/II | Unknown | Unknown | SD |
| Page: 1 2 |
Top |
Related drugs of malignant transformation related genes |
| Identification of chemicals and drugs interact with genes involved in malignant transfromation |
| (DGIdb 4.0) |
| Entrez ID | Symbol | Category | Interaction Types | Drug Claim Name | Drug Name | PMIDs |
| Page: 1 |

Copyright 2023-Present -The University of Texas Health Science Center at Houston |