
|
|||||
|
 | |
| |
| |
| |
| |
| |
|
Gene: SRSF7 |
Gene summary for SRSF7 |
| Gene information | Species | Human | Gene symbol | SRSF7 | Gene ID | 6432 |
| Gene name | serine and arginine rich splicing factor 7 | |
| Gene Alias | 9G8 | |
| Cytomap | 2p22.1 | |
| Gene Type | protein-coding | GO ID | GO:0000375 | UniProtAcc | Q16629 |
Top |
Malignant transformation analysis |
| Identification of the aberrant gene expression in precancerous and cancerous lesions by comparing the gene expression of stem-like cells in diseased tissues with normal stem cells |
| Entrez ID | Symbol | Replicates | Species | Organ | Tissue | Adj P-value | Log2FC | Malignancy |
| 6432 | SRSF7 | GSM4909277 | Human | Breast | Precancer | 2.29e-07 | 5.65e-01 | 0.0177 |
| 6432 | SRSF7 | GSM4909285 | Human | Breast | IDC | 4.90e-06 | 2.91e-01 | 0.21 |
| 6432 | SRSF7 | GSM4909286 | Human | Breast | IDC | 1.43e-04 | -1.45e-01 | 0.1081 |
| 6432 | SRSF7 | GSM4909294 | Human | Breast | IDC | 3.25e-02 | -2.79e-01 | 0.2022 |
| 6432 | SRSF7 | GSM4909296 | Human | Breast | IDC | 1.25e-10 | -4.22e-01 | 0.1524 |
| 6432 | SRSF7 | GSM4909297 | Human | Breast | IDC | 2.96e-15 | -8.76e-02 | 0.1517 |
| 6432 | SRSF7 | GSM4909301 | Human | Breast | IDC | 1.13e-05 | -4.35e-01 | 0.1577 |
| 6432 | SRSF7 | GSM4909308 | Human | Breast | IDC | 1.03e-02 | -1.30e-01 | 0.158 |
| 6432 | SRSF7 | GSM4909311 | Human | Breast | IDC | 1.26e-35 | -6.93e-01 | 0.1534 |
| 6432 | SRSF7 | GSM4909312 | Human | Breast | IDC | 5.63e-06 | -2.86e-01 | 0.1552 |
| 6432 | SRSF7 | GSM4909313 | Human | Breast | IDC | 1.71e-05 | -4.32e-01 | 0.0391 |
| 6432 | SRSF7 | GSM4909317 | Human | Breast | IDC | 1.31e-04 | 3.05e-01 | 0.1355 |
| 6432 | SRSF7 | GSM4909319 | Human | Breast | IDC | 1.32e-37 | -5.38e-01 | 0.1563 |
| 6432 | SRSF7 | GSM4909320 | Human | Breast | IDC | 2.91e-04 | -4.23e-01 | 0.1575 |
| 6432 | SRSF7 | GSM4909321 | Human | Breast | IDC | 7.40e-07 | -1.28e-01 | 0.1559 |
| 6432 | SRSF7 | brca2 | Human | Breast | Precancer | 1.34e-07 | 8.40e-02 | -0.024 |
| 6432 | SRSF7 | brca10 | Human | Breast | Precancer | 1.11e-13 | -6.09e-01 | -0.0029 |
| 6432 | SRSF7 | NCCBC14 | Human | Breast | DCIS | 4.37e-06 | -2.05e-01 | 0.2021 |
| 6432 | SRSF7 | NCCBC5 | Human | Breast | DCIS | 5.76e-07 | -6.46e-02 | 0.2046 |
| 6432 | SRSF7 | P1 | Human | Breast | IDC | 2.92e-22 | -6.83e-02 | 0.1527 |
| Page: 1 2 3 4 5 6 7 8 9 10 11 12 13 |
| Tissue | Expression Dynamics | Abbreviation |
| Breast |  | IDC: Invasive ductal carcinoma |
| DCIS: Ductal carcinoma in situ | ||
| Precancer(BRCA1-mut): Precancerous lesion from BRCA1 mutation carriers | ||
| Cervix | 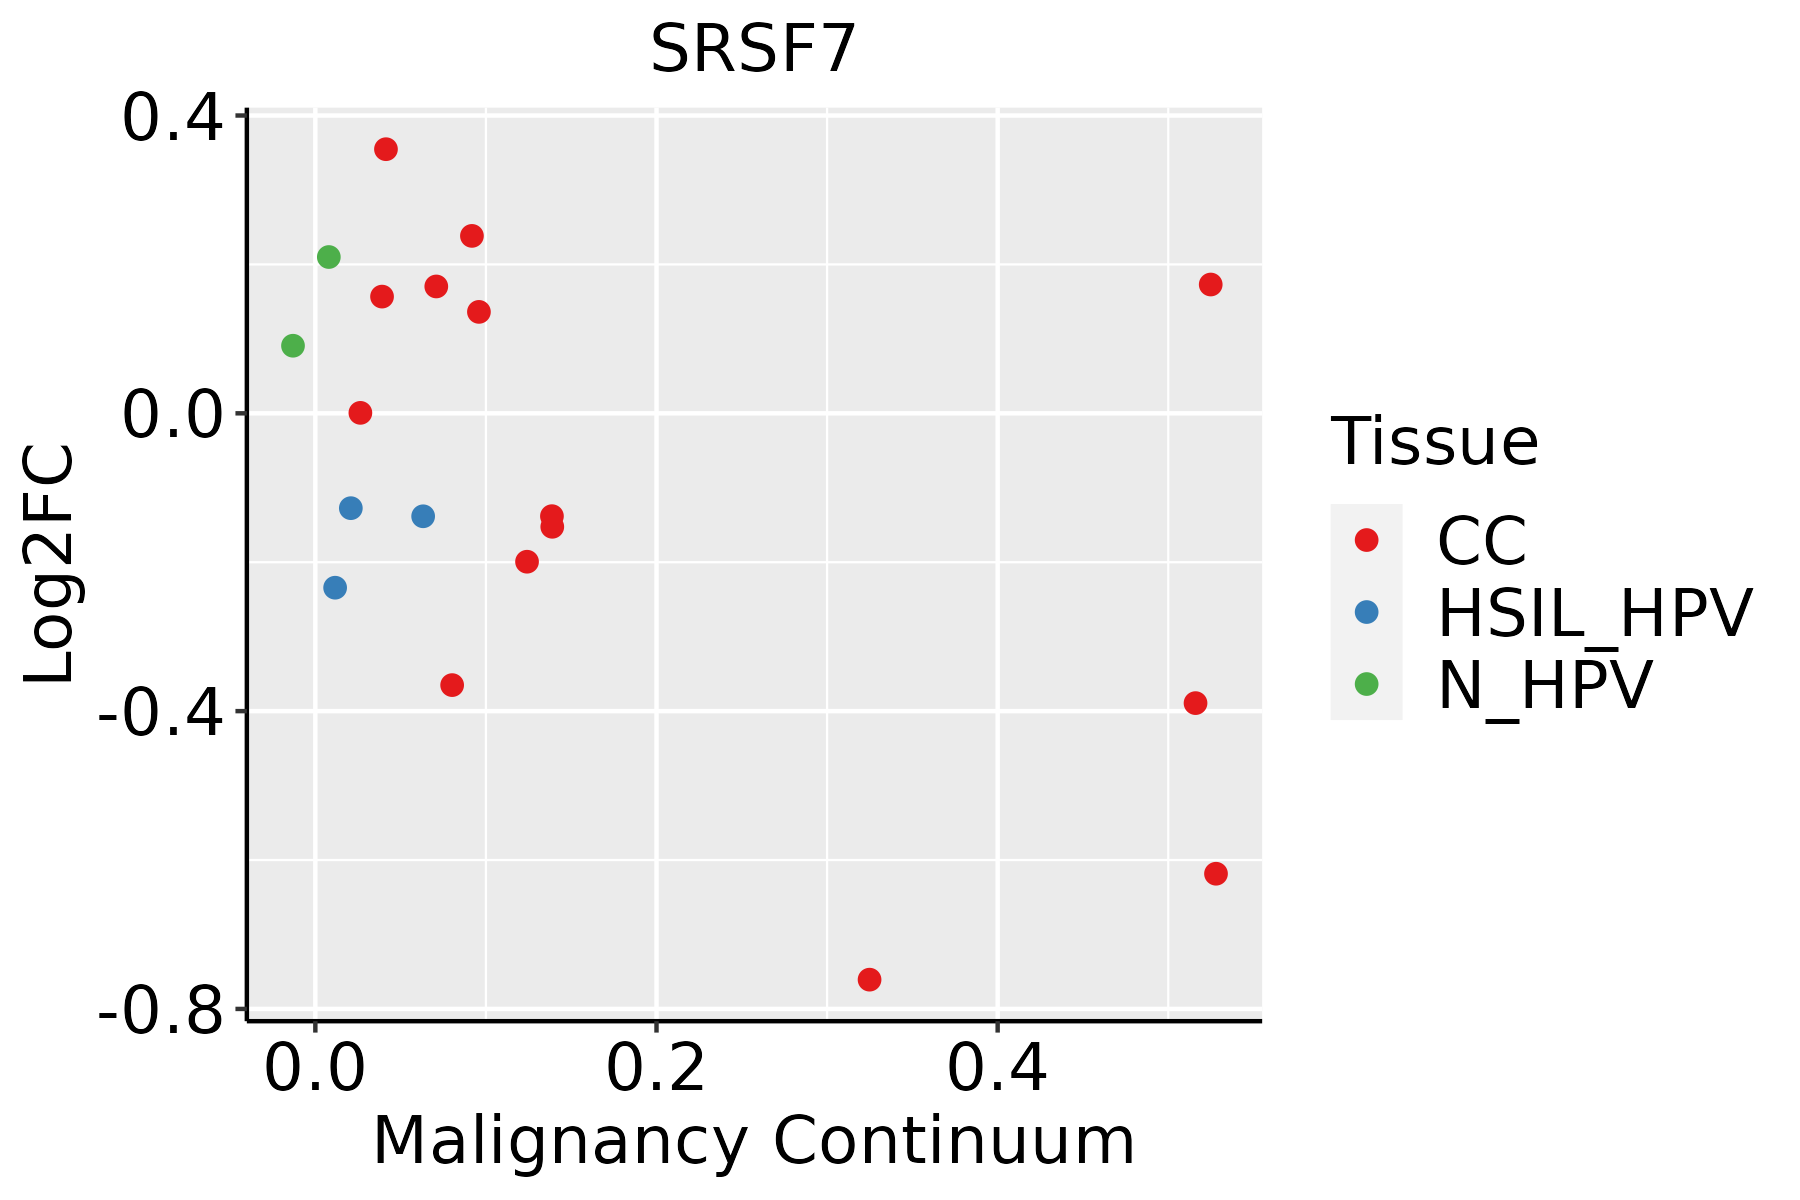 | CC: Cervix cancer |
| HSIL_HPV: HPV-infected high-grade squamous intraepithelial lesions | ||
| N_HPV: HPV-infected normal cervix | ||
| Endometrium |  | AEH: Atypical endometrial hyperplasia |
| EEC: Endometrioid Cancer | ||
| Esophagus | 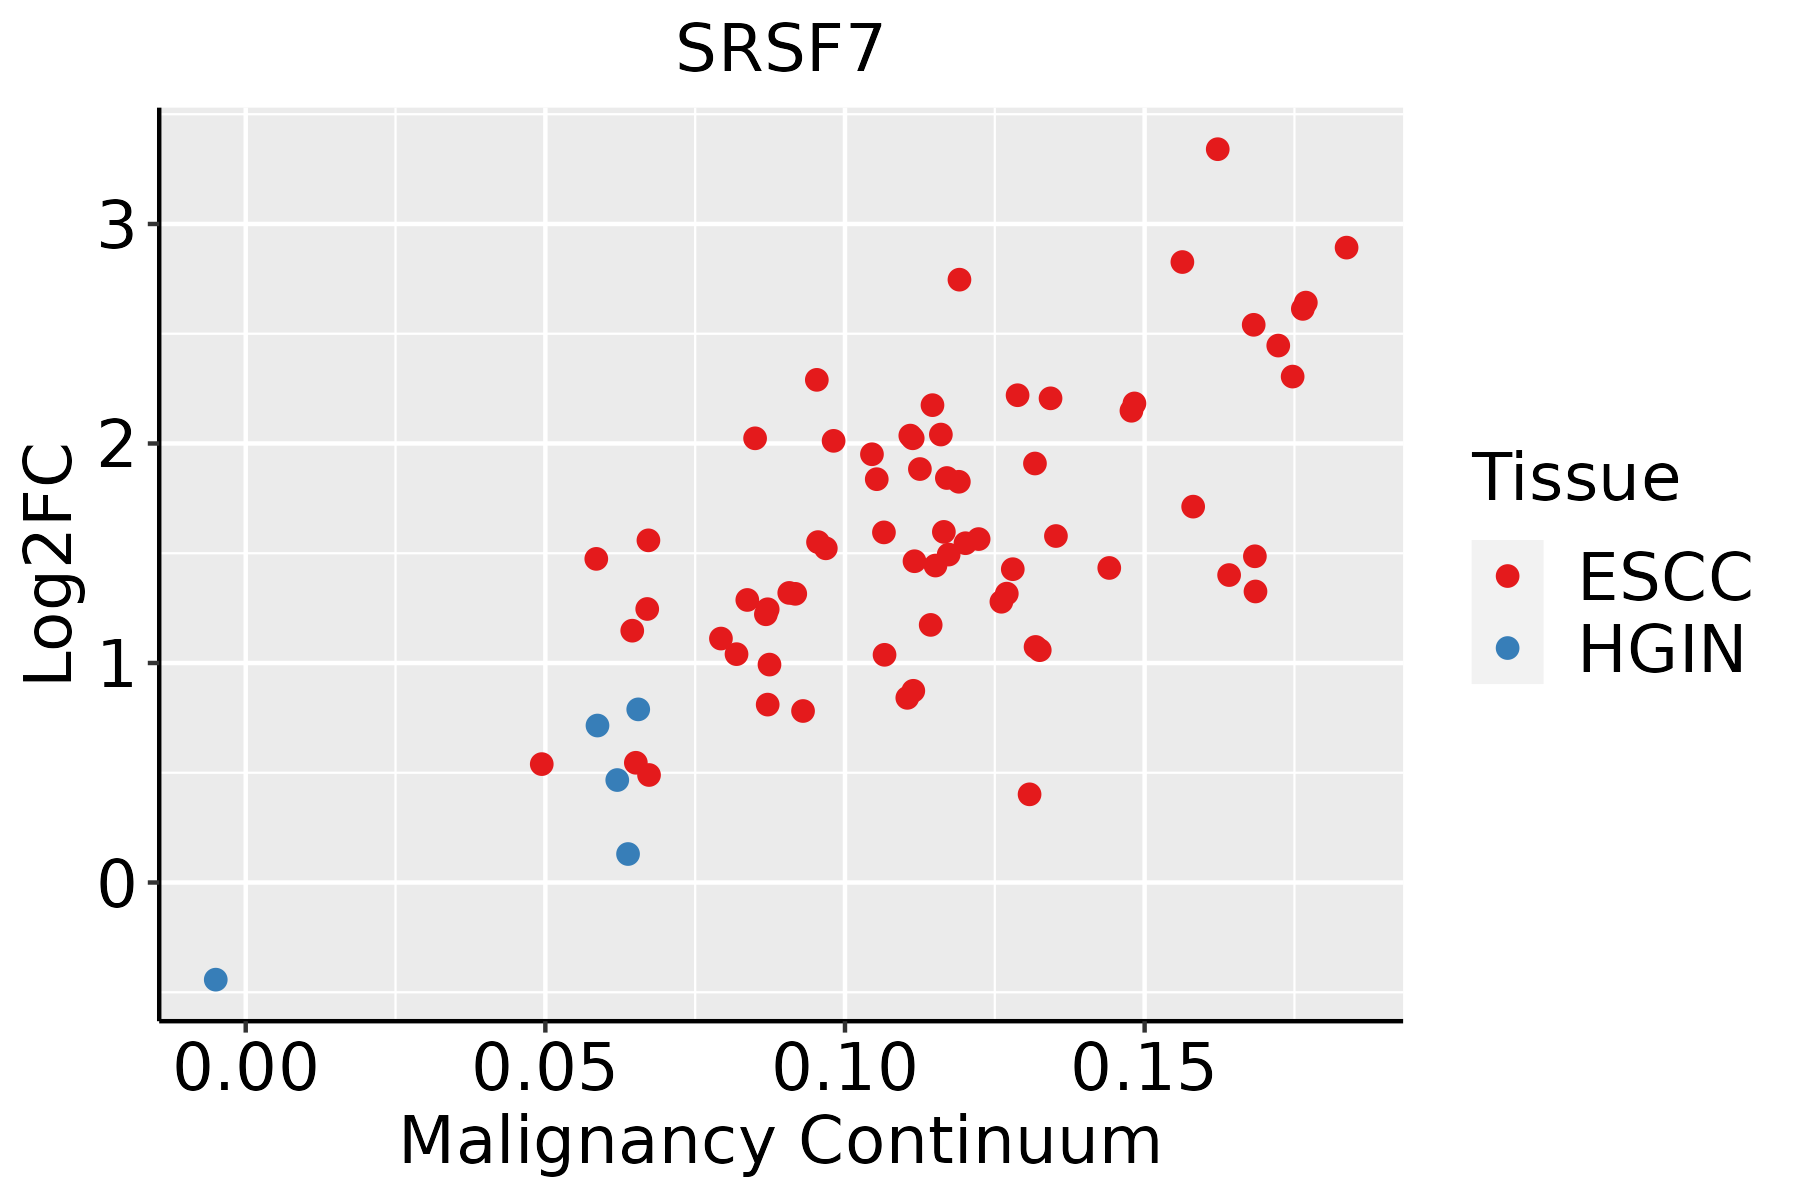 | ESCC: Esophageal squamous cell carcinoma |
| HGIN: High-grade intraepithelial neoplasias | ||
| LGIN: Low-grade intraepithelial neoplasias | ||
| GC | 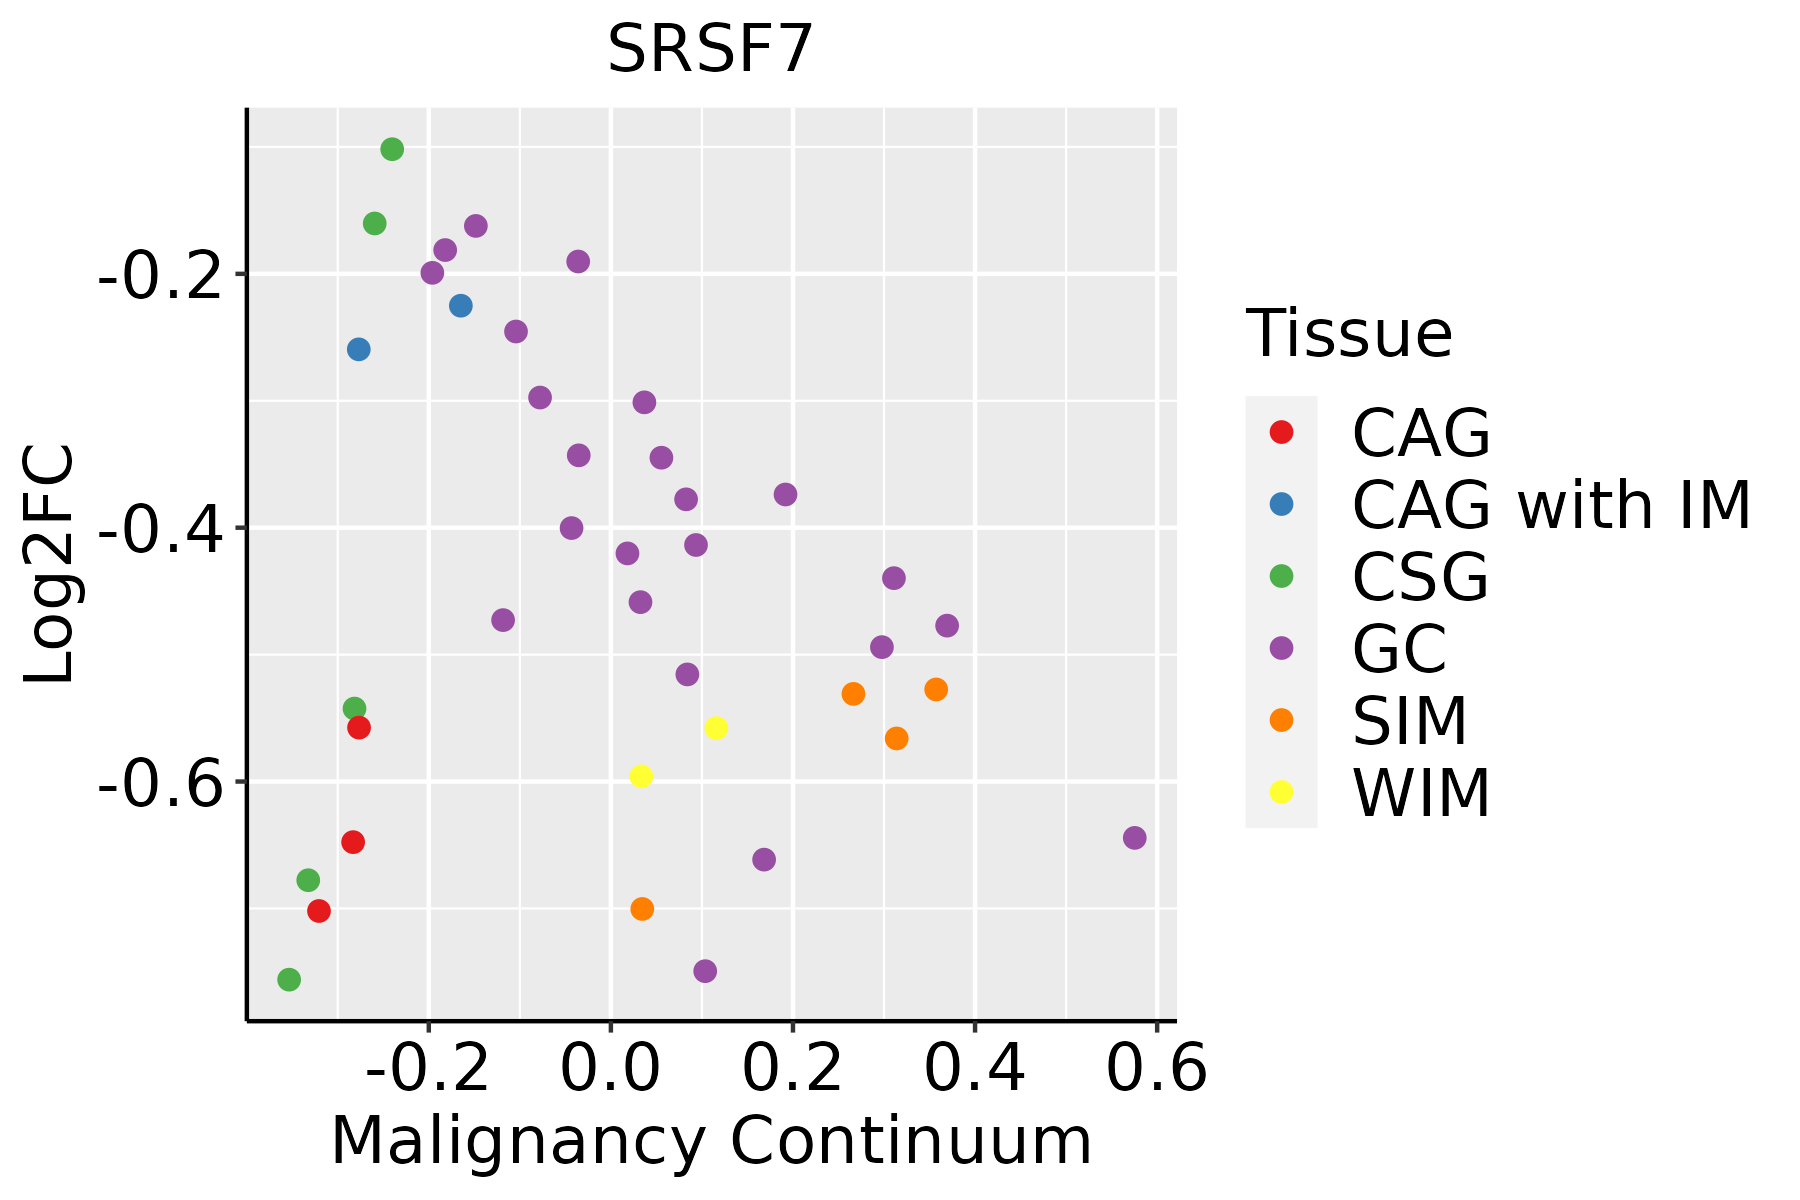 | CAG: Chronic atrophic gastritis |
| CAG with IM: Chronic atrophic gastritis with intestinal metaplasia | ||
| CSG: Chronic superficial gastritis | ||
| GC: Gastric cancer | ||
| SIM: Severe intestinal metaplasia | ||
| WIM: Wild intestinal metaplasia | ||
| Liver | 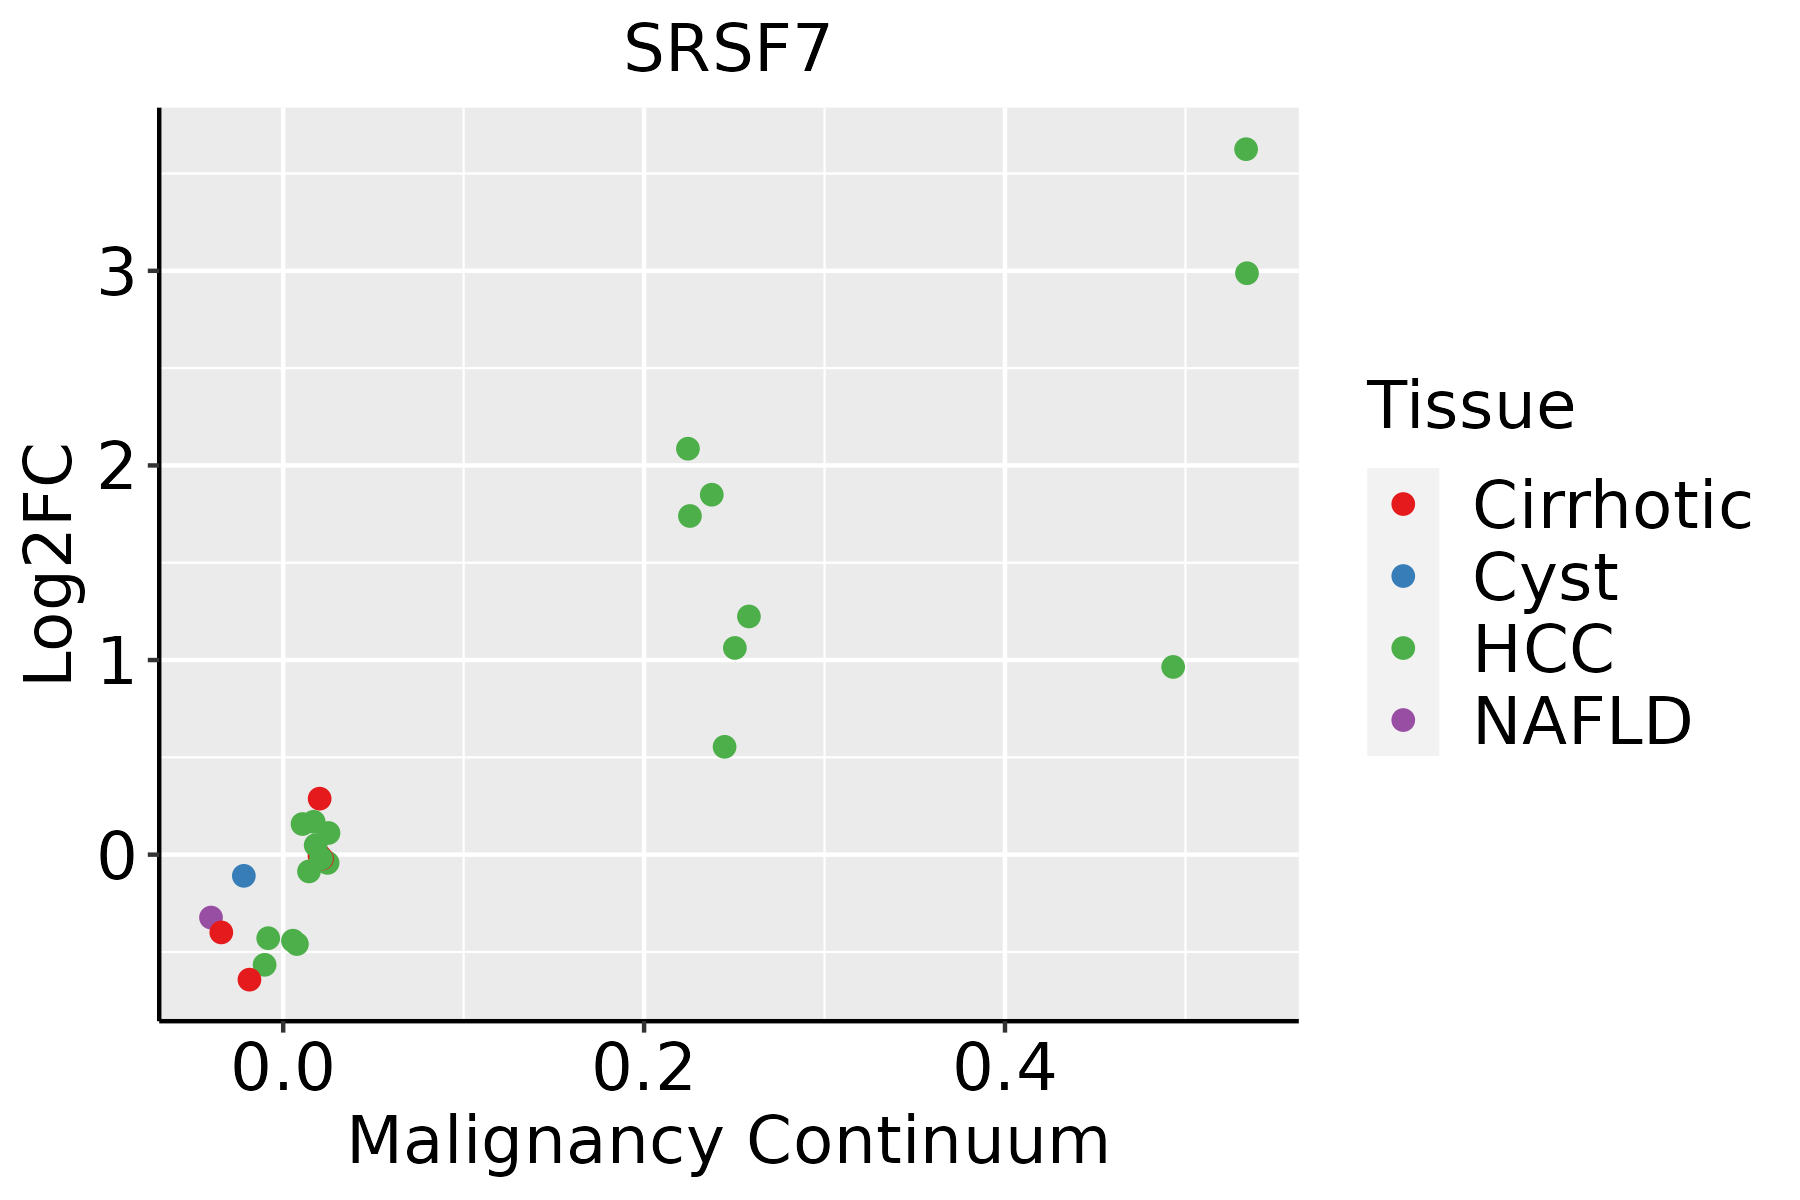 | HCC: Hepatocellular carcinoma |
| NAFLD: Non-alcoholic fatty liver disease | ||
| Lung |  | AAH: Atypical adenomatous hyperplasia |
| AIS: Adenocarcinoma in situ | ||
| IAC: Invasive lung adenocarcinoma | ||
| MIA: Minimally invasive adenocarcinoma | ||
| Oral Cavity |  | EOLP: Erosive Oral lichen planus |
| LP: leukoplakia | ||
| NEOLP: Non-erosive oral lichen planus | ||
| OSCC: Oral squamous cell carcinoma | ||
| Prostate | 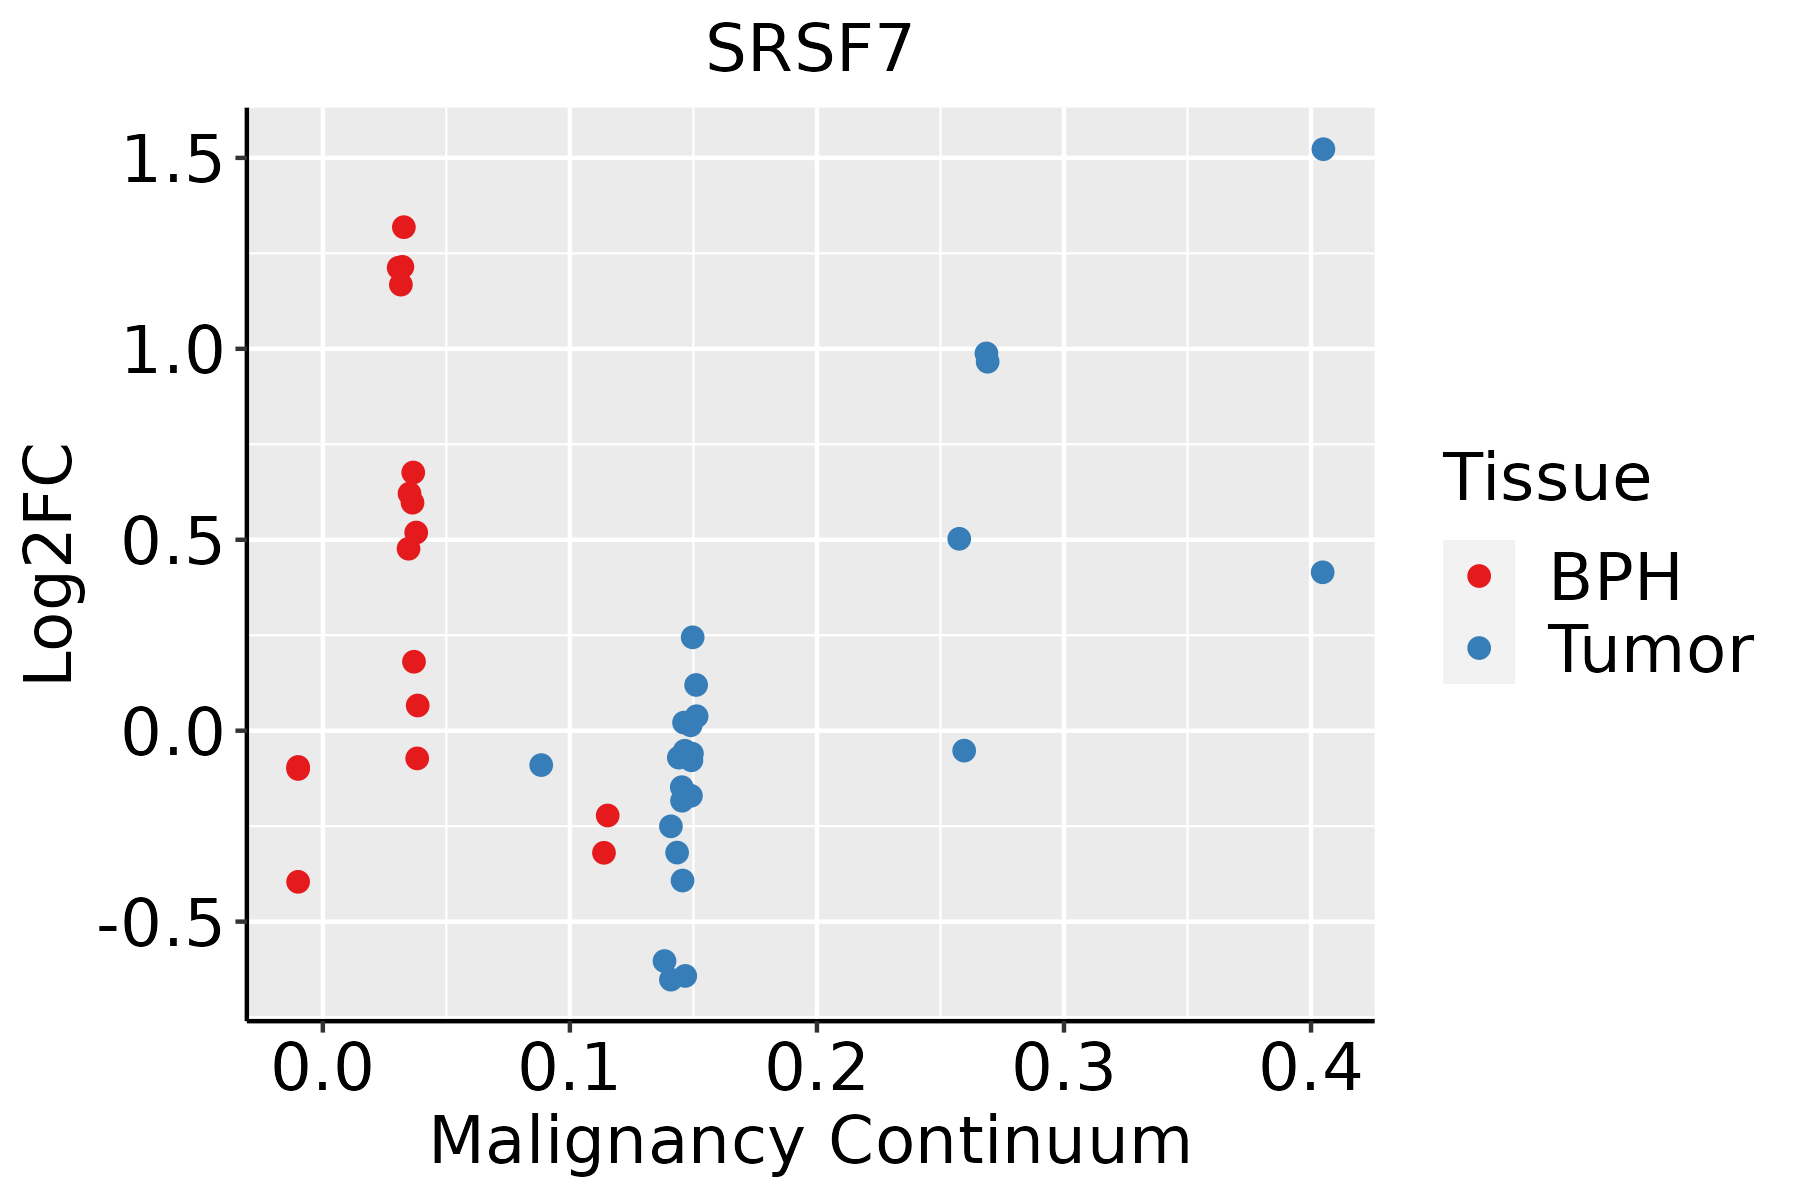 | BPH: Benign Prostatic Hyperplasia |
| Skin | 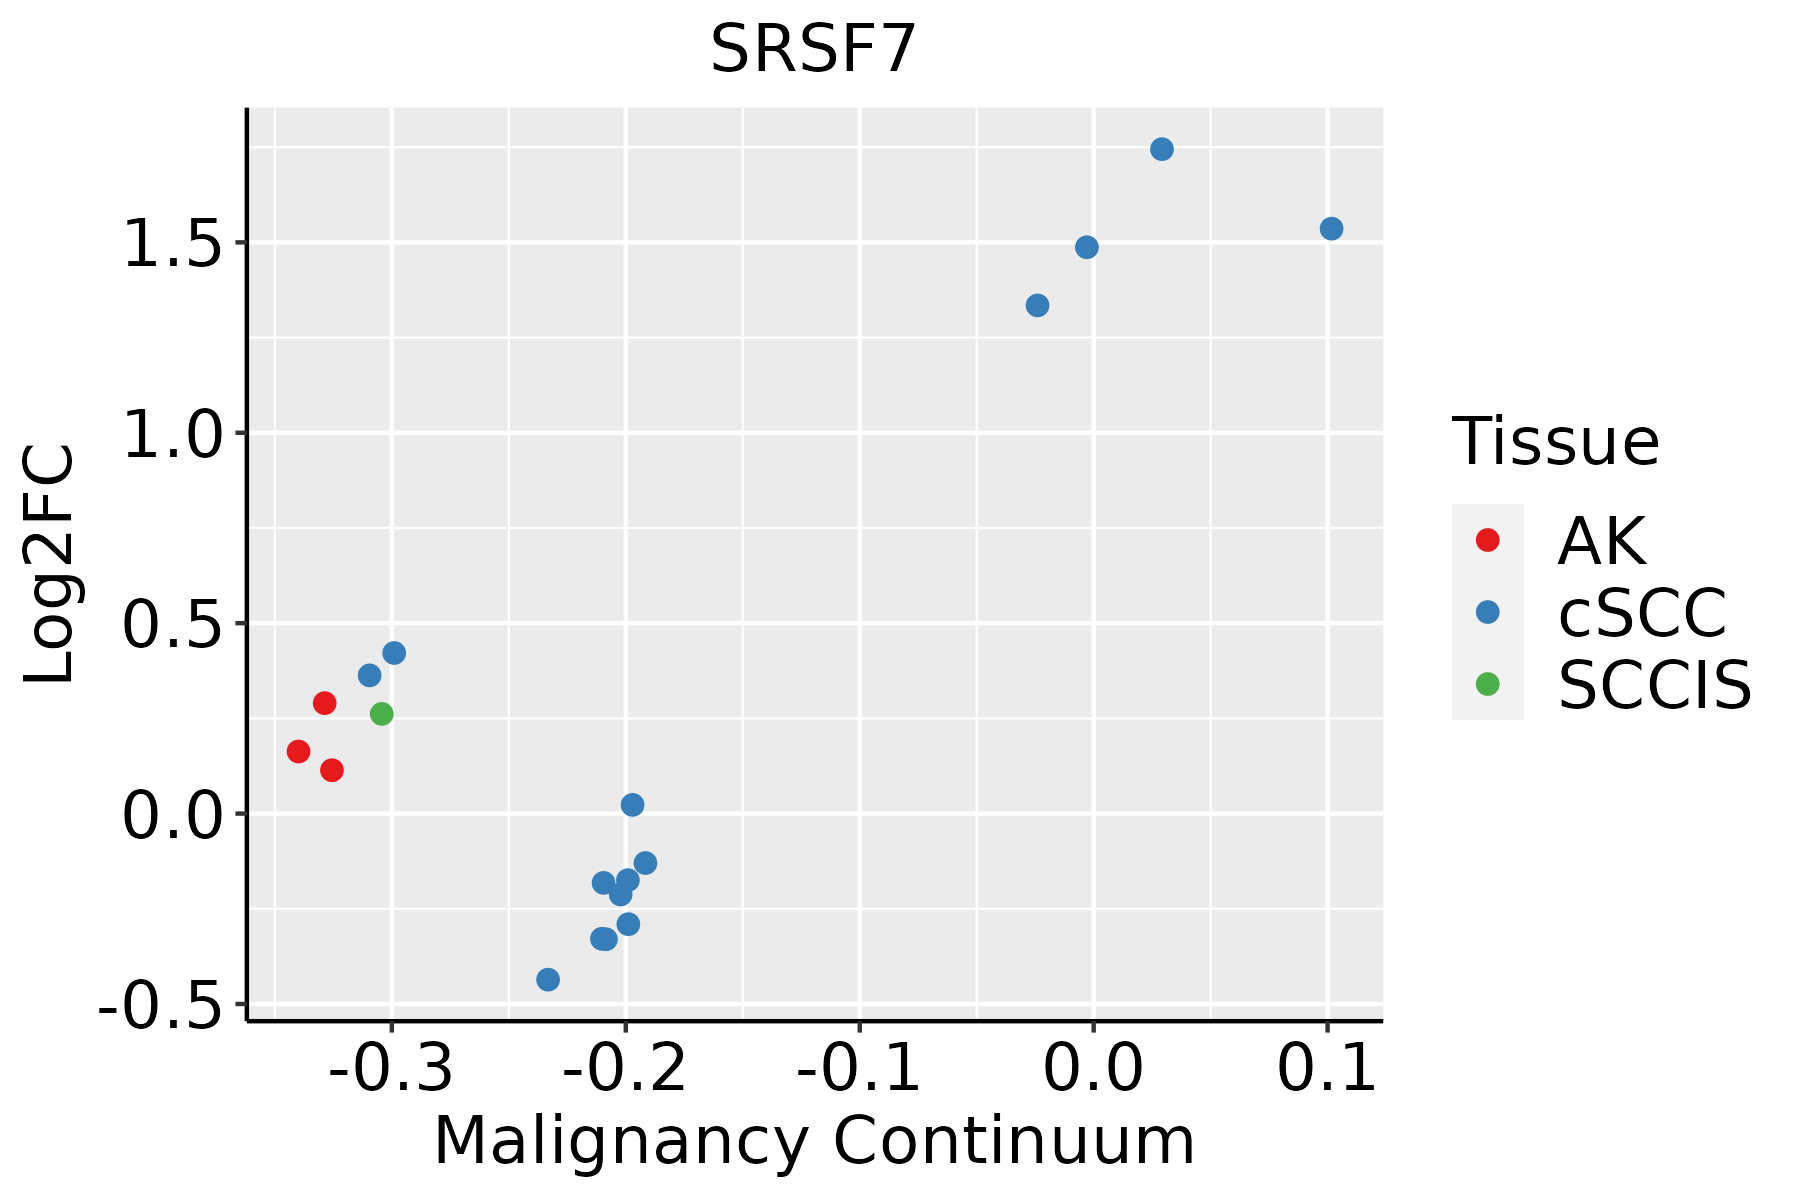 | AK: Actinic keratosis |
| cSCC: Cutaneous squamous cell carcinoma | ||
| SCCIS:squamous cell carcinoma in situ | ||
| Thyroid |  | ATC: Anaplastic thyroid cancer |
| HT: Hashimoto's thyroiditis | ||
| PTC: Papillary thyroid cancer |
| ∗log2FC in expression of this searched gene in stem-like cells from each diseased tissue sample relative to stem-like cells in normal samples in each tissue plotted against the malignancy continuum. Samples are colored based on if they are from different disease stage. |
Top |
Malignant transformation related pathway analysis |
| Find out the enriched GO biological processes and KEGG pathways involved in transition from healthy to precancer to cancer |
| Tissue | Disease Stage | Enriched GO biological Processes |
| Colorectum | AD |  |
| Colorectum | SER |  |
| Colorectum | MSS |  |
| Colorectum | MSI-H |  |
| Colorectum | FAP |  |
| ∗Top 15 enriched GO BP terms are showed in the bar plot of each disease state in each tissue. Each row represents a significant GO biological process which is colored according to the -log10(p.adjust). |
| Page: 1 2 3 4 5 6 7 8 9 |
| GO ID | Tissue | Disease Stage | Description | Gene Ratio | Bg Ratio | pvalue | p.adjust | Count |
| GO:00083809 | Breast | Precancer | RNA splicing | 65/1080 | 434/18723 | 1.27e-12 | 2.53e-10 | 65 |
| GO:00434849 | Breast | Precancer | regulation of RNA splicing | 34/1080 | 148/18723 | 2.66e-12 | 4.75e-10 | 34 |
| GO:00003759 | Breast | Precancer | RNA splicing, via transesterification reactions | 52/1080 | 324/18723 | 1.74e-11 | 2.22e-09 | 52 |
| GO:00003779 | Breast | Precancer | RNA splicing, via transesterification reactions with bulged adenosine as nucleophile | 51/1080 | 320/18723 | 3.55e-11 | 4.04e-09 | 51 |
| GO:00003989 | Breast | Precancer | mRNA splicing, via spliceosome | 51/1080 | 320/18723 | 3.55e-11 | 4.04e-09 | 51 |
| GO:00480249 | Breast | Precancer | regulation of mRNA splicing, via spliceosome | 22/1080 | 101/18723 | 5.29e-08 | 3.18e-06 | 22 |
| GO:19033118 | Breast | Precancer | regulation of mRNA metabolic process | 38/1080 | 288/18723 | 1.63e-06 | 5.97e-05 | 38 |
| GO:00506848 | Breast | Precancer | regulation of mRNA processing | 23/1080 | 137/18723 | 3.49e-06 | 1.13e-04 | 23 |
| GO:00331199 | Breast | Precancer | negative regulation of RNA splicing | 9/1080 | 25/18723 | 6.03e-06 | 1.72e-04 | 9 |
| GO:19033129 | Breast | Precancer | negative regulation of mRNA metabolic process | 16/1080 | 92/18723 | 6.70e-05 | 1.35e-03 | 16 |
| GO:00480255 | Breast | Precancer | negative regulation of mRNA splicing, via spliceosome | 6/1080 | 20/18723 | 6.99e-04 | 8.43e-03 | 6 |
| GO:00064039 | Breast | Precancer | RNA localization | 23/1080 | 201/18723 | 1.34e-03 | 1.41e-02 | 23 |
| GO:19908303 | Breast | Precancer | cellular response to leukemia inhibitory factor | 13/1080 | 94/18723 | 2.83e-03 | 2.49e-02 | 13 |
| GO:19908233 | Breast | Precancer | response to leukemia inhibitory factor | 13/1080 | 95/18723 | 3.11e-03 | 2.64e-02 | 13 |
| GO:00506865 | Breast | Precancer | negative regulation of mRNA processing | 6/1080 | 29/18723 | 5.49e-03 | 4.01e-02 | 6 |
| GO:000838014 | Breast | IDC | RNA splicing | 73/1434 | 434/18723 | 1.27e-10 | 1.57e-08 | 73 |
| GO:004348414 | Breast | IDC | regulation of RNA splicing | 36/1434 | 148/18723 | 3.32e-10 | 3.77e-08 | 36 |
| GO:000037514 | Breast | IDC | RNA splicing, via transesterification reactions | 58/1434 | 324/18723 | 9.44e-10 | 9.58e-08 | 58 |
| GO:000037714 | Breast | IDC | RNA splicing, via transesterification reactions with bulged adenosine as nucleophile | 57/1434 | 320/18723 | 1.60e-09 | 1.49e-07 | 57 |
| GO:000039814 | Breast | IDC | mRNA splicing, via spliceosome | 57/1434 | 320/18723 | 1.60e-09 | 1.49e-07 | 57 |
| Page: 1 2 3 4 5 6 7 8 9 10 11 12 13 14 15 16 17 18 19 20 21 22 23 24 25 |
| Pathway ID | Tissue | Disease Stage | Description | Gene Ratio | Bg Ratio | pvalue | p.adjust | qvalue | Count |
| hsa0501416 | Breast | Precancer | Amyotrophic lateral sclerosis | 98/684 | 364/8465 | 2.13e-28 | 8.41e-27 | 6.44e-27 | 98 |
| hsa030408 | Breast | Precancer | Spliceosome | 39/684 | 217/8465 | 1.44e-06 | 2.27e-05 | 1.74e-05 | 39 |
| hsa0501417 | Breast | Precancer | Amyotrophic lateral sclerosis | 98/684 | 364/8465 | 2.13e-28 | 8.41e-27 | 6.44e-27 | 98 |
| hsa0304013 | Breast | Precancer | Spliceosome | 39/684 | 217/8465 | 1.44e-06 | 2.27e-05 | 1.74e-05 | 39 |
| hsa0501423 | Breast | IDC | Amyotrophic lateral sclerosis | 102/867 | 364/8465 | 1.29e-22 | 5.22e-21 | 3.91e-21 | 102 |
| hsa0304023 | Breast | IDC | Spliceosome | 40/867 | 217/8465 | 1.53e-04 | 1.42e-03 | 1.06e-03 | 40 |
| hsa0501433 | Breast | IDC | Amyotrophic lateral sclerosis | 102/867 | 364/8465 | 1.29e-22 | 5.22e-21 | 3.91e-21 | 102 |
| hsa0304033 | Breast | IDC | Spliceosome | 40/867 | 217/8465 | 1.53e-04 | 1.42e-03 | 1.06e-03 | 40 |
| hsa0501443 | Breast | DCIS | Amyotrophic lateral sclerosis | 101/846 | 364/8465 | 7.14e-23 | 2.88e-21 | 2.12e-21 | 101 |
| hsa0304043 | Breast | DCIS | Spliceosome | 40/846 | 217/8465 | 8.97e-05 | 8.52e-04 | 6.28e-04 | 40 |
| hsa0501453 | Breast | DCIS | Amyotrophic lateral sclerosis | 101/846 | 364/8465 | 7.14e-23 | 2.88e-21 | 2.12e-21 | 101 |
| hsa0304053 | Breast | DCIS | Spliceosome | 40/846 | 217/8465 | 8.97e-05 | 8.52e-04 | 6.28e-04 | 40 |
| hsa0501418 | Cervix | CC | Amyotrophic lateral sclerosis | 103/1267 | 364/8465 | 1.79e-11 | 4.47e-10 | 2.64e-10 | 103 |
| hsa0501419 | Cervix | CC | Amyotrophic lateral sclerosis | 103/1267 | 364/8465 | 1.79e-11 | 4.47e-10 | 2.64e-10 | 103 |
| hsa0501444 | Cervix | N_HPV | Amyotrophic lateral sclerosis | 41/349 | 364/8465 | 3.11e-09 | 1.06e-07 | 8.26e-08 | 41 |
| hsa0501454 | Cervix | N_HPV | Amyotrophic lateral sclerosis | 41/349 | 364/8465 | 3.11e-09 | 1.06e-07 | 8.26e-08 | 41 |
| hsa0501420 | Endometrium | AEH | Amyotrophic lateral sclerosis | 123/1197 | 364/8465 | 2.17e-22 | 7.82e-21 | 5.72e-21 | 123 |
| hsa030409 | Endometrium | AEH | Spliceosome | 54/1197 | 217/8465 | 1.47e-05 | 1.65e-04 | 1.21e-04 | 54 |
| hsa05014110 | Endometrium | AEH | Amyotrophic lateral sclerosis | 123/1197 | 364/8465 | 2.17e-22 | 7.82e-21 | 5.72e-21 | 123 |
| hsa0304014 | Endometrium | AEH | Spliceosome | 54/1197 | 217/8465 | 1.47e-05 | 1.65e-04 | 1.21e-04 | 54 |
| Page: 1 2 3 4 |
Top |
Cell-cell communication analysis |
| Identification of potential cell-cell interactions between two cell types and their ligand-receptor pairs for different disease states |
| Ligand | Receptor | LRpair | Pathway | Tissue | Disease Stage |
| Page: 1 |
Top |
Single-cell gene regulatory network inference analysis |
| Find out the significant the regulons (TFs) and the target genes of each regulon across cell types for different disease states |
| TF | Cell Type | Tissue | Disease Stage | Target Gene | RSS | Regulon Activity |
| ∗The dot plots of a searched regulon are shown for all cell subpopulations in each disease state of each tissue based on the regulon specific score inferred using pySCENIC and by calculating the average expression. |
| Page: 1 |
Top |
Somatic mutation of malignant transformation related genes |
| Annotation of somatic variants for genes involved in malignant transformation |
| Hugo Symbol | Variant Class | Variant Classification | dbSNP RS | HGVSc | HGVSp | HGVSp Short | SWISSPROT | BIOTYPE | SIFT | PolyPhen | Tumor Sample Barcode | Tissue | Histology | Sex | Age | Stage | Therapy Types | Drugs | Outcome |
| SRSF7 | insertion | Frame_Shift_Ins | novel | c.281_282insTATAGAT | p.Pro95IlefsTer9 | p.P95Ifs*9 | Q16629 | protein_coding | TCGA-A2-A0D4-01 | Breast | breast invasive carcinoma | Female | <65 | I/II | Chemotherapy | adriamycin | SD | ||
| SRSF7 | insertion | Frame_Shift_Ins | novel | c.280_281insATCTAGATGCAGCGATCGG | p.Pro94HisfsTer14 | p.P94Hfs*14 | Q16629 | protein_coding | TCGA-A2-A0D4-01 | Breast | breast invasive carcinoma | Female | <65 | I/II | Chemotherapy | adriamycin | SD | ||
| SRSF7 | insertion | Frame_Shift_Ins | novel | c.85_86insCAAATTCCAGCCTTGTGGGG | p.Arg29ThrfsTer16 | p.R29Tfs*16 | Q16629 | protein_coding | TCGA-A8-A06P-01 | Breast | breast invasive carcinoma | Female | <65 | III/IV | Unspecific | SD | |||
| SRSF7 | SNV | Missense_Mutation | rs770532615 | c.629N>A | p.Arg210Gln | p.R210Q | Q16629 | protein_coding | deleterious(0.03) | benign(0) | TCGA-5M-AAT6-01 | Colorectum | colon adenocarcinoma | Female | <65 | III/IV | Unknown | Unknown | PD |
| SRSF7 | SNV | Missense_Mutation | c.86G>T | p.Arg29Met | p.R29M | Q16629 | protein_coding | deleterious(0.01) | probably_damaging(0.962) | TCGA-AA-3663-01 | Colorectum | colon adenocarcinoma | Male | <65 | I/II | Unknown | Unknown | SD | |
| SRSF7 | SNV | Missense_Mutation | rs375213460 | c.560N>T | p.Ser187Leu | p.S187L | Q16629 | protein_coding | tolerated_low_confidence(0.27) | possibly_damaging(0.885) | TCGA-AA-3862-01 | Colorectum | colon adenocarcinoma | Male | >=65 | I/II | Unknown | Unknown | SD |
| SRSF7 | SNV | Missense_Mutation | novel | c.191T>C | p.Val64Ala | p.V64A | Q16629 | protein_coding | deleterious(0.02) | possibly_damaging(0.842) | TCGA-AA-3984-01 | Colorectum | colon adenocarcinoma | Female | <65 | I/II | Unknown | Unknown | SD |
| SRSF7 | SNV | Missense_Mutation | c.659N>T | p.Arg220Ile | p.R220I | Q16629 | protein_coding | deleterious(0) | probably_damaging(0.944) | TCGA-CA-6718-01 | Colorectum | colon adenocarcinoma | Male | <65 | I/II | Unknown | Unknown | PD | |
| SRSF7 | SNV | Missense_Mutation | novel | c.263N>A | p.Arg88Lys | p.R88K | Q16629 | protein_coding | tolerated(0.36) | benign(0.057) | TCGA-AG-A002-01 | Colorectum | rectum adenocarcinoma | Male | <65 | I/II | Unknown | Unknown | SD |
| SRSF7 | SNV | Missense_Mutation | rs763176583 | c.614N>A | p.Arg205Gln | p.R205Q | Q16629 | protein_coding | tolerated(0.33) | benign(0.062) | TCGA-AP-A0LM-01 | Endometrium | uterine corpus endometrioid carcinoma | Female | <65 | III/IV | Chemotherapy | cisplatin | SD |
| Page: 1 2 3 |
Top |
Related drugs of malignant transformation related genes |
| Identification of chemicals and drugs interact with genes involved in malignant transfromation |
| (DGIdb 4.0) |
| Entrez ID | Symbol | Category | Interaction Types | Drug Claim Name | Drug Name | PMIDs |
| Page: 1 |

Copyright 2023-Present -The University of Texas Health Science Center at Houston |